Department of Pharmaceutics, Centre for Pharmaceutical Sciences, UCESTH, Jawaharlal Nehru Technological University, Hyderabad, Kukatpally, Telangana-500085, India.
The main aim of the present study is to formulate and evaluate ezetimibe nanoemulsion to enhance its solubility, stability, and therapeutic efficacy. Ezetimibe, a poorly water-soluble antihyperlipidemic drug, exhibits limited bioavailability, making it a suitable candidate for nanoemulsion-based delivery. Oils, surfactants, and co-surfactants were screened through solubility studies, leading to the selection of Capryol 90, Tween 80, and Transcutol HP as optimal components. Pseudo-ternary phase diagrams were constructed to identify suitable nanoemulsion regions, and formulations were prepared using aqueous titration followed by homogenization. The developed formulations were evaluated for thermodynamic stability, droplet size, polydispersity index (PDI), zeta potential, viscosity, pH, drug content, and in vitro diffusion. Among the tested formulations, F2 demonstrated superior characteristics with a droplet size of 97 nm, a zeta potential of –28.3 mV, and drug content of 95.92 ± 0.62%. In vitro diffusion studies confirmed a rapid and sustained drug release profile, achieving 96.5% cumulative release within 60 minutes. FTIR analysis confirmed drug–excipient compatibility without evidence of chemical degradation. The findings suggest that ezetimibe nanoemulsion represents a promising drug delivery system to overcome solubility limitations and improve therapeutic performance.
Nanoemulsions are thermodynamically stable colloidal dispersions formed by mixing two immiscible liquids with the aid of surfactants and co-surfactants, which lower interfacial tension and yield a uniform phase. They are usually transparent or translucent and are also described as ultrafine, submicron, or mini-emulsions. Depending on the arrangement of dispersed and continuous phases, nanoemulsions are categorized as oil-in-water (O/W), where oil droplets are distributed in water; water-in-oil (W/O), where water droplets are distributed within oil; and bi-continuous systems, in which microdomains of both oil and water coexist throughout the formulation.[1]
COMPONENTS OF NANOEMULSION
Table 1: Lists of components
|
Components |
Examples |
|
Oil |
Capryol 90, Castor oil, Labrafil |
|
Surfactant |
Labrasol, Tween 40, Tween 80 |
|
Co-Surfactant |
Transcutol HP, PEG 400, Polysorbate 80 |
|
Aqueous phase |
Distilled water |
METHODS OF PREPARATION
There are many techniques used to create nanoemulsion drug delivery systems, and many of them overlap. We have grouped these methods based on how much energy they require, the type of phase inversion involved, and whether they use self-emulsification. High energy methods include high-pressure homogenization, microfluidization, and ultrasonication. Low energy methods include phase inversion emulsification, which can be transitional (such as phase inversion temperature or composition) or catastrophic (such as emulsion inversion point), as well as the self-nanoemulsification method.[2]
This technique involves the application of high pressure to a system containing an oil phase, an aqueous phase & a surfactant or co-surfactant. The pressure is exerted using specialized equipment known as a homogenizer. However, there are several issues associated with homogenizers, including low productivity, component degradation due to challenges in mass production, and excessive heat generation. This method is limited to producing only oil-in-water (o/w) liquid nanoemulsions with an oil phase of less than 20%, and it is not capable of creating cream nanoemulsions with high viscosity or hardness that have a mean droplet diameter of less than 200nm.[3]
Microfluidization is a technique for mixing that employs a device known as a microfluidizer. This device operates using a high-pressure positive displacement pump, which can range from 500 to 20,000psi, to propel the product through an interaction chamber composed of small channels referred to as 'microchannels'. As the product traverses these microchannels, it reaches an impingement area, leading to the formation of extremely fine particles within the sub-micron range. The two phases, namely the aqueous & oily phases, are amalgamated & processed in an inline homogenizer to create a coarse emulsion. Subsequently, this coarse emulsion is introduced into a microfluidizer for further processing, aiming to achieve a stable nanoemulsion. The coarse emulsion is cycled through the interaction chamber of the microfluidizer multiple times until the target particle size is reached. Finally, the bulk emulsion is filtered through a filter under nitrogen to eliminate larger droplets, resulting in a consistent nanoemulsion.[4]
Sonication, also known as ultrasonic homogenization, is employed to produce kinetically stable nanoemulsions. In this process, a sonicator probe is placed in contact with a dispersion containing liquids, surfactants, and cosurfactants. The probe generates mechanical vibrations and cavitation, supplying the energy required to form small droplets. Sonication is commonly utilized for small-scale nanoemulsion production. To avoid shear-induced coalescence, operational parameters must be carefully controlled. The particle size of the dispersed phase decreases as the duration of sonication, power input, and surfactant concentration increase. Achieving a droplet size of approximately 20 nm requires optimization of the ultrasonic reaction chamber design, operating conditions, and formulation variables such as surfactant concentration and oil phase composition. A primary limitation of sonication is its unsuitability for preparing large volumes of nanoemulsions.[5]
For the preparation of nanoemulsion systems, these methods require low energy.
Low-energy emulsification techniques are more energy efficient as they use internal chemical energy of the systems & only require gentle stirring for the creation of nanoemulsions.[2]
In the phase inversion temperature (PIT) method, the temperature of the emulsion system is raised to alter the solubilizing behavior of the surfactant (from hydrophilic to lipophilic), resulting in the formation of bicontinuous microemulsions and subsequent emulsion inversion. This process consists of four steps:
(i) When the temperature is below the PIT, a macro-emulsion is present, characterized by nonionic surfactants, primarily hydrophilic.
(ii) As the temperature increases, the surfactants slowly transition to a lipophilic state and become solubilized by the oil phase.
(iii) At the PIT, bicontinuous microemulsions are formed.
(iv) When the temperature exceeds the PIT, the emulsion undergoes inversion, with water being dispersed into the mixture of oil and lipophilic surfactant. The system is then rapidly cooled through water dilution, which instantaneously renders the surfactant hydrophilic, thereby prompting spontaneous and swift migration to the aqueous phase. This turbulent displacement facilitates the generation of nanoemulsions.[6]
The EIP method represents a low-energy & spontaneous approach to emulsification. Under constant temperature conditions, this method facilitates the alteration of the intrinsic characteristics of thermodynamically stable microemulsions or liquid crystals, transforming them into nano-structured forms through a gradual dilution with either water or oil. This process leads to the formation of thermodynamically unstable yet kinetically stable direct or inverse nanoemulsions. A minor adjustment in the ratio of water or oil within the established microemulsion system will modify the surfactant hydration pattern & its affinity for the aqueous phase. Consequently, this induces instabilities within the microemulsion system, ultimately resulting in its disintegration into nano-emulsion.[6]
Spontaneous emulsions are generated in this method by combining water & oil with an emulsifier through gentle stirring at a specific temperature. The gentle magnetic stirring facilitates the mixing of phases, allowing the emulsifier to migrate into the aqueous phase, which increases the oil-water interfacial area & leads to the formation of oil droplets. Spontaneous emulsification consists of three primary steps, which are as follows:
Applications of Nanoemulsions
The nanoemulsions are used in a wide range of fields like pharmaceuticals, biomedical fields, cosmetics, food, agriculture, and industry because of their unique physicochemical properties and ability to improve solubility, stability, and targeted delivery of active compounds.
Pharmaceutical Applications
In pharmaceutical industry, the nanoemulsions are used in various drug delivery systems as they can increase the solubility of poorly water soluble drugs, thus increasing their bioavailability and therapeutic efficacy. Nanoemulsions facilitate the controlled and targeted release of active ingredients, thereby decreasing the frequency of doses and minimizing side effects. Furthermore, they provide safeguarding for delicate compounds from enzymatic or oxidative breakdown, thereby guaranteeing stability throughout formulation and storage. Owing to their small droplet size and extensive surface area, nanoemulsions can be efficiently delivered via various routes including oral, parenteral, transdermal, ocular, and pulmonary, positioning them as a promising platform for contemporary pharmaceutical applications.
Cosmetic Applications
Nanoemulsion is extensively utilized in the cosmetic sector because its active components are readily absorbed, resulting in effective action due to its characteristic properties, including a small droplet size and the capacity to minimize water loss from the skin. Nanoemulsions are employed in moisturizers, lotions, and creams. As an appealing delivery system in cosmetics, the droplet size of nanoemulsions is extremely small, preventing creaming and flocculation, which contributes to a more refined product that enhances uptake by antigen-presenting cells in stable formulations. The incorporation of nanoemulsion in cosmetic products facilitates the swift penetration of active ingredients through the skin, attributed to the large surface area of the droplets. It is also observed that nanoemulsions can penetrate effectively through rough skin. This characteristic of nanoemulsion reduces the need for additional penetration enhancers, which can lead to formulation incompatibility.[8]
Nanoemulsion in Food industry
Nanoemulsions present a diverse array of applications owing to their compositional versatility across various sectors, particularly in the food and beverage industries. In contrast to microemulsions, nanoemulsions have gained significant traction in food processing due to their diminutive size, thermodynamic stability, and the ability to continuously self-assemble with both hydrophilic and hydrophobic components. Their transparency and minimal light wave scattering capabilities ultimately facilitate their integration into optically clear products, such as enhanced soft drinks and bottled waters. Unlike traditional micro or other standard emulsions, nanoemulsions can be formulated to exhibit greater viscosity or a gel-like consistency, even at very low droplet concentrations, making them suitable for creating products with reduced fat content and innovative textures.[9]
Advantages and Disadvantages of Nanoemulsions
ADVANTAGES
DISADVANTAGES
MATERIALS AND METHODS
MATERIALS
Table 2: Equipment’s List
|
S. No. |
Equipment |
Make/Model |
|
1. |
Weighing Balance |
Essae |
|
2. |
UV-Visible spectrophotometer |
Shimadzu UV-1800 |
|
3. |
Cyclomixer |
Remi CM 101 |
|
4. |
Zeta sizer |
Malvern-Nano ZS90 |
|
5. |
Centrifuge |
REMI equipment pvt limited |
|
6. |
Micropipette |
PFfact |
|
7. |
Magnetic Stirrer |
REMI 1MLH |
|
8. |
FTIR |
Bruker Company |
|
9. |
Homogenizer |
Remi RQ 121 |
Table 3: Lists of Chemicals
|
S. No. |
Chemicals |
Category |
Manufacturer |
|
1. |
Ezetimibe |
Drug |
Aurobindo |
|
2. |
Capryol 90 |
Oil |
Gatte Fosse Pvt. Ltd. Mumbai |
|
3. |
Labrafil M 1944 CS |
Oil |
Gatte Fosse Pvt. Ltd. Mumbai |
|
4. |
Labrafac PG |
Oil |
Gatte Fosse Pvt. Ltd. Mumbai |
|
5. |
Labrafac Lipophile WL 1349 |
Oil |
Gatte Fosse Pvt. Ltd. Mumbai |
|
6. |
Capmul MCM C8 EP |
Oil |
ABITEC Corporation |
|
7. |
Capmul PG8 NF |
Oil |
ABITEC Corporation |
|
8. |
Capmul MCM NF |
Oil |
ABITEC Corporation |
|
9. |
Oleic acid |
Oil |
Reasearch-Lab Fine Chem Industries |
|
10. |
Peceol |
Oil |
Gatte Fosse Pvt. Ltd. Mumbai |
|
11. |
Tween 40 |
Surfactant |
Fluka |
|
12. |
Tween 80 |
Surfactant |
Fluka |
|
13. |
Labrasol ALF |
Surfactant |
Gatte Fosse Pvt. Ltd. Mumbai |
|
14. |
Lauroglycol FCC |
Surfactant |
Gatte Fosse Pvt. Ltd. Mumbai |
|
15. |
Kolliphor RH 40 |
Surfactant |
Gatte Fosse Pvt. Ltd. Mumbai |
|
16. |
Transcutol HP |
Co-Surfactant |
Gatte Fosse Pvt. Ltd. Mumbai |
|
17. |
Propylene glycol |
Co-Surfactant |
Sisco SO Fine chem Limited |
|
18. |
PEG 400 |
Co-Surfactant |
SDFCL SO Fine chem Limited |
|
19. |
PEG 600 |
Co-Surfactant |
SDFCL SO Fine chem Limited |
|
20. |
Plurol oleique |
Co-Surfactant |
Gatte Fosse Pvt. Ltd. Mumbai |
|
21. |
Acetonitrile |
Analytical agent |
Avra Synthesis Pvt.Ltd. |
METHODOLOGY
Standard calibration curve of Ezetimibe in Acetonitrile
The λmax of drug sample was determined by scanning 10ppm standard stock solution in the range from 200-400nm using Shimadzu-1800 UV spectrometer.
Ezetimibe (10mg) was dissolved in Acetonitrile (10ml).[1000µg/ml] 1ml was taken from the above solution and made upto 10ml with acetonitrile. [100µg/ml] Dilutions were made 5ppm, 10ppm, 15ppm, 20ppm, 25ppm and were subjected to UV spectrophotometer. Absorbance was measured at 231nm.
SOLUBILITY STUDIES
Solubility of Ezetimibe in various components (oils, surfactants & cosurfactants) was determined by adding an excess amount of drug in 500mg of selected vehicle in 5ml capacity stoppered vials, and mixed using a cyclomixer. These vials were then kept at 25±10C in an shaking incubator for 72h to reach equilibrium. The balanced samples were taken out of the shaker and subjected to centrifugation at 3000rpm for a duration of 15 minutes. The supernatant was collected & the concentration of drug was determined using UV spectrophotometer.
FTIR (Fourier Transform Infrared Spectroscopy)
FTIR analysis was performed to evaluate potential interactions between the pure drug (Ezetimibe) & the excipients in the optimized nanoemulsion formulation. A small quantity of each sample (pure drug and nanoemulsion formulation) was taken and dissolved in a minimal amount of chloroform in a clean china dish using a mortar and pestle to aid dispersion. Using a capillary tube, a thin film of the solution was carefully applied onto clean, dry potassium bromide (KBr) or sodium chloride (NaCl) discs and allowed to form a uniform layer. The discs were subsequently positioned within the sample holder of the FTIR spectrophotometer for measurement. The spectra were in the range of 4000 to 400cm-1. A background spectrum was collected prior to each sample scan. The recorded spectra were analyzed for the presence, shift, or disappearance of characteristic peaks, indicating potential interactions or encapsulation of the drug within the formulation matrix.
Construction of pseudo ternary phase diagrams
FORMULATION OF NANOEMULSION
Prepare the homogeneous mixture of oil and Smix (surfactant & cosurfactant). Ezetimibe was precisely measured and subsequently incorporated into the aforementioned mixture. Oil phase then added drop wise to the aqueous phase with continuous mixing using homogenizer leads to the formation of O/W nanoemulsion.
Optimized formulae of Nanoemulsions
Table 4: Optimized formulae of Nanoemulsions
|
Formulation code |
Drug(mg) |
Oil: S mix ratio |
S mix ratio |
Oil (%v/v) |
Surfactant (%v/v) |
Cosurfactant (%v/v) |
Water (%v/v) |
|
F1 |
120 |
3:7 |
4:1 |
16.06 |
26.26 |
7.09 |
50.60 |
|
F2 |
120 |
3:7 |
3:1 |
15.97 |
24.48 |
8.80 |
50.75 |
|
F3 |
120 |
1:9 |
3:1 |
5.41 |
31.94 |
11.50 |
51.15 |
|
F4 |
120 |
5:5 |
2:1 |
12.5 |
8.33 |
4.17 |
75 |
|
F5 |
120 |
1:9 |
1:3 |
5.32 |
10.48 |
33.93 |
50.27 |
|
F6 |
120 |
4:6 |
1:1 |
10 |
7.5 |
7.5 |
75 |
EVALUATION OF NANOEMULSION FORMULATIONS
THERMODYNAMIC STABILITY STUDIES
Selected formulations underwent a series of thermodynamic stability assessments to evaluate their physical stability.
Centrifugation
The prepared formulations were centrifuged at 5000rpm for 30min & observed for phase separation, creaming or cracking.
Freeze Thaw Cycle
A required quantity of the nanoemulsion was transferred into a vial & subjected to three freeze–thaw cycles by storing it at −25?°C for one hour followed by room temperature for one hour. Three freeze-thaw cycles between -21°C & +25°C with formulation storage at each temperature for not less than 48 h were performed.
Determination of particle size and polydispersity index (PDI)
The particle size & PDI of nanoemulsions are evaluated using photon correlation spectroscopy (PCS) with the Malvern Zetasizer, which observes the changes in light scattering due to the Brownian motion of particles over time. PCS operates on the principle that smaller particles move at a higher velocity compared to larger particles. To measure particle size, a specific amount of the formulation is dispersed in distilled water to create a homogeneous dispersion, which must be utilized immediately for the measurement of particle size and PDI.
Determination of zeta potential
The zeta potential serves as a technique for assessing the surface charge of particles when immersed in a liquid medium. This measurement is instrumental in forecasting the stability of dispersions, with its value being influenced by the physicochemical characteristics of the drug, polymer, vehicle, and the presence and adsorption of electrolytes. The Malvern Zetasizer instrument is utilized for this measurement. To determine the zeta potential, the nanoemulsion is diluted & its value is derived from the electrophoretic mobility of the oil droplets. A zeta potential of ±30mV is considered adequate for maintaining the physical stability of the nanoemulsion.
Drug content
A 1mL aliquot of the nanoemulsion formulation was transferred into a 10mL volumetric flask & diluted to volume with acetonitrile. The resulting solution was analyzed for drug content using a UV-visible spectrophotometer at a wavelength of 231nm.
pH
The measured apparent pH of the formulations was determined using a pH meterin triplicate at a temperature of 25°C.
Viscosity
The viscosity of the formulated nanoemulsions was measured undiluted using a Brookfield Viscometer with spindle #C50-1 at a temperature of 25±0.5?C. 1ml of the formulation was utilized for the purpose of determining viscosity. The speed of the spindle was adjusted to 50rpm & a single run was performed at a temperature of 25±0.5?C.
In vitro diffusion studies
A study on in vitro diffusion was performed using a Franz diffusion cell. The investigation was performed using an eggshell membrane. The membrane was prepared appropriately and preserved in a pH 7.4 phosphate buffer prior to its application. A phosphate buffer solution with a pH of 7.4 served as the diffusion medium, and the receptor compartment was filled with this solution. The membrane of the eggshell was placed between the donor & recipient sections of the diffusion cell. One milliliter of the test formulation was added to the donor compartment. The temperature of the diffusion medium was regulated at 37±1°C, while the buffer solution was continuously agitated with a magnetic bead at a rate of 500 to 700 rpm. Samples were extracted from the release medium at intervals of 5, 10, 15, 30, 45, 60, 90, 120, 180, and 240 minutes & replaced with an equivalent volume of fresh buffer solution to sustain sink conditions. The samples were analyzed spectrophotometrically at a wavelength of 231 nm against their corresponding blank.
Stability studies
Stability evaluation of the optimized nanoemulsion was performed at accelerated storage conditions (40 °C/75% RH).
RESULTS AND DISCUSSION
Calibration plot of Ezetimibe
Determination of λmax
λmax of Ezetimibe in acetonitrile was found to be 231nm. When examined in the range of 200-400nm, Ezetimibe showed an absorption maxima at 231nm in acetonitrile. Different concentrations were prepared using acetonitrile. A correlation coefficient of R²=0.9941 was shown in the calibration data.
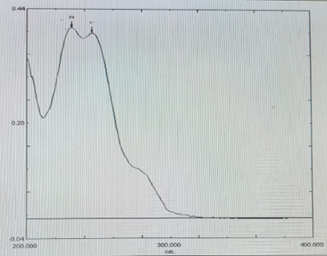
Fig1: Spectrum of Ezetimibe
Calibration curve of Ezetimibe
Table 5: Calibration Curve of Ezetimibe
|
Concentration (µg/ml) |
Absorbance (Mean±SD) |
|
5 |
0.201±0.048 |
|
10 |
0.371±0.064 |
|
15 |
0.476±0.065 |
|
20 |
0.599±0.038 |
|
25 |
0.724±0.056 |
n=3
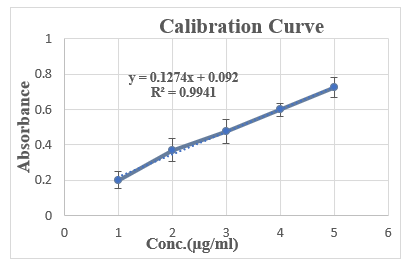
Fig2: Calibration Curve of Ezetimibe at λmax 231nm(n=3)
SOLUBILITY STUDIES OF EZETIMIBE
Table 6: Solubility of Ezetimibe in different oils
|
Oils |
Solubility of ezetimibe (mg/ml) |
|
Capryol 90 |
86.550 ± 0.91 |
|
Capmul MCM C8 EP |
69.148 ± 3.41 |
|
Capmul MCM NF |
53.815 ± 5.15 |
|
Capmul PG8 NF |
77.545 ± 2.15 |
|
Peceol |
17.203 ± 1.90 |
|
Oleic acid |
69.160 ± 2.94 |
|
Labrafil M 1944 CS |
67.486 ± 5.58 |
|
Labrafac PG |
59.74 ± 1.28 |
|
Labrafac Lipophile WL 1349 |
52.768 ± 0.95 |
n = 3
Table 7: Solubility of Ezetimibe in different Surfactants & Co-Surfactants
|
Surfactants & Co-Surfactants |
Solubility of ezetimibe (mg/ml) |
|
Tween 80 |
94.54 ± 0.54 |
|
Tween 40 |
77.552 ± 4.46 |
|
Labrasol ALF |
66.091 ± 1.67 |
|
Kolliphor RH 40 |
29.170 ± 4.54 |
|
Lauroglycol FCC |
63.793 ± 2.49 |
|
Transcutol HP |
83.910 ± 0.75 |
|
Propylene glycol |
49.171 ± 3.76 |
|
PEG 400 |
73.846 ± 2.17 |
|
PEG 600 |
77.560 ± 2.98 |
|
Plurol oleique |
12.824 ± 2.98 |
n = 3
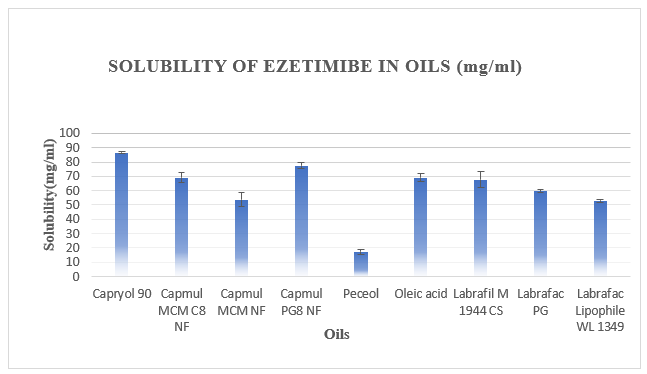
Fig 3: Graph depicting solubility of Ezetimibe in different oils(n=3)
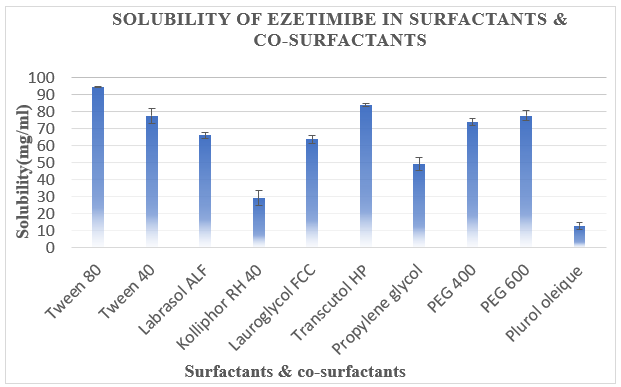
Fig 4: Graph depicting solubility of Ezetimibe in different surfactants & co-surfactants(n=3)
Drug Excipient compatibility studies
Using the FTIR spectrophotometer, the compatibility of pharmacological excipients was examined. FTIR data of the drug alone and the drug combined with the excipients suggested that there was no apparent interaction between the medication & the used excipients.
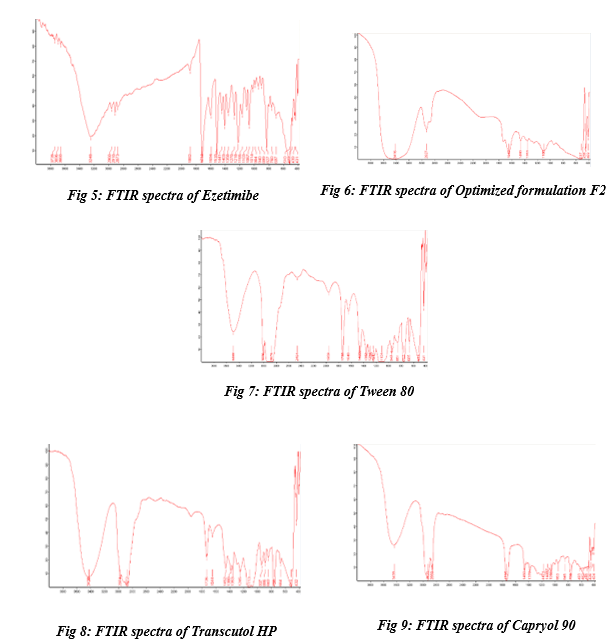
Table 8: Interpretation of pure drug (Ezetimibe) and optimized formulation (F2)
|
S. No |
Wavenumber of Ezetimibe(cm?¹) |
Wavenumber of optimized Formulation F2 (cm?¹) |
Probable Functional Group / Vibration |
Interpretation |
|
1 |
3248 |
3416 |
O–H / N–H stretching |
Broadening & shift indicate H-bonding or interaction |
|
2 |
2910, 2850 |
2927 |
Aliphatic C–H stretching |
Slight shift; possible interaction with surfactant/oil |
|
3 |
1882 |
1842 |
Strained or conjugated C=O (possibly artifact) |
Peak shift; could suggest conformational change or encapsulation |
|
4 |
1510, 1594 |
– |
Aromatic C=C stretching |
Disappearance suggests drug is no longer free/crystalline |
|
5 |
1104, 1060 |
1104 |
C–O stretching (ether or ester) |
Partial retention; indicates structural compatibility |
|
6 |
894 |
– |
=C–H out-of-plane bending |
Disappearance indicates possible encapsulation or loss of free drug |
|
7 |
517, 431 |
517, 403 |
Fingerprint region (C–X, skeletal bending) |
Retained; no major chemical changes |
DISCUSSION: The FTIR spectra of pure Ezetimibe & its optimized nanoemulsion formulation were analyzed to investigate potential interactions. In the pure drug spectrum, characteristic peaks were observed at 3248cm?¹ (O–H/N–H), 2910 and 2850cm?¹ (C–H), 1882 cm?¹ (C=O), 1594 and 1510 cm?¹ (aromatic C=C), and peaks in the fingerprint region such as 1104, 1060, and 894 cm?¹. In the formulation, the O–H/N–H peak shifted to 3416 cm?¹ and became broader, indicating hydrogen bonding with excipients. The C–H peak shifted to 2927 cm?¹, and the carbonyl region showed a shift from 1882 cm?¹ to 1842 cm?¹. Notably, several aromatic and fingerprint peaks (1510, 894 cm?¹) disappeared, suggesting successful drug encapsulation and a reduction in crystallinity. Overall, the FTIR results confirm physical interactions without chemical degradation, supporting the stability and compatibility of the nanoemulsion system.
PSEUDO TERNARY PHASE DIAGRAM
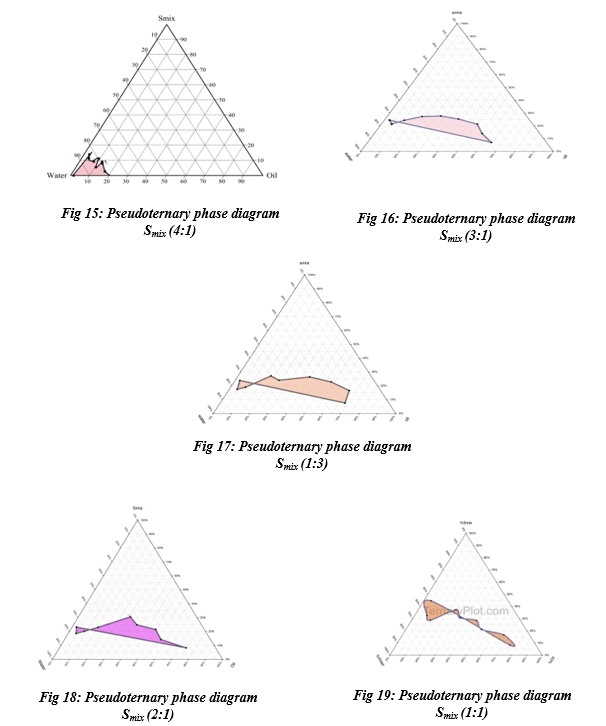
Pseudo ternary phase diagram of Smix ratio 4:1
Table 9: Pseudo ternary phase diagram of Smix ratio 4:1
|
Blank formulation code |
Oil (mg) |
Smix (mg) (4:1) |
Water (mg) |
Total (mg) |
Oil% |
Smix% |
Water% |
Remarks |
|
CT4T1 (1:9) |
50 |
450 |
2734 |
3234 |
1.54 |
13.91 |
84.53 |
Transparent |
|
CT4T1 (2:8) |
100 |
400 |
3048 |
3548 |
2.81 |
11.27 |
85.90 |
Transparent |
|
CT4T1 (3:7) |
150 |
350 |
3333 |
3833 |
3.91 |
9.13 |
86.95 |
Transparent with slight blue |
|
CT4T1 (4:6) |
200 |
300 |
2175 |
2675 |
7.47 |
11.21 |
81.30 |
Transparent |
|
CT4T1 (5:5) |
250 |
250 |
2255 |
2755 |
9.07 |
9.07 |
81.85 |
Transparent |
|
CT4T1 (6:4) |
300 |
200 |
2028 |
2528 |
11.86 |
7.91 |
80.22 |
Transparent |
|
CT4T1 (7:3) |
350 |
150 |
2294 |
2794 |
12.52 |
5.36 |
82.10 |
Transparent |
|
CT4T1 (8:2) |
400 |
100 |
3336 |
3836 |
10.42 |
2.606 |
86.96 |
Transparent |
|
CT4T1 (9:1) |
450 |
50 |
2224 |
2724 |
16.51 |
1.835 |
81.64 |
Transparent |
Fig10: Different ratios of oil and Smix (4:1)
Pseudo ternary phase diagram of Smix ratio 3:1
Table 10: Pseudo ternary phase diagram of Smix ratio 3:1
|
Blank formulation code |
Oil (mg) |
Smix (mg) (3:1) |
Water (mg) |
Total (mg) |
Oil% |
Smix% |
Water% |
Remarks |
|
CT3T1 (1:9) |
50 |
450 |
1338 |
1838 |
2.72 |
24.48 |
72.79 |
Translucent |
|
CT3T1 (2:8) |
100 |
400 |
1370 |
1870 |
5.34 |
21.39 |
73.26 |
Turbid |
|
CT3T1 (3:7) |
150 |
350 |
933 |
1433 |
10.46 |
24.42 |
65.10 |
Blue colour gel |
|
CT3T1 (4:6) |
200 |
300 |
598 |
1098 |
18.21 |
27.32 |
54.46 |
Milky white |
|
CT3T1 (5:5) |
250 |
250 |
402 |
902 |
27.71 |
27.716 |
44.56 |
Transparent |
|
CT3T1 (6:4) |
300 |
200 |
288 |
788 |
38.07 |
25.38 |
36.54 |
Phase separation |
|
CT3T1 (7:3) |
350 |
150 |
202 |
702 |
49.85 |
21.367 |
28.77 |
Phase separation |
|
CT3T1 (8:2) |
400 |
100 |
214 |
714 |
56.02 |
14.005 |
29.97 |
Phase separation |
|
CT3T1 (9:1) |
450 |
50 |
201 |
701 |
64.19 |
7.1326 |
28.67 |
Phase separation |
Fig11: Different ratios of oil and Smix (3:1)
Pseudo ternary phase diagram of Smix ratio 2:1
Table 11: Pseudo ternary phase diagram of Smix ratio 2:1
|
Blank formulation code |
Oil (mg) |
Smix (mg) (2:1) |
Water (mg) |
Total (mg) |
Oil% |
Smix% |
Water% |
Remarks |
|
CT2T1 (1:9) |
50 |
450 |
1394 |
1894 |
2.63 |
23.75 |
73.60 |
Translucent |
|
CT2T1 (2:8) |
100 |
400 |
1649 |
2149 |
4.65 |
18.61 |
76.73 |
Turbid |
|
CT2T1(3:7) |
150 |
350 |
1237 |
1737 |
8.63 |
20.14 |
71.21 |
Milky white |
|
CT2T1(4:6) |
200 |
300 |
807 |
1307 |
15.30 |
22.95 |
61.74 |
Turbid |
|
CT2T1 (5:5) |
250 |
250 |
319 |
819 |
30.52 |
30.52 |
38.94 |
Slight blue colour |
|
CT2T1 (6:4) |
300 |
200 |
306 |
806 |
37.22 |
24.81 |
37.96 |
Phase separation |
|
CT2T1 (7:3) |
350 |
150 |
200 |
700 |
50 |
21.42 |
28.57 |
Phase separation |
|
CT2T1(8:2) |
400 |
100 |
205 |
705 |
56.73 |
14.18 |
29.07 |
Phase separation |
|
CT2T1 (9:1) |
450 |
50 |
105 |
605 |
74.38 |
8.26 |
17.35 |
Phase separation |
Fig12: Different ratios of oil and Smix (2:1)
Pseudo ternary phase diagram of Smix ratio 1:3
Table 12: Pseudo ternary phase diagram of Smix ratio 1:3
|
Blank formulation code |
Oil (mg) |
Smix (mg) (2:1) |
Water (mg) |
Total (mg) |
Oil% |
Smix% |
Water% |
Remarks |
|
CT1T3 (1:9) |
50 |
450 |
1389 |
1889 |
2.64 |
23.82 |
73.53 |
Translucent |
|
CT1T3 (2:8) |
100 |
400 |
1788 |
2288 |
4.37 |
17.48 |
78.14 |
Turbid |
|
CT1T3(3:7) |
150 |
350 |
1344 |
1844 |
8.13 |
18.98 |
72.88 |
Turbid |
|
CT1T3(4:6) |
200 |
300 |
606 |
1106 |
18.08 |
27.12 |
54.79 |
Phase separation |
|
CT1T3 (5:5) |
250 |
250 |
542 |
1042 |
23.99 |
23.99 |
52.01 |
Phase separation |
|
CT1T3 (6:4) |
300 |
200 |
257 |
757 |
39.63 |
26.42 |
33.94 |
Phase separation |
|
CT1T3 (7:3) |
350 |
150 |
158 |
658 |
53.19 |
22.79 |
24.012 |
Phase separation |
|
CT1T3(8:2) |
400 |
100 |
104 |
604 |
66.22 |
16.55 |
17.21 |
Phase separation |
|
CT1T3 (9:1) |
450 |
50 |
158 |
658 |
68.38 |
7.59 |
24.01 |
Phase separation |
Pseudo ternary phase diagram of Smix ratio 1:1
Table 13: Pseudo ternary phase diagram of Smix ratio 1:1
|
Blank formulation code |
Oil (mg) |
Smix (mg) (2:1) |
Water (mg) |
Total (mg) |
Oil% |
Smix% |
Water% |
Remarks |
|
CT1T1 (1:9) |
50 |
450 |
510 |
1010 |
4.95 |
44.55 |
50.49 |
Translucent |
|
CT1T1 (2:8) |
100 |
400 |
729 |
1229 |
8.13 |
32.54 |
59.31 |
Translucent |
|
CT1T1(3:7) |
150 |
350 |
717 |
1217 |
12.32 |
28.75 |
58.91 |
Turbid |
|
CT1T1(4:6) |
200 |
300 |
306 |
806 |
24.81 |
37.22 |
37.96 |
Slight blue colour |
|
CT1T1(5:5) |
250 |
250 |
314 |
814 |
30.71 |
30.75 |
38.57 |
Phase separation |
|
CT1T1(6:4) |
300 |
200 |
203 |
703 |
42.67 |
28.44 |
28.87 |
Phase separation |
|
CT1T1(7:3) |
350 |
150 |
206 |
706 |
49.57 |
21.24 |
29.17 |
Phase separation |
|
CT1T1(8:2) |
400 |
100 |
101 |
601 |
66.55 |
16.63 |
16.80 |
Phase separation |
|
CT1T1(9:1) |
450 |
50 |
102 |
602 |
74.75 |
8.30 |
16.94 |
Phase separation |
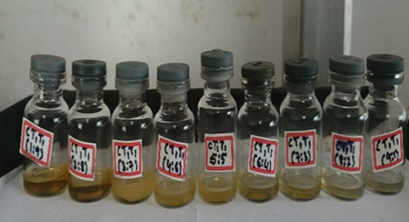
Fig14: Different ratios of oil and Smix (1:1)
EVALUATION OF NANOEMULSION
Table 14: Evaluation of optimized ezetimibe nanoemulsion formulations
|
Formulation |
Drug Content |
pH |
Viscosity |
Centrifugation |
Freeze Thaw cycle |
|
F1 |
68.5±0.30% |
5.6 ± 0.1 |
43.2 ± 2.1 |
Pass |
Pass |
|
F2 |
95.92±0.62% |
5.5 ± 0.1 |
39.5 ± 0.6 |
Pass |
Pass |
|
F3 |
89±0.42% |
5.7 ± 0.1 |
33.1 ± 1.6 |
Pass |
Pass |
|
F4 |
55.33±0.55% |
5.6 ± 0.1 |
35.4 ± 1.8 |
Fail |
Fail |
|
F5 |
88.21±0.22% |
5.5 ± 0.1 |
40.2 ± 2.0 |
Pass |
Pass |
|
F6 |
54.28±0.16% |
5.8 ± 0.1 |
30.6 ± 1.5 |
Fail |
Fail |
Table 15: Particle size, zeta potential and PDI of optimized aqueous titration solutions.
|
Code |
Particle size |
Zeta potential |
PDI |
|
CT4T1(3:7) |
186.88nm |
-13.2mV |
0.443 |
|
CT4T1(8:2) |
706.18nm |
-4.2mV |
0.253 |
|
CT3T1(3:7) |
89nm |
-24.2mV |
0.365 |
|
CT3T1(1:9) |
201.2nm |
-20.1mV |
0.433 |
|
CT1T3(1:9) |
159nm |
-14.9mV |
0.339 |
Table 16: Particle size, zeta potential and PDI of optimized ezetimibe nanoemulsions formulations
|
Formulation Code |
Particle size |
Zeta potential |
PDI |
|
F1 |
209.45nm |
-18.9mV |
0.345 |
|
F2 |
97nm |
-28.3mV |
0.421 |
|
F3 |
260.6nm |
-25.2mV |
0.525 |
|
F5 |
178nm |
-16.3mV |
0.258 |
Diffusion Studies
Table 17: % cumulative drug release of optimized formulation F2
|
Time(min) |
% CDR |
|
5 |
25.8 ± 3.65 |
|
10 |
34.84 ± 2.80 |
|
15 |
42.7 ± 4.34 |
|
30 |
56.03 ± 2.58 |
|
45 |
73.6 ± 3.43 |
|
60 |
96.5 ± 3.01 |
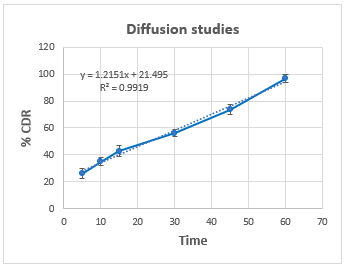
Fig 20: Graph depicting the %CDR graphs of optimized formulation F2(n=3)
Stability Studies
Stability studies for the F2 formulation were carried out at 40 °C and 75% relative humidity.
|
Duration |
Drug Content |
pH |
Viscosity |
Centrifugation |
Freeze Thaw cycle |
In vitro diffusion studies |
|
Initial |
95.92±0.62% |
5.5 ± 0.1 |
39.5 ± 0.6 |
Pass |
Pass |
96.5 ± 3.01 |
|
First month |
94.37±0.40% |
5.5 ± 0.1 |
39.5 ± 0.6 |
Pass |
Pass |
96.5 ± 3.01 |
|
Second month |
92.96±0.52% |
5.5 ± 0.1 |
39.8 ± 0.8 |
Pass |
Pass |
96.4 ± 2.65 |
|
Third month |
91.54±0.32% |
5.5 ± 0.1 |
39.8 ± 0.9 |
Pass |
Pass |
95.7 ± 2.04 |
CONCLUSION
Ezetimibe, an anti-hyperlipidemia which belongs to the BCS class II, is formulated as a nanoemulsion to enhance solubility and to control release of the drug in the body. The ezetimibe nanoemulsion is prepared by using capryol 90 as oil, tween 80 & transcutol HP as surfactant & co-surfactant, which are selected based upon the solubility studies conducted. The calibration curve was plotted by using acetonitrile, in which λmax was found to be 231nm, and the regression coefficient was 0.9941. The pseudoternary phase diagrams were designed to find out the composition of components to form the desired optimum nanoemulsion. By using pseudoternary phase diagrams, a total of 6 formulations were prepared, in which F2 was found to have a small particle size and was more stable than the other formulations. The drug-excipient compatibility studies were also directed for the optimized F2 formulation, which shows physical interactions without any chemical degradation, supporting the stability and compatibility of the nanoemulsion. All the nanoemulsion formulations were evaluated for particle size, PDI, zeta potential, pH, viscosity, centrifugation, freeze-thaw cycle, drug content & in vitro diffusion studies. From this study, I conclude that the ezetimibe nanoemulsion prepared using capryol 90, tween 80 & transcutol hp having Smix ratio of 3:1and oil to Smix ratio of 3:7 has shown particle size of 97nm & zeta potential of -28.3mV and it also shows the controlled release of drug which is optimum for the drug delivery as compared to the conventional dosage form.
REFERENCE

M. Swathi Ramani*, M. Sunitha Reddy, K. Anie Vijetha, Formulation And Evaluation of Ezetimibe Nanoemulsion, Int. J. of Pharm. Sci., 2025, Vol 3, Issue 9, 3577-3593 https://doi.org/10.5281/zenodo.17231103
 10.5281/zenodo.17231103
