1 Department of Pharmaceutical Chemistry, College of Dentistry and Pharmacy, Buraydah Private College, Buraydah. AlQuassim, Saudi Arabia
2 Department of Pharmaceutical Analysis, Sudan International University, Khartum, Sudan
3 Research Assistant, Faculty of Pharmacy, Elrazi University, Khartoum, Sudan
4 Department of Pharmacology, Faculty of Pharmacy, Elrazi University, Khartoum Sudan
5 Department of Pharmaceutics, College of Dentistry and Pharmacy, Buraydah Private College, Buraydah. AlQuassim, Saudi Arabia
6 Department of Pharmaceutics, College of Dentistry and Pharmacy, Buraydah Private College, Buraydah. AlQuassim, Saudi Arabia
7 Department of Pharmaceutics, Apex College of Pharmacy, Rampour, Uttar Pradesh
This study aimed to develop and evaluate improved oral tablets of Glibenclamide, a poorly soluble drug to enhance the drug solubility and dissolution, potentially increasing its bioavailability. Six different formulations were prepared with different ratios of carriers Polyethylene glycol and (PEG 6000 and PVP K-30) were combined with Glibenclamide using various dispersion and evaluated for flowability, compressibility, hardness, friability, disintegration, dissolution, and content. The resulting formulations were assessed for solubility, dissolution rate, compatibility, and crystallinity using various techniques Finally, the most promising formulation (SDF5) was tested in rats to determine its impact on Glibenclamide absorption. All formulations met the required standards, confirming their pharmaceutical equivalence. Compared to the original drug, the solid dispersions showed significantly improved solubility and dissolution. This was attributed to enhanced wettability, dispersability, and reduced crystallinity. Among the carriers, PVP K-30 performed better than PEG 6000 in improving solubility and dissolution. In rats, the SDF5 formulation led to a two-fold increase in Glibenclamide bioavailability compared to the marketed product.
Background and Clinical Need
Glibenclamide is a widely used sulfonylurea medication for the management of Type 2 Diabetes Mellitus [1, 2]. Despite its clinical utility, the drug's therapeutic effectiveness is frequently hampered by its poor aqueous solubility and low dissolution rate [3, 4].
This characteristic places Glibenclamide into Class II of the Biopharmaceutics Classification System (BCS) (high permeability, low solubility) [4, 5]. Consequently, it exhibits low and variable oral bioavailability [3, 6], which complicates accurate clinical dose control [6, 7]. To ensure reliable patient compliance and therapeutic outcomes, there is a critical pharmaceutical requirement to develop novel oral dosage forms that significantly enhance Glibenclamide's solubility and dissolution rate [3, 8]
2. LITERATURE REVIEW AND RATIONALE
The formulation of poorly water-soluble drugs for oral delivery is an ongoing challenge for scientists [9]. The oral bioavailability of a drug depends on its solubility and dissolution rate which is the rate limiting step for the onset of therapeutic activity. There are many techniques that are used to improve the solubility of poorly water-soluble drugs. Some examples of these techniques include particle size reduction (micronization and nanonization) [10] , modification of the crystal habit by manipulating the crystalline state of the drug, formulation of drug dispersion within different carriers by formation of eutectic mixtures, solid dispersions or solid solutions [11], complexation using complexing agents [12] and finally, solubilization using surfactants to form micro/nano emulsions and self-emulsified drug delivery systems [13, 14]. to increase wettability, reduce drug particle size, and often convert the drug from a crystalline state to a more soluble amorphous form. Polyethylene Glycol 6000(PEG 6000) and Polyvinylpyrrolidone K-30 (PVP K-30) are two of the most widely used hydrophilic carriers, each offering distinct advantages in stabilizing the resulting dispersion[15] .
3. OBJECTIVES
This study aimed too systematically:
4. MATERIALS AND METHODS
Glibenclamide standard, PVP, Polyethylene glycol (PEG) 6000 and Chloroform was obtained from different companies. Euglucon® tablets were purchased from Saudi Arabia. Microcrystalline cellulose (Avicel®), PH 101, sodium starch glycolate, lactose and some analytical grade solvents and chemicals, were obtained from Dr. Nabil Pharmaceutical Co. Ltd, Sudan. U.V. Visible spectrophotometer (Sp-3000 Nano Model) ]Erweka Tablet tester (Hardness, thickness, diameter) Germany Erweka Friability tester Germany. Dissolution apparatus Hanson research SR8 plus, California, United States. Analytical balance Mettler Toledo Ag 135, Mumbai, India Rotary evaporator Hahnsin scientific company, Kyoungki, South Korea. Oven, Biological shaker, Incubator Metrex scientific instruments, New Delhi, India Vacuum dryer Shivani scientific industries, Mumbai, India.Magnetic stirrer Nirmal International, New Delhi, India. Micropipettes Eppendorf, Chennai, India
Preparation of Solid dispersion Glibenclamide:
Different ratios of glibenclamide-PEG and glibenclamide-PVP (1:1 and 1:3 ratio) solid dispersion powders were manufactured using solvent evaporation method. tablets were formulated by direct compression of the powder using the hydraulic press and applying a pressure of about 40 MPa for 20 seconds. Another lot of Glibenclamide tablets were also prepared from the solid dispersion (1:1 and 1:3 ratio) and other excipients. Each 160 mg tablet contained 5 mg Glibenclamide (an amount of solid dispersion equivalent to 5mg of drug was taken), 5% sodium starch glycolate and a filler (consisting of 50% lactose and 50% Avicel PH 101). The components of each tablet were geometrically mixed using porcelain mortar and pestle for about 10 minutes. Tablets were manufactured by compression of powder mixture by applying a pressure of about 40 MPa for 20 seconds using hydraulic press. Tablets were sealed properly with aluminum foil. The dissolution rates of tablets made from different ratios of glibenclamide-PEG and glibenclamide-PVP solid dispersions were determined at 37°C at different stirring rates (50, 100, 150, and 200 rpm) using USP. (United Stated Pharmacopoeia) dissolution test apparatus 1 (Veego Scientific, DA-6D USP Standards, India). The dissolution medium was 500 ml distilled water. The disc in its mould was attached centrally on the surface of the upper part of the USP dissolution basket apparatus leaving a lower surface of 1.33 cm2 available for dissolution. At a pre-determined time intervals, 5 ml aliquots were withdrawn and immediately filtered through a 0.45 μm Millipore filter. The same volume of fresh medium was added to the test medium. The concentration of glibenclamide was determined spectrophotometrically at 300 nm. Three replicates were performed on each batch and the average values were taken. The same procedure was followed to measure the release of glibenclamide from Euglucon tablets and tablets made from solid dispersions and other excipients except here the USP dissolution test apparatus II was used at 100 rpm. Two tablets from each batch were placed in the dissolution medium. Drug quality assessment experiments were done using pharmacopeial procedures described in the USP/NF XXIV (2000), USP/NF 25(2007), and BP (2009).
Table 1: Composition of different solid dispersions formulations
|
Ratios |
Polymer |
Glibenclamide(mg) |
PVP(mg) |
PEG(mg) |
Total SD (mg) |
|
1:1 |
PVP K-30 |
5 |
5 |
0 |
10 |
|
1:1 |
PEG 6000 |
5 |
0 |
5 |
10 |
|
1:2 |
PVP K-30 |
5 |
10 |
0 |
15 |
|
1:2 |
PEG 6000 |
5 |
0 |
10 |
15 |
|
1:4 |
PVP K-30 |
5 |
20 |
0 |
25 |
|
1:4 |
PEG 6000 |
5 |
0 |
20 |
25 |
Physical Characterization of solid dispersion
Solubility Test: Solid dispersion of Glibenclamide equivalent to 10 mg of Glibenclamide was weighed and placed into Erlenmeyer flask that contained water. The samples were agitated using a mechanical agitator for 24 h and 48 h at room temperature. The saturated solutions were filtered through a 0.45 μm membrane filter, and the amount of the drug dissolved was analyzed spectrophotometrically at 300 nm .
Percent Yield: The percent yield of GLIB solid dispersions was determined using the following formula.
Percentage yield =
Weight of prepared solid dispersion *100
Weight of the drug +carrier
Fourier Transform Infrared Spectroscopy: The infrared spectroscopy of the pure GM and carriers (PVP, PEG 6000), F3, F6 was determined by subjecting the samples to Fourier-Transform Infrared Spectroscopy (FT-IR) using Shimadzu 435 U-O4 IR spectrometer (Tokyo, Japan). The infrared spectroscopy was conducted to ensure the compatibility between the formulation ingredients used in the preparation of GM solid dispersion. Each sample was mixed with potassium bromide and mechanically compressed into a disc. The infrared spectroscopy was measured for the disc of each sample over a wavelength scanning range of 4000 cm−1 to 400 cm−1.
The Differential Scanning Calorimetry (DSC) The thermal behavior of the pure GM powder, different carriers used (PEG 6000, PVP), and the best three formulations: F1, F4, and F6 were determined using a differential scanning calorimeter (Shimadzu, Japan). The selected formulation F1, F4, and F6were prepared using different carriers; PEG 6000, and PVP, respectively. These formulations were selected based on the highest drug: carrier ratio because it is expected that if there is any interaction between the drug and the carrier, it will be greater in case of a higher ratio. The measurements were done over a temperature range from 0–300 °C under nitrogen purge at 30 mL/min and a scanning rate of 10 °C/min . The reference material used in the analysis was pure Indium (In).
Drug quality Assessment
Drug quality assessment experiments were done using pharmacopeial procedures described in the USP/NF XXIV (2000), USP/NF 25(2007), and BP (2009).
Weigh variation test :
The weight variation test was performed according to the pharmacopeial procedures described in the USP/NF XXIV (2000), USP/NF 25(2007), and BP (2009). Twenty tablets were randomly selected from each batch (both the tablets made from pure solid dispersion powder and the final formulated tablets containing excipients). Each tablet was weighed individually using the analytical balance (Mettler Toledo Ag 135, Mumbai, India). The average weight of the twenty tablets was calculated. The percentage weight variation for each individual tablet was then determined and compared against the official pharmacopeial limits. The batch was considered acceptable if not more than two individual tablet weights deviated from the average weight by more than the specified percentage, and if no tablet deviated by more than twice the percentage limit.
Hardness Test
The hardness of each tablet was determined by selecting six tablets randomly using a hardness tester. Each tablet was placed between two anvils and force was applied to the anvils, and the crushing strength that causes the tablet to break was recorded. Crushing strength of average of six tablets was recorded.
Friability Test
Ten tablets from each brand were weighed using an analytical balance. Tablets were placed in the drum of the friability tester and subjected to rotation at 25 revolutions per minute (rpm) for four minutes (100 times). Then, tablets were deducted and weighed. The weights were compared with their initial weights and then percentage friability was calculated based on the weight difference obtained.
Disintegration Time
Disintegration time test is carried out according to USP/NF (2007) specification. Six tablets were placed in a disintegration tester filled with distilled water at 37±0.5°C. The tablets were considered as completely disintegrated when all the particles have passed through the wire mesh. This time was jotted down in minutes as disintegration time.
Diameter Test:
The diameter of ten tablets from each brand was measured using vernier caliper.
Preparation of Tablets
Table : formula of different Solid dispersion tablet (mg)
|
Composition |
F1 |
F2 |
F3 |
F4 |
F5 |
F6 |
|
Glibenclamide (SD) |
10 |
10 |
15 |
15 |
25 |
25 |
|
sodium starch glycolate |
8 |
8 |
8 |
8 |
8 |
8 |
|
Starch |
48 |
48 |
48 |
48 |
48 |
48 |
|
Magnesium stearate |
4 |
4 |
4 |
4 |
4 |
4 |
|
Lactose |
45 |
45 |
42.5 |
42.5 |
37.5 |
37.5 |
|
Avicel PH 101 |
45 |
45 |
42.5 |
42.5 |
37.5 |
37.5 |
|
Total |
160 |
160 |
160 |
160 |
160 |
160 |
F1 ratio (Glibenclamide to PVP) is 1:1, F3 ratio is 1:2, F5 ratio is 1:4 are containing 10 mg ,15mg ,25 mg of solid dispersion respectively.
F2 ratio (Glibenclamide to PEG) is 1:1, F4 ratio is 1:2, F6 ratio is 1:4 are containing 10 mg ,15mg ,25 mg of solid dispersion respectively.
Evaluation of Different Physical Parameters of Tablets
5. RESULTS
Characterization of the Prepared Solid Dispersion Glibenclamide
Solubility Study
Table 2: saturation solubility studies of SDS and pure GLB
|
Drug/ Formulation |
Solubility (mg/mL) (± SD); n=3 |
Solubility Enhancement Factor |
|
GLB Pure |
0.0025 ± 0.02 |
1.00 |
|
F1? |
0.345 ± 0.05 |
138.0 |
|
F2? |
0.083 ± 0.03 |
33.2 |
|
F3? |
0.531 ± 0.03 |
212.4 |
|
F4? |
0.132 ± 0.02 |
52.8 |
|
F5? |
0.643 ± 0.02 |
257.2 |
|
F6? |
0.199 ± 0.01 |
79.6 |
Mean ±SD, n=3. SD: Standard deviation
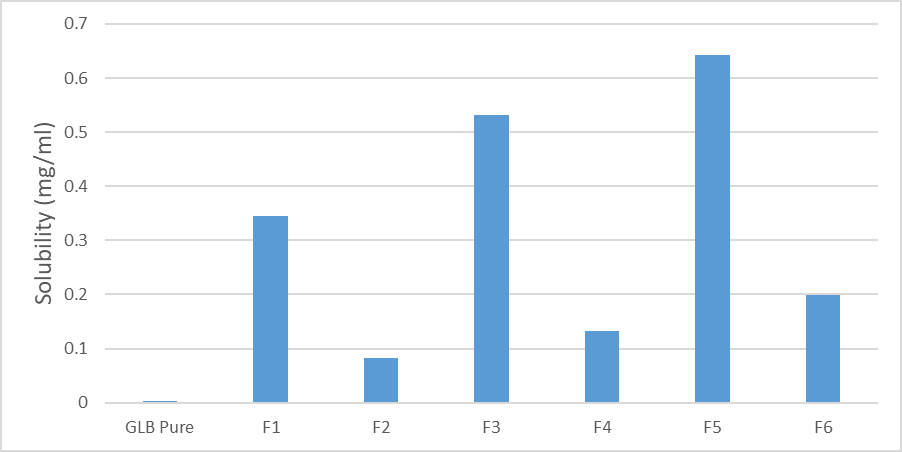
Figure1: saturation solubility studies of SDs and pure GLB
Table 3: Percentage Yield and Drug Content of Glibenclamide Solid Dispersion Formulations (F1? to F6?)
|
Formulation Code |
Yield (%) (± SD) |
Drug Content (%) (± SD) |
|
F1? |
86.12 ± 1.22 |
88.93 ± 1.87 |
|
F2? |
89.24 ± 0.94 |
90.24 ± 1.06 |
|
F3? |
94.51 ± 1.59 |
89.11 ± 1.54 |
|
F4? |
89.68 ± 1.02 |
92.13 ± 1.23 |
|
F5? |
96.78 ± 1.10 |
91.86 ± 1.73 |
|
F6? |
98.41 ± 0.87 |
92.89 ± 0.95 |
The Infrared Spectroscopy
IR spectra of Glibenclamide and its solid dispersions are identical
The principle IR absorption peaks of Glibenclamide solid dispersions were
observed and found to be identical with the spectra of Glibenclamide pure drug.
Thus from the spectra it was understood that there was no interaction between Glibenclamide and the carriers used in the preparation of solid dispersion.
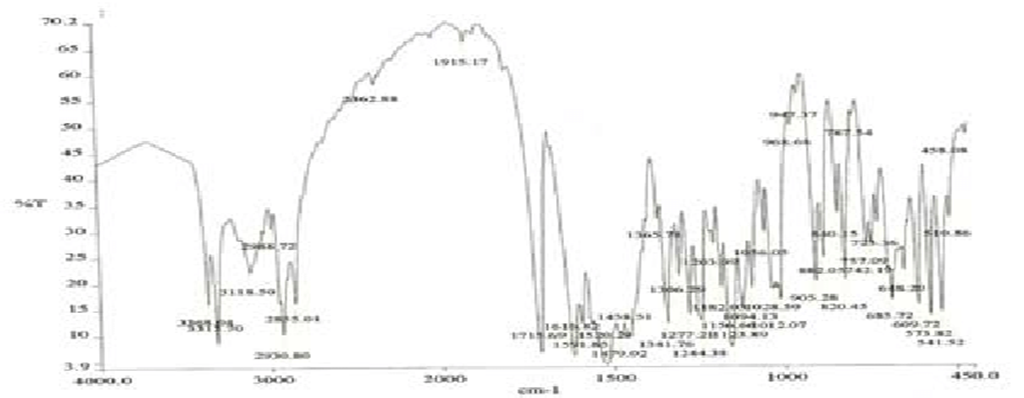
Figure 2: IR spectrum of pure Glibenclamide.
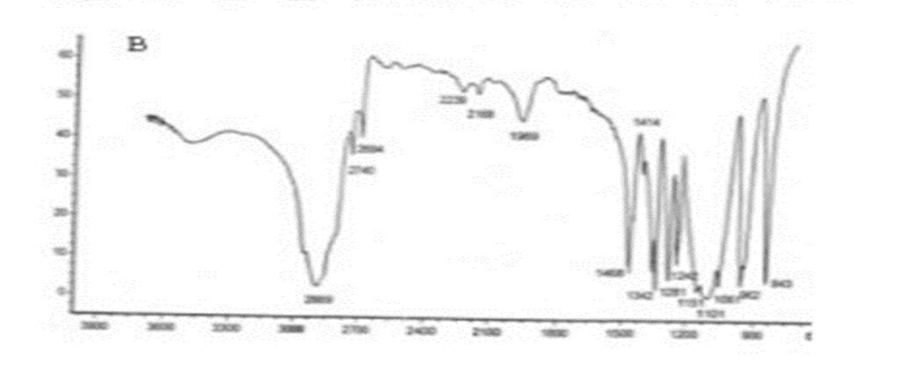
Figure 3: Spectrum of solid dispersion of Glibenclamide & PEG-6000.
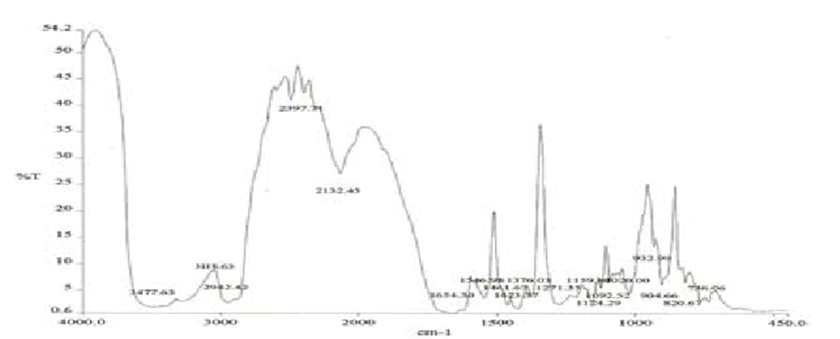
Figure 4: Spectrum of solid dispersion of Glibenclamide & PVP K30.
Differential Scanning Calorimetry (DSC)
DSC for pure drug (Glibenclamide), polyethylene glycol 6000 (PEG6000) & Poly Vinylpyrrolidone K-30 (PVP K-30)
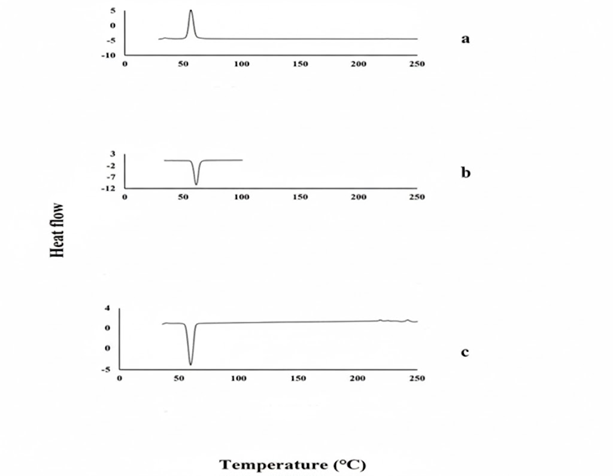
Figure 5: DSC (a) Pure drug (b) PEG6000 (c) PVP K-30
Table 4 Results of weight variation test (F1)
|
No. |
Tablet weight (w) (mg) |
Tablet weight-mean (w1-w 
|
(w1-w 
|
|
|
160.6 |
0.1245 |
0.0155 |
|
|
160.1 |
-0.3755 |
0.141 |
|
|
160 |
-0.4755 |
0.2261 |
|
|
160.2 |
-0.2755 |
0.0759 |
|
|
160.6 |
0.1245 |
0.0155 |
|
|
160.9 |
0.4245 |
0.1802 |
|
|
160.11 |
-0.3655 |
0.13359 |
|
|
160.4 |
-0.0755 |
0.0057 |
|
|
161 |
0.5245 |
0.2751 |
|
|
160.5 |
0.0245 |
0.0006 |
|
|
160.7 |
0.2245 |
0.0504 |
|
|
160.9 |
0.4245 |
0.1802 |
|
|
160.4 |
-0.0755 |
0.0057 |
|
|
160.2 |
-0.2755 |
0.075 |
|
|
160.4 |
-0.0755 |
0.0057 |
|
|
160.5 |
0.0245 |
0.0006 |
|
|
160.1 |
-0.3755 |
0.141 |
|
|
160.1 |
-0.3755 |
0.141 |
|
|
160.8 |
0.3245 |
0.1053 |
|
|
161 |
0.5245 |
0.2751 |
|
|
Average = 160.4755± 0.328481 |
|
∑(w1-w)2 
|
RSD = SD/Mean*100 = 0.328481/160.4755*100= 0.0023
The value was in the acceptable range (less than 5%)
Table 5: Results of thickness test (mm)
|
|
F1 |
F2 |
F3 |
F4 |
F5 |
F6 |
|
|
2.64 |
2.66 |
2.70 |
2.60 |
2.50 |
2.80 |
|
|
2.62 |
2.64 |
2.68 |
2.60 |
2.40 |
2.60 |
|
|
2.66 |
2.68 |
2.72 |
2.60 |
2.40 |
2.70 |
|
|
2.68 |
2.70 |
2.74 |
2.70 |
2.50 |
2.70 |
|
|
2.65 |
2.67 |
2.71 |
2.50 |
2.80 |
2.60 |
|
|
2.65 |
2.67 |
2.71 |
2.50 |
2.40 |
2.80 |
|
|
2.65 |
2.67 |
2.71 |
2.60 |
2.50 |
2.60 |
|
|
2.67 |
2.69 |
2.73 |
2.60 |
2.40 |
2.70 |
|
|
2.63 |
2.65 |
2.69 |
2.50 |
2.40 |
2.80 |
|
|
2.64 |
2.66 |
2.70 |
2.60 |
2.50 |
2.60 |
|
Average |
2.65 |
2.67 |
2.71 |
2.58 |
2.48 |
2.69 |
Table 6: Results of diameter test (mm)
|
|
F1 |
F2 |
F3 |
F4 |
F5 |
F6 |
|
|
6.18 |
6.22 |
6.32 |
6.4 |
6.37 |
6.38 |
|
|
6.2 |
6.24 |
6.34 |
6.4 |
6.38 |
6.36 |
|
|
6.19 |
6.23 |
6.33 |
6.4 |
6.39 |
6.36 |
|
|
6.33 |
6.03 |
6.13 |
6.45 |
6.39 |
6.37 |
|
|
6.22 |
5.92 |
6.02 |
6.48 |
6.39 |
6.36 |
|
|
6.3 |
6.34 |
6.44 |
6.48 |
6.39 |
6.37 |
|
|
6.4 |
6.45 |
6.55 |
6.46 |
6.36 |
6.37 |
|
|
6.2 |
5.82 |
5.92 |
6.46 |
6.37 |
6.36 |
|
|
6.2 |
6.13 |
6.23 |
6.43 |
6.38 |
6.36 |
|
|
6.1 |
6.13 |
6.23 |
6.48 |
6.36 |
6.38 |
|
Average |
6.23 |
6.15 |
6.25 |
6.44 |
6.38 |
6.37 |
Table 7: Results of hardness test (kg/cm2)
|
|
F1 |
F2 |
F3 |
F4 |
F5 |
F6 |
|
|
7.80 |
7.50 |
6.80 |
6.67 |
5.23 |
6.81 |
|
|
7.50 |
8.30 |
6.60 |
6.61 |
5.10 |
6.62 |
|
|
7.50 |
8.70 |
6.80 |
6.63 |
5.11 |
6.71 |
|
|
7.20 |
7.70 |
6.50 |
6.72 |
5.22 |
6.70 |
|
|
7.20 |
7.40 |
6.20 |
6.51 |
5.55 |
6.60 |
|
|
7.70 |
7.90 |
6.30 |
6.51 |
5.16 |
6.82 |
|
|
8.00 |
7.30 |
6.90 |
6.63 |
5.29 |
6.61 |
|
|
8.00 |
7.60 |
6.40 |
6.68 |
5.17 |
6.73 |
|
|
7.90 |
8.20 |
6.60 |
6.58 |
5.18 |
6.81 |
|
|
8.10 |
7.20 |
7.10 |
6.60 |
5.20 |
6.60 |
|
Average |
7.69 |
7.78 |
6.62 |
6.61 |
5.22 |
6.70 |
Table 8: Results of friability test
|
Formulas |
Weight before (mg) |
Weight after (mg) |
% of weight loss |
|
F1 |
160.4755 |
159.45 |
0.64 |
|
F2 |
161.0765 |
160 |
0.67 |
|
F3 |
160.937 |
159.94 |
0.62 |
|
F4 |
161 |
159.9 |
0.68 |
|
F5 |
161.3 |
160.3 |
0.62 |
|
F6 |
161.386 |
160.39 |
0.62 |
%Friability =
tablet weight before friability test-tablet weight after friability testtable weight before fribaility test×10

Friability of the three brands was well within the tolerable range of (less than 1%) (USP, 2014).
Table 9: Disintegration time.
|
SDs |
Min |
|
F1 |
2:83 |
|
F2 |
3.23 |
|
F3 |
2.77 |
|
F4 |
3.16 |
|
F5 |
2.56 |
|
F6 |
2.54 |
3.9 In-vitro Dissolution Studies
Table 10: Results of %Drug release profile for different formulations of tablets
|
Time (min) |
Pure GLB |
F1 |
F2 |
F3 |
F4 |
F5 |
F6 |
|
0 |
0.00 |
0.00 |
0.00 |
0.00 |
0.00 |
0.00 |
0.00 |
|
15 |
9.53 |
29.39 |
38.7 |
40.50 |
44.64 |
51.86 |
65.73 |
|
30 |
15.57 |
38.67 |
42.82 |
46.78 |
55.66 |
65.56 |
78.06 |
|
60 |
20.49 |
42.88 |
52.67 |
64.5 |
65.80 |
73.67 |
91.03 |
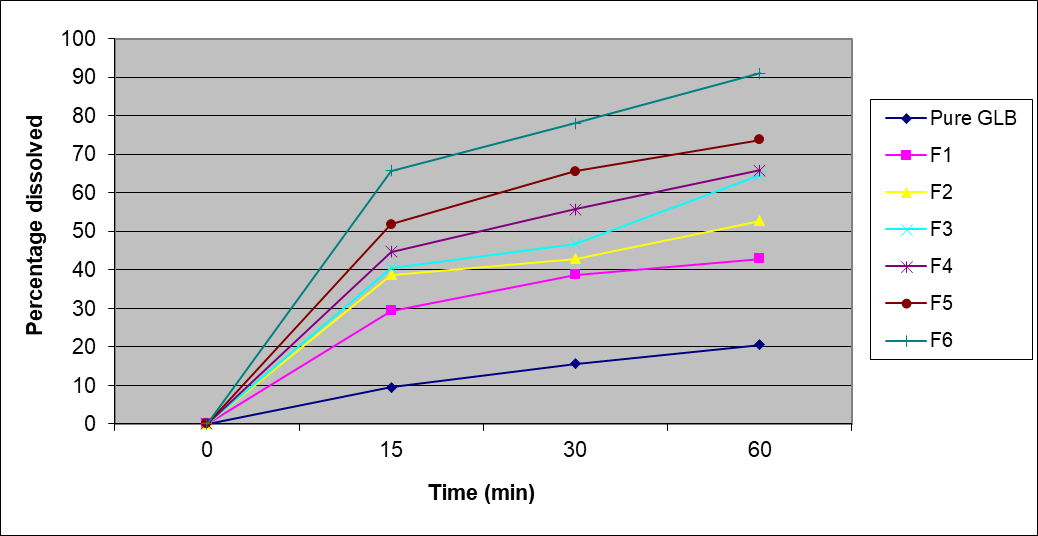
Figure 6: %Drug release profile for different formulations
Results of dissolution profile comparison, similarity factor (F2):
f2 = 50 * log {[1+(1/n ? (Rt – Tt)2]-0.5 *100}
Table 3.22: Similarity factor between Pure glibenclamide and F1
|
Rt |
Tt |
R – T |
(R – T)2 |
((1+1/3) (R – T)2)-0.5×100 |
|
9.53 |
29.39 |
-19.86 |
394.4196 |
|
|
15.57 |
38.67 |
-23.1 |
533.61 |
|
|
20.49 |
42.88 |
-22.39 |
501.3121 |
|
|
|
|
|
Sum 1429.3417 |
4.57654 |
f2 = 50 * log 4.57654= 50* 0.66054 = 33.0269
f2 = 33.03
The similarity factor between pure glibenclamide and f1 equals 33.03 which indicates dissimilarity.
Table 11: Similarity factor between Pure glibenclamide and F2
|
Rt |
Tt |
R – T |
(R – T)2 |
((1+1/3) (R – T)2)-0.5×100 |
|
9.53 |
38.7 |
-29.17 |
850.8889 |
|
|
15.57 |
42.82 |
-27.25 |
742.5625 |
|
|
20.49 |
52.67 |
-32.18 |
1035.552 |
|
|
Sum 2629.004 |
3.37612 |
f2 = 50 * log 3.37612
= 50* 0.52842
= 26.4209
f2 = 26.42
The similarity factor between pure glibenclamide and F2 equals 26.42 which indicates dissimilarity
Table 12: Similarity factor between Pure glibenclamide and F3.
|
Rt |
Tt |
R – T |
(R – T)2 |
((1+1/3) (R – T)2)-0.5×100 |
|
9.53 |
40.5 |
-30.97 |
959.1409 |
|
|
15.57 |
46.78 |
-31.21 |
974.0641 |
|
|
20.49 |
64.5 |
-44.01 |
1936.88 |
|
|
Sum 3870.085 |
2.78312 |
f2 = 50 * log 2.78312
= 50* 0.44453
= 22.2266
f2 = 22.23
The similarity factor between pure glibenclamide and F3 equals 22.23 which indicates dissimilarity.
Table 13: Similarity factor between Pure glibenclamide and F4
|
Rt |
Tt |
R – T |
(R – T)2 |
((1+1/3) (R – T)2)-0.5×100 |
|
9.53 |
44.64 |
-35.11 |
1232.712 |
|
|
15.57 |
55.66 |
-40.09 |
1607.208 |
|
|
20.49 |
65.8 |
-45.31 |
2052.996 |
|
|
Sum 4892.916 |
2.47539 |
f2 = 50 * log 2.47539
= 50* 0.39364
= 19.6822
f2 = 19.86
The similarity factor between pure glibenclamide and F4 equals 19.86 which indicates dissimilarity
Table 14 : Similarity factor between Pure glibenclamide and F5
|
Rt |
Tt |
R – T |
(R – T)2 |
((1+1/3) (R – T)2)-0.5×100 |
|
9.53 |
51.86 |
-42.33 |
1791.829 |
|
|
15.57 |
65.56 |
-49.99 |
2499 |
|
|
20.49 |
73.67 |
-53.18 |
2828.112 |
|
|
Sum 7118.941 |
2.0524 |
f2 = 50 * log 2.47539
= 50* 0.31226
= 15.6131
f2 = 15.61
The similarity factor between pure glibenclamide and F5 equals 15.61 which indicates dissimilarity
Table 15: Similarity factor between Pure glibenclamide and F6
|
Rt |
Tt |
R – T |
(R – T)2 |
((1+1/3) (R – T)2)-0.5×100 |
|
9.53 |
65.73 |
-56.2 |
3158.44 |
|
|
15.57 |
78.06 |
-62.49 |
3905 |
|
|
20.49 |
91.03 |
-70.54 |
4975.892 |
|
|
Sum 12039.33 |
1.57836 |
f2 = 50 * log 1.57836
= 50* 0.19821
= 9.91027
f2 = 9.91027
The similarity factor between pure glibenclamide and F6 equals 9.91 which indicates dissimilarity
6. DISCUSSION
The current study aimed to develop and characterize an oral tablet formulation of glibenclamide that could improve its dissolution and solubility as well as its oral bioavailability using different methods.
Three different formulations of solid dispersion glibenclamide PVP 6000 and PEG K-30 were prepared in different ratios (1:1, 1:2, 1:4) by solvent evaporation method to improve its solubility and oral bioavailability. Then, the in vivo and in vitro bioavailability of prepared tablet has been conducted.
In solubility study of glibenclamide solid dispersion Saturation Solubility Studies of the formulated tablets ( F1,F2,F3,F4,F5,F6) and pure GLB. The result showed that all solid dispersion formulas increase the solubility of glibenclamide compared with pure glibenclamide. The highest increase in solubility was in Formula 5 (GLB: PVP (1:4) with a saturated solubility of0.643±0.02 mg/ml compared to the solubility of pure glibenclamide of 0.0025±0.02 mg/ml as shown clearly in table 3.7 and figure 3.3. The increase in solubility of this solid dispersion can be caused by the molecular dispersion of the drug in the hydrophilic polymer so that the wettability of the drug will increase. The presence of PEG and PVP can form the intermolecular hydrogen bonding with glibenclamide.
A similar study has been conducted by Abera et al. (2016) the study was conducted to improve the solubility and dissolution properties of glibenclamide using solid dispersion technique. The carriers used were polyethylene glycol (PEG) 6000 and polyvinyl pyrrolidone (PVP) K-30 with or without sodium lauryl sulphate (SLS) in different weight ratios and prepared by solvent evaporation, melting and physical mixing techniques. PVP K-30 was used only for solvent evaporation method. The study showed that solid dispersion prepared with PVP K-30 showed better improvement in solubility and dissolution rate of glibenclamide than PEG 6000. Glibenclamide with PEG 6000 solid dispersions by melting method showed highest dissolution relative to the solvent evaporation.
As shown in table3.8, the percentage yield of all the formulations represented in Table was in the range of 86-99% and formulation F6 showed highest percentage yield of 98.41%. Formulations F3, F5 and F6 showed greater than 90% of the yield but other formulations like F1, F2 and F4 showed less than 90% of the yield.
A relevant test conducted by (Immanuel et al, 2022, PP. 130-142) who formulated and evaluated glibenclamide by solid dispersion method using Compritol 888 ATO as a Carrier: This study reports a percentage yield of 12% for the solid dispersion prepared using Compritol 888 ATO.
Another study conducted by(Singh et al , 2018 pp. 81-86) who also formulated and evaluated glibenclamide tablet using solid dispersion with various polymers. The study found a percentage yield of 96.18% ± 0.34% for the solid dispersion containing PEG 6000.
Sehgal et al , 2018, pp. 158-161) evaluated solid dispersion containing glibenclamide. The study reported that the percentage yield ranged from 88.19% ± 1.43% to 98.41% ± 0.87%, depending on the carrier used.
It is important to note that the percentage yield can vary depending on several factors, such as the specific carrier used, the drug-to-carrier ratio, and the preparation method. These studies provide a range of possible yields, but the actual yield achieved in a specific experiment may differ.
FTIR spectra of glibenclamide and its solid dispersions are identical. The principle IR absorption peaks of glibenclamide solid dispersions were observed and found to be identical with the spectra of glibenclamide pure drug. Thus, from the spectra it was understood that there was no interaction between glibenclamide and the carriers used in the preparation of solid dispersion as shown in figures 3.4, 3.5 and 3.6 respectively.
A similar study conducted by (Rahman. M et al, 2022, pp. 53-66)) Formulation and Physicochemical Characterization of Glibenclamide Solid Dispersion Using Various Carriers. The study reported that the IR spectra of the physical mixture of glibenclamide and the carrier (HPMC) showed peaks of both components, while the solid dispersion displayed only the characteristic peaks of the carrier, suggesting the conversion of glibenclamide into an amorphous state.
The aforementioned study also highlights the potential of IR spectroscopy to assess compatibility between the drug and the carrier in solid dispersions. The presence of new peaks or significant shifts in existing peaks in the solid dispersion compared to the pure drug and the physical mixture might indicate interactions. Additionally, the disappearance of characteristic peaks of the drug in the solid dispersion spectrum suggests its conversion to an amorphous state, which can improve its dissolution and bioavailability.
It was found that the DSC thermogram of GM showed a single endothermic peak at 212.44 ?C. The DSC thermograms of PEG 6000 showed endothermic peaks at 61.96 ?C respectively (Figure 3.7).
In the thermogram of DSC, the endothermic peak of pure glibenclamide was on 176.6 °C, indicating its crystalline nature. The thermal behavior of the PVP are amorphous substances, with a large endothermal effect in the 60-100 °C range due to polymer dehydration (Figure 3.8).
All the tablet formulations were subjected to various evaluation parameters and the results obtained were within the acceptable range as per (USP, 2014). The weight variation test shows that all tablets were uniform. The thickness values ranged from 2.48 to 2.71 mm, as shown clearly in Table 3.16. The hardness of all tablets ranged from 5.22 to 7.78 kg/cm2 (Table 3.18). The loss of total weight in the friability test, as shown in Table 3.19, was in the range of 0.67-0.62%, which is acceptable according to (USP, 2014). The uniformity of diameter, and disintegration were also met (Tables 3.17 and Table 3.20).
The dissolution curve of the prepared tablets showed a remarkable improvement in drug release which is positively associated with the ratio of PVP K-30, PEG 6000. The percentage released after 60 minutes was the the lowest glibenclamide (15.57%) followed by F1, F2, F3, F4, F5, and F6, respectively (Table 3.21 and Figure 3.9). The significance of the similarity or difference of the dissolution profiles at pH 2.0 was assessed using the similarity factor (f2).
The results indicate that the prepared formulations have a different dissolution profile than the pure glibenclamide, suggesting that it is not similar, and this difference indicates a significant improvement on the efficacy of the drug.
The results showed that polymer ratio significantly influenced GLB dissolution rate, as higher amounts of PVP carrier resulted in the improved dissolution of the drug, i.e., 1:4 GLB: PVP ratio showed the highest dissolution than rest of the SDs of glibenclamide and pure glibenclamide. However, the compression pressure used in the manufacture of tablets may alter the crystalline state of the dispersed glibenclamide quantification of the pharmacological effect is one way to assessing the bioavailability of a drug. This method is based on the assumption that a certain intensity of response is associated with a certain drug concentration at the site of action after oral administration of glibenclamide in rats.
7. CONCLUSION
Solid dispersion systems have proven to be an extremely useful tool in improving the dissolution properties of poorly water-soluble drugs. In recent years, much knowledge has been accumulated on solid dispersion technology, but its commercial application is limited. Recently, Various methods have been tried to overcome the limitation and make the preparation practically feasible. The problems associated with the incorporation into formulation of dosage forms have been gradually resolved with the advent of alternative strategies.
The results and the statistical parameters show that the proposed UV spectrophotometric method is simple, fast, specific, accurate and precise. Therefore, this method can be used for the determination of glibenclamide in bulk without interference with commonly used excipients and related substances.
In this study assessed the quality and physicochemical bioequivalence of six formulations of glibenclamide were investigated using in vitro and in vivo methods. The study confirmed that the formulations of glibenclamide tablets met the official specifications for hardness, friability, thickness, diameter and disintegration. The similarity test and solubility study proved that the formulations improved release and solubility compared to pure glibenclamide. Based on the in vivo results and in vitro dissolution studies, glibenclamide formulations (PVP1:4) can be replaced by the reference product in clinical practice.
ACKNOWLEDGMENT
Acknowledge funding sources, institutions, or individuals who contributed to the work.
REFERENCE


Sumia Farid, Nusaiba Albasheer, Omer Sinada, Mohammed Yousif Ibrahim, Neha Jaiswal, Sundos Suleman Ismail Abdullah, Swarnima Pandy, Formulation, In Vitro Evaluation of Solid dispersion Tablets Glibenclamide, Int. J. of Pharm. Sci., 2025, Vol 3, Issue 11, 4816-4830. https://doi.org/10.5281/zenodo.17761546
 10.5281/zenodo.17761546
