
We use cookies to ensure our website works properly and to personalise your experience. Cookies policy
Department of pharmaceutical Chemistry, Rani Chennamma College of Pharmacy, Rajiv Ghandi University of Health Sciences, Belagavi, 590010, Karnataka, India.
The objective of present work is to Purify and characterize by UV and FTIR Spectroscopic method for estimation of 2- methoxy naphthalene in marketed formulation. UV- Spectrophotometric method was developed using Alcohol (99%) as solvent. The developed method was standardized in terms of validation parameters such as simple, sensitive, linear as perICHQ2 (R1).Guidelines for estimation of 2-methoxy naphthalene in marketed Formulation this newly developed method was successfully applied for FTIR Spectrophotometric method was developed using KBr (potassium bromide) process to get insights concerning the presence of different functional groups like Alcohol, methoxy may other groups present in 2- methoxy naphthalene.
2-methoxy naphthalene is an organic compound belongs to naphthalene family. It is aromatic homopolycyclic compounds consist of two benzene rings that are fused together and at an ortho position methoxy group is present. It’s function as inhibitors of specific enzymes, such as cytochrome P-450 and xanthine oxide .It is used as intermediate for synthesis of non- steroidal anti-inflammatory drugs. This chemical finds broad application in cosmetic, incence stick (agarbatti) and soap industry for adding soothing fragrance. Compounds having 2- methoxy naphthalene as their parent nucleus were synthesized and evaluated for anti- inflammatory effect according to the carrageenan paw edema methods in rats. The synthetic routes for the preparation of isomeric 1, 2 and 2, 6 disubstituted derivatives are described. Replacement of the alpha-methyl acetic moiety in naproxen by 4-hydroxy butyric acid side chain did not cause loss of activity. Aromatic ketones are important intermediates of in the synthesis are of fragrances and pharmaceuticals. Indeed, many synthetic fragrances of the most type contain an acetyl group while the synthesis of various pharmaceuticals such as paracetamol, Ibuprofen, Naproxen, etc. [1][2][3][4]

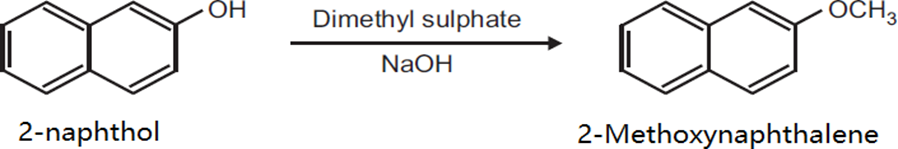
Preparation Of 2-Methoxy Naphthalene from 2-Naphthol
Principle: Phenol can be methylated to give methyl ethers methylation can be done ether by using diazomethane or dimethylsulphate in alkaline medium reaction
Procedure: Take 0.5gm 2-naphthol and 0.2 NaoH in 5ml distill water in beaker (25ml) heat on wire gauze to obtain a clear solution. Cool the solution (10 to 15?C) then add 0.35ml dimethylsulphate drop wise. After the addition is over, warm the mixture for 1hour at 70-80?C and then cool filter the product and wash it with 10% sodium hydroxide solution and then with water dry the product record the practical yield and recrystallize it.
Introductiontouv-Spectroscopy: -
Basic Principles Of Spectroscopy: -
Spectroscopy deals with the production, measurement, and interpretation of spectra arising from the interaction of electromagnetic radiation with matter. There are many different spectroscopic methods available for solving a wide range of analytical problems. The methods differ with respect to the species to be analyzed (e.g., molecular or atomic spectroscopy), the type of radiation-matter inter action to be monitored (e.g., absorption, emission, or diffraction), and the region of the electromagnetic spectrum used in the analysis. Spectroscopic methods are very informative and widely used for both quantitative and qualitative analysis. Spectroscopic methods based on the absorption or emission of radiation in the ultraviolet (UV), visible (Vis), Infrared (IR), and radio (nuclear magnetic resonance, NMR) frequency ranges are most commonly encountered in traditional food analysis in laboratories. Each of these methods is distinct in that it monitors different types of molecular or atomic transitions. This chapter explains the basic of these transitions to provide the necessary background or separate chapters on each type of spectroscopy.
Spectroscopy Method
It is the branch of science dealing with the study of interaction between electromagnetic radiation and matter. It most powerful tool available for the study of atomic and molecular structures and is used in the analysis of wide range of samples. Optical Spectroscopy includes the region on electromagnetic spectrum between 100 Å and 400μm. The regions of electromagnetic spectrum.

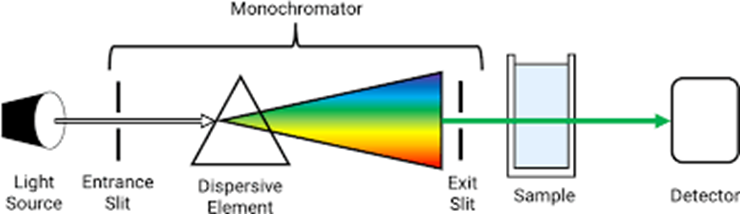
Schematic UV Instrumentation
Ultraviolet-visible spectrophotometer
UV-Visible Spectrophotometry is one of the most frequently employed technique in pharmaceutical analysis. It involves measuring the amount of ultraviolet or visible radiation absorbed by a substance in solution. Instrument which measures the ratio, or function the ratio, of the intensity of two beams of light in the UV-Visible region are called Ultraviolet-Visible spectrophotometer. In qualitative analysis, organic compounds can be identified by use of spectrophotometer, if any recorded data is available, and quantitative Spectrophotometric analysis is used to ascertain the quantity of molecular species absorbing the radiation. Spectrophotometric technique is simple, rapid, moderately specific and applicable to small quantities of compounds. The fundamental law that governs the quantitative Spectrophotometric analysis is the Beer-Lambert’s law.
Beer’s Law: It states that the intensity of a beam of parallel monochromatic radiation decreases exponentially with the number of absorbing molecules. In other words, absorbance is proportional to the concentration.
Lambert’s Law: It states that the intensity of a beam of parallel monochromatic radiation decreases exponentially as it passes through a medium of homogeneous thickness. Combination of these two laws yields the beer-Lambert’s law.
Beer-Lambert’s Law: When beam of light is passed through a transparent cell containing a solution of an absorbing substance, reduction of the intensity of light may occur.
Mathematically, Beer-Lambert law is expressed as A=a b c
Where, A=absorbance or optical density
a=absorptivity or extinction coefficient
b=path length of radiation through sample (cm) c=concentration of solute in solution.
Both b and a are constant so a is directly proportional to the concentration c, When c is in gm/100ml, then the constant is called A (1%, 1cm)
A=A1%/1cm’bc
Quantification of medicinal substance using spectrophotometer may carried out by preparing solution in transparent solvent and measuring it’s absorbance at suitable wavelength. The wave length normally selected is wavelength of maximum absorption (λmax), where small error in setting the wavelength scale has little effect on measured absorbance. Ideally, concentration should be adjusted to give an absorbance of approximately 0.9, around which the accuracy and precision of the measurement are optimal. The assay of single component sample, which contains other absorbing substances, is then calculated from the measured absorbance by using one of three principle procedures.
Schematic Instrumentation of UV Spectrophotometer
ICH Guidelines (ICHQ2R1) for analytical procedure and validation: -
The analytical procedure refers to the way of performing the analysis. It should describe in detail the steps necessary to perform each analytical test. This may include but is not limited to: the sample, the reference standard and the reagents preparation, use of the apparatus, generation of calibration curve, use of the formula for the calculation, etc.
Types of Analytical Procedures to be validated
The discussion of the Validation of analytical procedures is directed to the four most common types of analytical procedures:
The objective of the analytical procedure should be clearly understood since this will govern the validation characteristics which need to be evaluated. Typical validation characteristics which should be considered are listed below:
Furthermore, revalidation may be necessary in the following circumstances
- Changes in the synthesis of the drug substances;
- Changes in the composition of the finished product;
- Changes in the analytical procedure
Solubility Estimation-
For the Nerolin it is necessary to know the solubility of the drug. So that solvents election done by performing solubility test of Nerolin in difference solvents. It was confirmed that the drug is i.e. Nerolin is freely soluble in alcohol and benzene. Weigh accurately 1gm of 2- methoxynaphthaleneanddissolveina100mlofdifferent solventswhichistakenina100mlof Volumetric flask.[3]
Melting Point
Melting point is the temperature at which a given solid material changes from a solid state to liquid state or melts. The melting point is useful for indication to check the identity and purity of the substance.
Melting Point by Capillary Method: The 2-methoxynaphthalene is filled in the capillary tubes. The capillary tube and thermometer is dipped in liquid paraffin containing Thiel’s tube. Heat supplies continuously to Thiel’s tube until the product melt. Note down the temperature range. [5]
Identification Test’s
|
Test |
Observation |
Inference |
|
Test for Nitrogen |
No blue colour |
Nitrogen is absent |
|
Test for Sulfur |
No black precipitate |
Sulfur is absent |
|
Test for Halogen |
No thick white precipitate |
Halogen is absent |
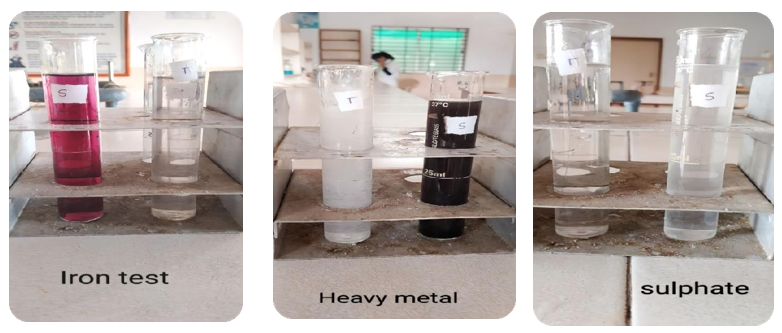
Test for purity
For checking purity of caffeine limit tests were performed
Selection of suitable solvent.
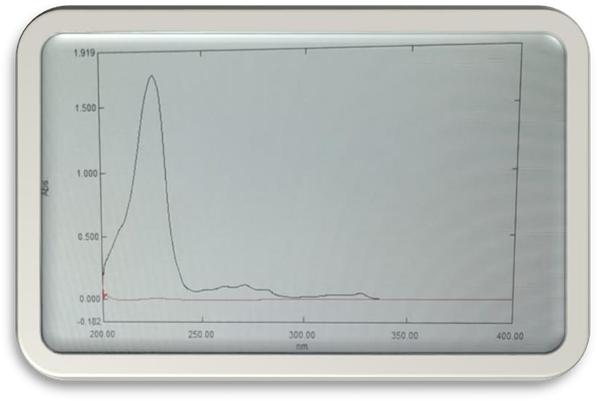
Determination Of Maximum Wavelength:
Standard Preparation:
Method Validation:
The method was validated according to ICH guidelines; (Q2R1) method validation was done by using following parameter.
LOD: Limit of detection is concentration at which analyte in the test sample was detected.
LOD=3.3 x standard deviation of regression (σ)
Slope LOD=3.3x0.0533 0.0333 LOD=5.28
4. LOQ: Limit of quantification is the concentration at which analyte in the test sample is quantified.
LOQ=10xstandard deviation of regression(σ) Slope LOQ=10x0.0533 0.0333 LOQ=16.006
FTIR: Fourier Transform Infrared spectrophotometer
Infrared spectrum is an important record which gives sufficient information about the functional groups of a compound. The region from 0.8µto2.5µis called Near IR, from2.5µ to 15µ is called Mid IR or Ordinary IR and that from15µ to 200µ is called far IR. FTIR stands for Fourier Transform Infrared spectrophotometer the preferred method of infrared spectroscopy. IR radiation passed through a sample, some of the infrared radiation is absorbed by this sample and some of it is passed through and the resulting spectrum represents the molecular absorption and transmission, creating a molecular finger print of the sample.[11][13]
Process:
3. Results
A. Solubility Test
|
Sr.no |
Drug +Solvent |
Result |
|
1. |
Nerolin+Alcohol |
Soluble |
|
2. |
Nerolin+Water |
Insoluble |
|
3. |
Nerolin+Benzene |
Soluble |
|
4. |
Nerolin+Acetone |
Insoluble |
|
5. |
Nerolin+Methanol |
Partially Soluble |
b. Melting Point
|
Sr. No |
Melting Point Ranges |
Mean |
|
1. |
70°C |
72°C |
|
2. |
74°C |
|
|
3. |
72°C |
Test for purity Limit test
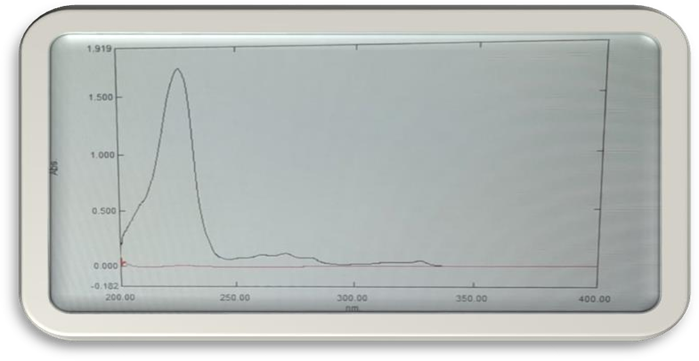
d. λmax2-methoxynaphthalene
Linearity:
|
SR.NO |
Concentration(µg/ml) |
Absorbance |
|
1 |
2 |
0.061 |
|
2 |
4 |
0.098 |
|
3 |
6 |
0.131 |
|
4 |
8 |
0.163 |
|
5 |
10 |
0.195 |
|
6 |
Slope |
0.0333 |
|
7 |
LOD |
2.943 |
|
8 |
LOQ |
8.918 |
|
9 |
R2 |
0.999 |
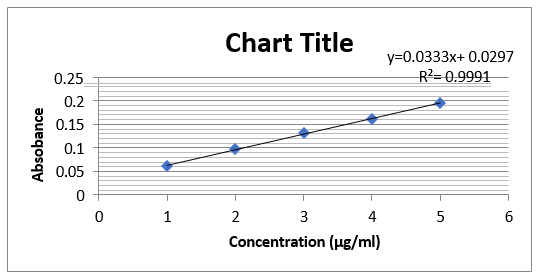
Report: The results of UV spectroscopic method were within the acceptance limit. The calibration curve of the drug gives correlation coefficient value 0.9991.
|
Sr.no |
Fictional Group |
Stretching Frequency (Cm-1) |
|
|
Standard |
Sample |
||
|
1. |
C-H(Alkane) |
2850-3000 |
2961.82-2940.61 |
|
2. |
C-O |
1000-1050 |
1032.93 |
|
3. |
C=C |
1600-1680 |
1656.92 |
|
4. |
O-CH3 |
2800-2860 |
2837.41 |
DISCUSSION
2-Methoxy naphthalene is an organic compound used in various applications, including pharmaceuticals, agrochemicals, and materials science. The purification of this compound is crucial to ensure its quality and efficacy. Ultraviolet (UV) and Infrared (IR) spectroscopic methods are widely used for the purification and characterization of organic compounds. UV spectroscopy is a powerful tool for detecting impurities and monitoring the purity of 2-methoxy naphthalene. The UV spectrum of 2-methoxynaphthalene typically shows absorption maxima at 220-240nmand280-300nm, corresponding to the π-π*transitions of the naphthalene ring. IR spectroscopy is another valuable tool for characterizing and purifying 2-methoxy naphthalene. The IR spectrumof2-methoxy naphthalene typically shows absorption bands at 3050-3100cm^-1(aromatic C-H stretching), 1600-1650cm^-1(aromatic C=C stretching), and 1250-1300 cm^-1 (C-O stretching).

CONCLUSION
By performing Identification test such as Nitrogen, Halogen and Sulphur, Hence the Yara-Yara product is free from these impurities. The proposed UV Spectrophotometric method was found very simple, rapid and economical .The method is validated incompliance with ICH guidelines is suitable for purification of 2-methoxynaphthalene with spectroscopy at the range of 226nm the linearity graph is obtained. In this work, FTIR Spectra of 2-methoxynaphthalene have been reported in the regions 4500-400cm.-1
REFERENCES


Ankita Thaikar*, Rani Madnakari, Kiran Patil, Priyanka Kankanwadi, Purification Of 2-Methoxy Naphthalene by UV And IR Spectroscopic Methods, Int. J. of Pharm. Sci., 2025, Vol 3, Issue 4, 3182-3191 https://doi.org/10.5281/zenodo.15285824
 10.5281/zenodo.15285824