
We use cookies to ensure our website works properly and to personalise your experience. Cookies policy
Department of Zoology Kakatiya University, Warangal-506009.
The Main objective of this study is to reveal the seasonal variations of heavy metal contamination at different sites in sewage water of Warangal metropolitan city. To get the extent of the trace metals contamination sewage water samples were collected from 10 different locations from in and around Warangal municipality. During the Pre-monsoon, Monsoon and Post-Monsoon seasons. The selected heavy metals are Cadmium (Cd), Chromium (Cr), Copper (Cu), Nickel (Ni), Lead (Pb) and Zinc (Zn) were determined by using Atomic Absorption Spectrophotometer (AAS). The level of studies seasonal variation of metals in water samples exceeded the safe limits of drinking water, indicated that water from this site were not safe for drinking and cooking. This study recommended the continuous monitoring of Cd, Cr, Cu, Pb, Ni and Zn in this sludge water. Municipal sites should be assessing at times to study heavy metal as its hazards disturbs ecological system.
Surface water is one of the major sources of water supply used to meet the overall demand of the urban and rural population. Sources of water supply such as rivers, lakes, reservoirs, and groundwater are being directly or indirectly being polluted due to rapid industrialization as well as urbanization. Discharges from the municipal and industrial wastewaters are the main sources of water pollution since they contain organic pollutants, chemicals and metals (Goldar & Banerjee 2004). Seasonal variation is a primary factor in evaluating the concentration of heavy metals in river sediments and surface water. Seasons are categorized based on the level of rainfall intensity: (a) monsoon season (heavy rainfall), (b) pre-monsoon season (light to moderate rainfall), (c) post-monsoon season (light rainfall), and (d) winter season (little to no rainfall) (Awasthi et al. 2024). Several studies have been conducted in the past to illustrate the significance of monitoring the metal concentrations in the water bodies and sediments of various water sources. Rajaei et al. (2012). Uncontrolled spreading of heavy metals and, thus, exposure of population to these are, to a significant part, the result of uncertainty in factors affecting the pollutants’ formation and transportation, e.g., industrial point sources, acid mine drainage, acid rain, dry deposition, solid waste disposal etc. (Miranda et al., 2022). Sediments are the essential constituent of the ecosystem, which has potential to accumulate toxic metals. Accumulation of the toxic metals are intensified by the different components such as humic matter, Sulphides, phyllosilicate, carbonate, and charged minerals (Sarika and Chandramohanakumar, 2008, Ranjan et al., 2018). Heavy metals can degrade the environment by polluting air, water, and soil, subsequently initiating adverse health effects in the ecology and living forms, when they get concentrated as a result of various industrial activities (Rajaram et al., 2020, Stankovic and Stankovic, 2013). The Present study characterizes the impact of municipal sewage water pollution on the quality of water in and around the Warangal municipality, through use of techniques, such as taking a water samples for their respective chemical analysis and determination of the degree of contamination by different components of heavy metals and their effects on surrounding life with seasonal basis.
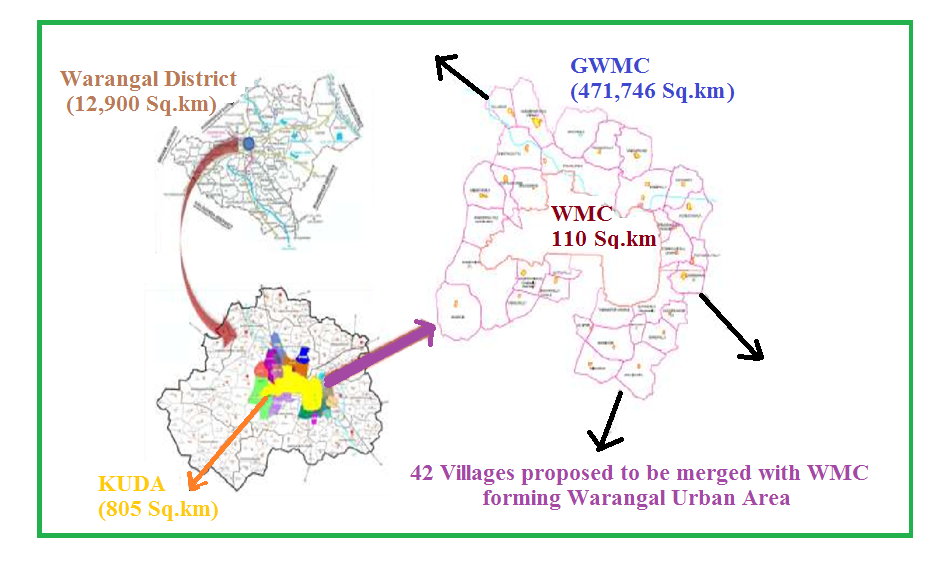
Fig: 1. Study Area:
2. MATERIALS AND METHODS
2.1. Sample collection.
The samples are collected from different time intervals like Monsoon, Post monsoon and pre monsoon seasons in throughout the year from month of September 2021 to March 2024 at two different sites in and around Warangal Municipality are followed by Fig: 1. All chemicals and reagents used in this study were of analytical and trace metal grades. Trace metal grades 65 % HNO3 (Nitric acid), 37 % HCL (Hydrochloric acid) and Double deionized water (pH 6.5±7.0) obtain from zeal chemicals & Co., hanamkonda, Warangal. Water Samples of different stations were collected in 1litre polyethylene bottles during these seasons of the year from adjoining areas of Warangal Municipality. The samples are properly labeled before collecting and kept in 1litre polyethylene bottles. Which have been washed two times with sewage water before collecting of sample. The sample bottles were tightly covered immediately. After collection samples brought into laboratory for further investigation.
2.2. Method A (nitric acid-hydrochloric acid digestion).
Out of 1Litre, we had taken 100 mL of water sample was placed in 250 mL beaker add 10 mL of freshly prepared acid mixture of 65 % HNO3 and 10 mL of 37 % HCL was added. Then, the mixture was heated gently over a Hot plate (95 °C ± 5 oC) for 1-2 h or (until the sample had completely dissolved) (Ang and Lee 2005).Then cool at room temperature the sample volume is reduced up to 20-30 mL. During the digestion procedures, the inner walls of the beakers were washed with 2 mL of deionized water to prevent the loss of the sample, and at the last part of the digestion processes, the samples were filtered with Whatman 42 (pore sized) filter paper. Then, a sufficient amount of deionized water was added to make the final volume up to 100 mL. Method was performed in triplicate for each sample. Keep samples at -4 oC until analysis.
2.3. Atomic Absorption Analysis of samples.
The digested samples were analyzed for heavy metals using SHIMADZOO-6300 Model Atomic Absorption Spectrophotometer (WizAArd software), at Team Labs & Consultants (Environmental pollution control centre), Ameerpet, Hyderabad and CPCB Sanathnagar, Hyderabad.
3. RESULTS AND DISCUSSION
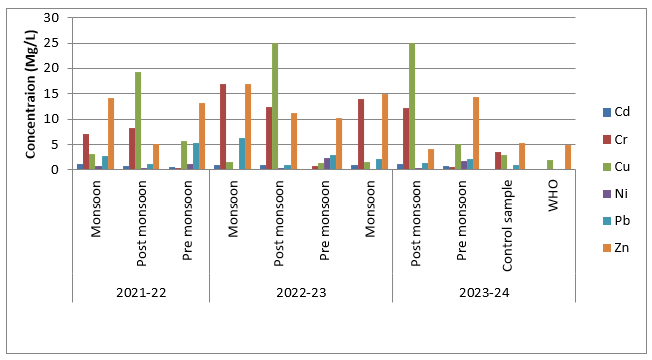
In the present Examination a total of six heavy metals were recorded in two Municipal sites which include Cadmium (Cd), Chromium (Cr), Copper (Cu), Nickel (Ni), Lead (Pb) and Zink (Zn). The studies were conducted for these heavy metals were detected during September 2021 to march 2024, is shown in Figure 2 and 3. Results of evaluated heavy metal parameters of the Municipal wastewater effluents were compared against WHOM for effluent discharge seasonally (Monsoon, Post Monsoon and Pre Monsoon seasons). The profiles of the heavy metal analysis of the Municipal effluent waste water samples collected at the Alankar site and Padmakshamma lake site are depicted in Table 1and 2.
3.1. Cadmium (Cd):
The main sources of cadmium pollution in these Municipal sites are plastic wastes, car repairing exhaust and other sewage domestic wastes. During study period Cadmium concentration at Alankar site water sample was from monsoon of 2021 to pre monsoon 2024 the highest Cadmium was found in pre monsoon season of March 2024 (0.121 Mg/L) and Cadmium concentration at Padmakshamma lake site highest Cadmium was found in monsoon season of July 2022 (1.25 Mg/L). The WHO limit of Cadmium was 0.01Mg/L. Compare with Control sample and WHO both sites are more concentrated due domestic sewage effluents. Cadmium is a known carcinogen and can cause various health problems, including kidney damage, bone diseases, and respiratory issues. Cadmium can accumulate in the soil and groundwater, posing risks to aquatic life and human health.
3.2. Chromium (Cr):
The toxicity and pollution of Chromium in Warangal Municipal is due to leather industries. Exceeding Chromium levels of Alankar site especially in Monsoon season due to painted idols and Ganesh immersion. The Chromium concentration at Alankar site water sample the more level of Chromium was found in monsoon season of September 2022 (19 Mg/L) and highest Chromium concentration in Padmakshamma lake site was monsoon season of September 2023 (14.01 Mg/L). Both sites are highly compared to control sample and WHO. The WHO limit of Chromium was 0.05Mg/L. Alankar site was more concentrated compare with Padmakshamma lake site. Chromium can affect plant physiological systems like photosynthesis, water relations, and mineral nutrition, and disrupt oxidative balance and enzyme activity. Skin Irritation and Allergies: Exposure to hex chromium can cause skin irritation, allergies, and eczema. Respiratory Issue of chromium can lead to respiratory problems like nasal ulcers, irritation, and lung cancer. Other Health Problems: Long-term exposure to chromium in water has been linked to other health issues like gallbladder diseases, chronic renal failure, and arterial hypertension.
3.3. Copper (Cu):
In this city, Copper is most properly emitted from paper, printing, electronics, house hold wastes and textile industries etc. In Chinnawadepally industrial site water sample the highest amount of Copper was found in post monsoon season of December 2023 (35.23 Mg/L) and highest Copper concentration in Padmakshamma Lake Site was post monsoon season of September 2022 (25.01 Mg/L). Both sites are highly compared to WHO. The WHO limit of Copper was 2.0 Mg/L. Alankar site was more concentrated compare with Padmakshamma Lake. Copper-contaminated water can cause gastrointestinal problems, liver and kidney damage, and other health issues. Excessive copper intake can also lead to neurological disorders and potentially increase the risk of certain cancers.
3.4. Nickel (Ni):
Release of Nickel from waste materials, including municipal and industrial waste. Domestic wastewater can contain nickel. In Alankar site water sample the more concentration of Nickel was found in pre monsoon season of March 2023 (2.01 Mg/L) and more concentration of Nickel in Padmakshamma lake site was pre monsoon season of March 2023 (2.31 Mg/L). It is slightly increased in both sites compare with WHO limits. The WHO limit of Nickel was 0.07 Mg/L. Symptoms of Nickel include nausea, vomiting, diarrhea, and abdominal pain and skin rashes.
3.5. Lead (Pb):
Source of lead pollution is due to painted Ganesh idols and Durgamatha immersion, lead coated pipes, storage batteries, cosmetics, house hold dust and industrial discharge. The painted idol immersion and automobile exhausts are main source to increase level of Pb in sample sites. In Alankar site water sample the more concentration of Lead was found in pre monsoon season of April 2022 (3.13 Mg/L) and more concentration of Lead in Padmakshamma lake sit site was monsoon season of September 2023 (6.32 Mg/L). It is greatly increased in both sites compare with WHO limits. The WHO limit of Lead was 0.01 Mg/L. Loss of short-term memory, Depression, Nausea, Abdominal pain, Loss of coordination, Fatigue and Problems with sleep.
3.6. Zink (Zn):
The main source of Zink by waste combustion and fertilizers from industrial sites. In Alankar industrial site water sample the more concentration of Zink was found in monsoon season of September 2024 (18 Mg/L) and more concentration of Zink in Padmakshamma Lake Site was pre monsoon season of May 2023 (17 Mg/L). It is greatly increased in both sites compare with WHO limits. The WHO limit of Lead was 5.0 Mg/L. The main cause of Zinc leads Loss of taste and smell, diarrhea, Loss of appetite and dermatitis etc.
4. CONCLUSION:
In Summary, the results revealed that the presence of toxic metals in Municipal waste water samples. Concentration level of toxic metals sequence fallowed in three seasons Cu>Cr>Zn>Pb>Cd>Ni. Seasonally the Cu is more abundant compare those of Cr, Pb and Zn. Cr also more increased due to leather effluents. One and all the Pb and Zn also more because Ganesh and Durgamatha painted idol immersion in monsoon season compare with WHO for drinking water guidelines. Cd and Ni are found very less compare with above toxic elements. This study devotes that the effect of aquatic species presence of toxic metals injected through food chain. The surrounding population is also more prone to asthma, chronic bronchitis, abdominal pain, chocking and pulmonary tuberculosis. Consequently, this study encourages environmentalists, administrators, and public health workers to create public awareness to avoid the consumption of this water to reducing health risk.
REFERENCES
Table1: Seasonal Variation of Heavy Metal Concentration at Alankar Site
|
Year |
2021-22 |
2022-23 |
2023-24 |
||||||||
|
season |
Monsoon |
Post monsoon |
Pre monsoon |
Monsoon |
Post monsoon |
Pre monsoon |
Monsoon |
Post monsoon |
Pre monsoon |
Control sample |
WHO |
|
Cd |
0.51 |
0.39 |
0.012 |
0.38 |
0.43 |
0.08 |
0.12 |
0.56 |
0.121 |
0.15 |
0.01 |
|
Cr |
6.23 |
9.68 |
0.512 |
19 |
11.23 |
0.31 |
15 |
11.23 |
0.569 |
3.5 |
0.05 |
|
Cu |
2.49 |
20.15 |
4.96 |
1.23 |
35.23 |
2.13 |
1.45 |
34.23 |
6.12 |
3.01 |
2.0 |
|
Ni |
0.78 |
0.231 |
2.01 |
0.001 |
0.236 |
2.01 |
ND |
0.056 |
2.23 |
0.078 |
0.07 |
|
Pb |
1.82 |
0.561 |
3.12 |
3.12 |
0.569 |
2.65 |
1.98 |
ND |
1.99 |
1.01 |
0.01 |
|
Zn |
17.52 |
4.127 |
12.98 |
16.1 |
10.23 |
12.56 |
18 |
3.01 |
13.98 |
5.2 |
5 |
ND=Not detected WHO (World Health Organization) Limits for drinking water quality (2011) Mg/L.
Fig: 2. Seasonal comparison of Heavy metal concentrations at Alankar site
Table: 2. Seasonal variation of heavy metal concentration at Padmakshamma lake site
|
Year |
2021-22 |
2022-23 |
2023-24 |
||||||||
|
season |
Monsoon |
Post monsoon |
Pre monsoon |
Monsoon |
Post monsoon |
Pre monsoon |
Monsoon |
Post monsoon |
Pre monsoon |
Control sample |
WHO |
|
Cd |
1.25 |
0.8 |
0.56 |
0.96 |
0.98 |
0.12 |
0.89 |
1.23 |
0.78 |
0.15 |
0.01 |
|
Cr |
7.01 |
8.23 |
0.369 |
17 |
12.36 |
0.69 |
14.01 |
12.12 |
0.56 |
3.5 |
0.05 |
|
Cu |
3.12 |
19.23 |
5.69 |
1.56 |
25.01 |
1.32 |
1.54 |
24.98 |
5.12 |
3.01 |
2.0 |
|
Ni |
0.78 |
0.32 |
1.21 |
0.156 |
0.321 |
2.31 |
ND |
0.36 |
1.69 |
0.078 |
0.07 |
|
Pb |
2.65 |
1.23 |
5.32 |
6.32 |
0.989 |
3.01 |
2.1 |
1.32 |
2.11 |
1.01 |
0.01 |
|
Zn |
14.23 |
5.12 |
13.21 |
17 |
11.12 |
10.32 |
15 |
4.1 |
14.36 |
5.2 |
5 |
ND=Not detected WHO (World Health Organization) Limits for drinking Waterquality (2011) Mg/L.

Dr. K. Ganesh, Dr. G. Rajender, Seasonal Variations of Heavy Metals in Municipal Sewage Water of Warangal Metropolitan City, Int. J. of Pharm. Sci., 2025, Vol 3, Issue 7, 3881-3887. https://doi.org/10.5281/zenodo.16558062
 10.5281/zenodo.16558062