Yash Institute of Pharmacy, Chh. Sambhajinagar, Maharashtra, India 431134
Most of the pharmaceuticals are analyzed using UV-Visible methods due to their simplicity, better understanding for students, and economy. Ammonia and primary amino groups, whenever heated with ninhydrin in the presence of ammonium molybdate, form a rhenium purple color. The simple, precise, and cost-effective UV-Visible method has been developed and validated for the determination of Nicotinamide in bulk drugs. The method is based on the reaction of ninhydrin with amide present in Nicotinamide in the presence of ammonium molybdate to form a blue chromogen, which is determined spectrophotometrically at 761nm. The effects of variables such as temperature, heating time, concentration of colour-producing reagent, and stability of colour were investigated to optimize the procedure. The method is validated for linearity, accuracy, and precision parameters. The rhenium purple color of chromogen is shifted towards longer wavelengths (from 570 nm to 761 nm). Thus, Nicotinamide shows a Bathochromic shift due to the presence of the amide group. This reaction is quantitatively proceeding at 970±1°C in 5 minutes. Beer Lambert’s law is obeyed in the concentration range of 0-125 µg/ml and is described by the regression equation y = 0.0047x with a regression coefficient (r2) of 0.9997. For Nicotinamide, the value of molar absorptivity and Sandell’s sensitivity are 2.3487 x 10² L/mol/cm and 0.2166 µg/ cm2, and LOD and LOQ are found to be 0.0238 and 0.0722 µg/ml, respectively. The statistically validated results indicate that the proposed method is simple, precise, green, and cost-effective.
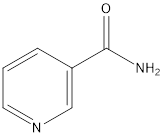
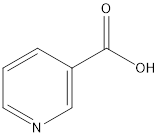
Nicotinamide (NCT), also called niacinamide, is 3-pyridine carboxamide (Figure. 1-A). NCT is an amide form of nicotinic acid or niacin (Figure 1-B). NCT is a white crystalline powder or colorless crystals; it has a molecular weight of 122.12 g/mol. It is also one of the hydrophilic B vitamins, called vitamin B3. Many multivitamins and supplementary pharmaceutical preparations contain NCT1. The main sources of niacin include meat, liver, green leafy vegetables, wheat, oats, palm kernel oil, legumes, yeast, mushrooms, nuts, milk, fish, tea, and coffee2. It is also found in many dermal preparations, such as solutions, creams, and gels, whether as a single active ingredient or with other active ingredients. NCT is used for many skin conditions, including acne with variable concentration (3/4/5 % w/w).
[A]
[B]
Figure 1: Chemical Structures of Nicotinamide [A] and Naicin [B]
Several classical and advanced analytical methods are available for Nicotinamide estimation in various samples, like Titrimetry3, Colorimetry4,5, UV Spectroscopy6–10, HPLC11–16, HPTLC17–19Capillary Electrophoretic Chromatography20,21. These methods, individually or in combination, are crucial for ensuring the quality, efficacy, and safety of Nicotinamide-containing formulations. Each method has its unique advantages depending upon the sample type, required sensitivity, and specific application.
The quantification of Nicotinamide has been a fascinating area of research, and visible spectrophotometry indeed stands out as a method of choice. Its ability to strike a balance between accessibility and analytical effectiveness makes it highly favoured. Researchers have leveraged it for its simplicity in operation and excellent selectivity for distinguishing compounds. Additionally, its cost-effectiveness makes it a practical option for various industrial and academic laboratory settings, including those with budget constraints. Its accuracy and precision ensure reliable results, which are crucial in pharmaceutical analysis.
As per the author's knowledge, to date, there is no documented method showing bathochromic effect on Nicotinamide when it is reacted with ninhydrin in the presence of ammonium molybdate. The objective of this research work is to determine how the molecular environment created by ninhydrin and ammonium molybdate affects Nicotinamide’s electronic transitions, leading to the bathochromic shift
The reaction involving ninhydrin and the amide group in Nicotinamide, catalysed by ammonium molybdate to produce a blue chromogen, is a brilliant choice for detection, as shown in Scheme 1. Measuring the absorbance spectrophotometrically at 761 nm ensures precise quantification due to the distinct peak of the chromogen at that wavelength. This approach combines chemistry and analytical techniques to achieve sensitivity and selectivity in the analysis.
The bathochromic shift from 570 nm to 761 nm, as observed in the rhenium purple color of the chromogen, reflects the interplay between molecular structure and light absorption. This specific shift due to the amide group in Nicotinamide underscores how structural nuances can influence the chromophore's properties. By leveraging this, the spectrophotometric method at 761 nm ensures both precision and specificity in detection, blending the art and science of analytical chemistry.
2. MATERIALS AND METHODS
2.1 Instrumentation
A SHIMADZU 1800 UV-Visible spectrophotometer with 102mm matching quartz cells was used for absorbance measurements. The UV spectra were recorded over the wavelength range 400-800 nm.
2.2 Chemicals and Reagents
Reagents and all chemicals employed were of Analytical Grade. Nicotinamide was obtained as a gift sample from Wockhardt Pharmaceuticals Pvt. Ltd. (Aurangabad, India). All other reagents and chemicals used were of Analytical Grade.
2.3 Stock Solution of Nicotinamide
Weigh accurately 100 mg of Nicotinamide and dissolve in 100 mL of 0.1 M HCl (1000 ppm). Stock Solution [A], further dilute 10 mL of Stock Solution [A] with 0.1 M HCl up to 100 mL (100 ppm) and refer to as Stock Solution [B].
2.4 Preparation of 0.1 M Hydrochloric Acid (HCl) Solution
Dissolve 21.25 mL of Concentrated Hydrochloric Acid in 100 mL of Distilled Water.
2.5 Preparation of 2M Glacial Acetic Acid
Weigh accurately 11.5 mL of Glacial Acetic Acid and dissolve in 100 mL of Distilled water.
2.6 Preparation of 0.2 M Ninhydrin Solution
Take 50 g of Ninhydrin and dissolve in 23.75 g of Ethanol and stir until it gets completely dissolved. To this solution, add 5 mL of 2M glacial acetic acid.
2.7 Preparation of 0.2M Ammonium Molybdate Solution
Accurately weigh 12.35 g of Ammonium Molybdate and dissolve in 50 mL of deionized water or distilled water.
2.8 Working Principle of Chromogen Formation
Recently added newly developed analytical methods with good properties, such as selectivity and sensitivity, were not sufficient, so modern analytical methods also need to be green. Hence, the scope of this present study is to develop a method concerning two different objectives: i] lowering the heating time, ii] and increasing the quantitative and qualitative analysis. Both factors are of great importance in reducing time and increasing the accuracy rate. In this present study, Nicotinamide developed a dark blue colored product with ninhydrin in the presence of ammonium molybdate, and further spectrophotometric analysis was carried out using 0.1M HCl as a Blank solution.
The reaction of an amide group with ninhydrin is less common compared to its reaction with free amino groups. However, under specific conditions, ninhydrin can interact with amides, especially when catalysed by agents like ammonium molybdate. Here's a general outline:
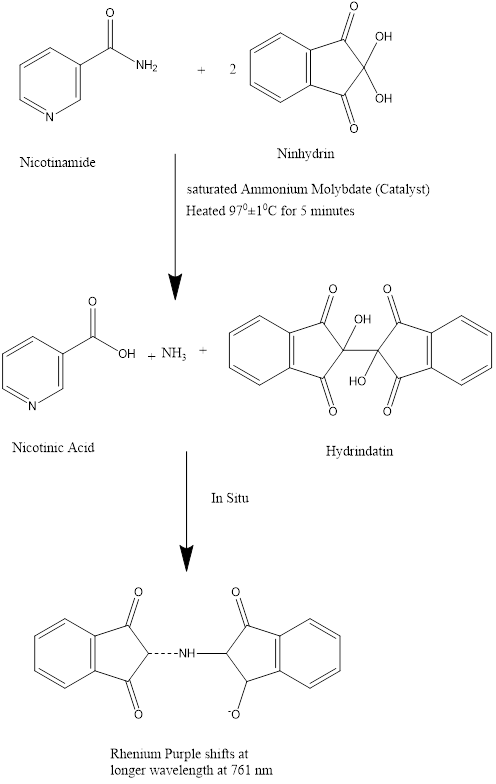
Scheme: Reaction between Nicotinamide with Ninhydrin catalyzed by ammonium molybdate.
2.9 Procedure
In a 25 ml beaker, add 10 ml standard stock solution B, warm it in a boiling water bath at 97 ± 1°C for 5 minutes, to this solution add 5 ml of 0.2Ammonium Molybdate and 5 ml of 0.2M Ninhydrin, and cool at room temperature. Use this solution for further dilutions as Stock solution C, which contains 1000 µg/ ml Nicotinamide. Scan the spectrum, and absorbance was measured at ? max at 761 nm versus the reagent blank (Figure 2).
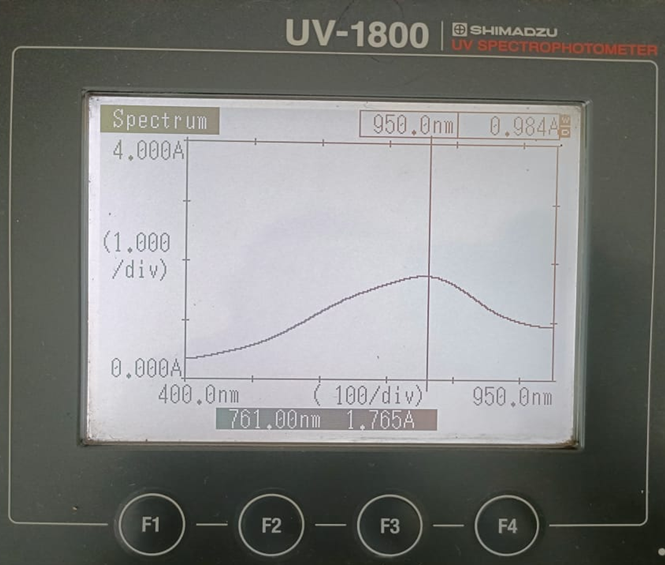
Figure 2: UV-Visible Spectrum of Nicotinamide.
3. METHOD VALIDATION
3.1 Effect of temperature on absorbance
The effect of temperature on the complexation reaction at 800, 900 97 ± 1°C was examined (Table 2). It was observed that the ninhydrin–NIC complex in saturated ammonium Molybdate required 97 ± 1°C for obtaining maximum and stable absorbance and remained constant for about 8 further hours.
Table 2: Effect of temperature on absorbance
|
Temperature (0 C) |
Absorbance |
|
80 ± 1 |
0.049 |
|
90 ± 1 |
0.804 |
|
97 ± 1 |
1.765 |
3.2. Linearity
The method's linearity was examined22 From the Standard Stock solution B (100μg/ml), different aliquots (2.5, 5.0, 7.5, 10.0 and 2.5) were taken in a series of 10 ml volumetric flasks and 1.0 ml ninhydrin was added to it followed by 1.0 ml saturated ammonium molybdate solution and volume made up with 0.1M HCl to get concentration 25-125μg/ml. All flasks were heated for 5 min in a boiling water bath and cooled to room temperature, and the absorbance was measured at 761 nm. Five replicates of analytes were measured, and the absorbance versus concentration is shown in Table 2. Plot a graph of concentration versus absorbance, a linear correlation was found, which obeys Beer-Lambert’s Law in the concentration range of 25-125 μg/ml (Figure 3). Regression analysis of Beer’s law data using the method of least squares was made to evaluate the slope (b), intercept (a), and the correlation coefficient (r2). .so far, from the below graph, the correlation coefficient, v-intercept, and slope of the regression line are given in Table 323.
Table 2: Observation data for the calibration Curve of Nicotinamide
|
Concentration (µg/ml) |
Absorbance |
|
25 |
0.115 |
|
50 |
0.236 |
|
75 |
0.355 |
|
100 |
0.468 |
|
125 |
0.577 |
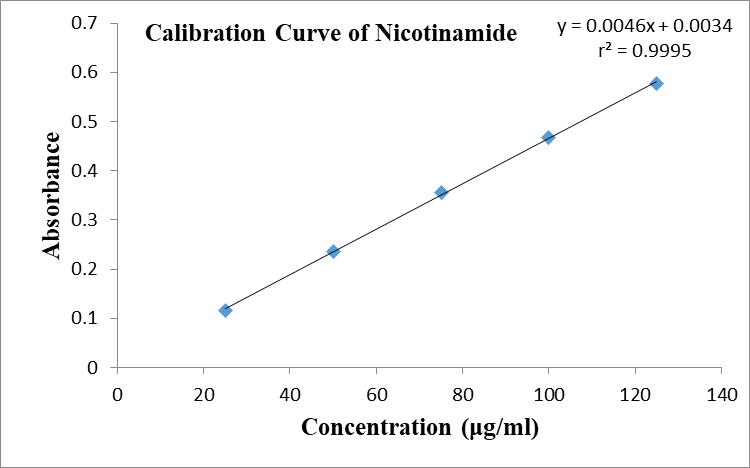
Figure 3: Calibration curve of Nicotinamide.
3.3. Limit of Detection (LOD) and Limit of Quantification (LOQ)
Two important parameters, that is, Limit of Detection(LOD) and Limit of Quantification (LOQ), were determined to test the performance limits24. The detection limit of a singular analytical method is defined as the minimum concentration of an analyte present in a sample that can be recognized, albeit not necessarily quantified as an exact measurement. The quantitation limit of a singular analytical method refers to the minimum concentration of an analyte in a sample that can be determined quantitatively with appropriate precision and accuracy. The quantitation limit serves as a critical parameter in quantitative assays aimed at identifying trace levels of compounds within sample matrices and is particularly employed in the assessment of impurities and/or degradation products. The values of the limit of detection (LOD) and limit of quantitation (LOQ) are established utilizing the standard deviation of the response in conjunction with the slope method, as delineated in the guidelines provided by the International Conference on Harmonization (ICH) and presented in Table 3.
Table 3: Optical Characteristics data and validation parameters of Nicotinamide
|
Parameter |

|
|
Range (µg/ml) |
25-125 |
|

|
761 |
|

|
2.3657 x 10² |
|

|
0.5199 |
|

|
0.0046 |
|

|
±0.0082 |
|

|
±0.0063 |
|

|
±0.0051 |
|
Correlation of coefficient (r2) |
0.9996 |
|

|
3..3444 |
|

|
10.1346 |
3.4. Precision
3.4.1. Intraday Precision
Precision quantifies the veracity of a model's positive predictions. The ratio of correct guesses to the total number of correct and incorrect predictions is used to determine it. Particularly useful in scenarios where minimising false positives is critical, precision emphasises the accuracy of positive predictions for every occurrence predicted as positive by the model25. A common approach to demonstrate intraday precision, where measurements are taken from the same batch at consistent intervals-initially after 24 hours and after 48 hours (Table 4). This method ensures that variability within the same day and across the day is carefully observed.
3.4.2. Interday Precision
Interday precision of the test method is demonstrated by three samples of the same batch (same concentration) on three successive days (Table 4).
Once the data is collected, the precision can be assessed by calculating the Relative Standard Deviation (RSD%) for the replicate measurements over the three days. A low RSD% value would confirm that the method is reliable and reproducible over multiple days.
A low RSD% value in UV spectroscopy is indicative of high precision and reliability in the method. While the acceptable threshold can vary depending on regulatory guidelines and the specific application, in most cases:
Table 4: Evaluation of intra-day and inter-day accuracy and precision
|
NIC taken (μg/ml) |
Intraday Accuracy and Precision |
Interday Accuracy and precision |
||||
|
NIC found |
RE % |
RSD % |
NIC found |
RE % |
RSD % |
|
|
(μg/ml) |
(μg/ml) |
|||||
|
100 |
91.29 |
89.19 |
1.59 |
86.74 |
83.74 |
1.45 |
|
150 |
141.82 |
94.83 |
0.97 |
138.62 |
92.38 |
1.02 |
|
200 |
192.34 |
96.16 |
0.76 |
187.54 |
94.57 |
0.69 |
3.5. Accuracy
The recovery study method represents26. By adding different percentages (80%, 100%, and 120%) of Nicotinamide bulk sample within the linearity range, we ensure a robust evaluation of how well the method measures the actual amount of analyte present. The results compiled in Table 5 likely show recovery percentages close to 100%, indicating the accuracy of the method.
Recovery within 98-102%: This range is generally considered excellent accuracy in analytical chemistry.
Recovery within 95-105%: May still be acceptable depending on regulatory guidelines and the specific application.
Table 5: Recovery Data
|
Level |
Amount of NIC added (µg) |
Amount of NIC found (µg) |
% Recovery |
% RSD |
|
80% |
80 |
823.1 |
103.87 |
0.71 |
|
100% |
100 |
102.75 |
102.75 |
0.83 |
|
120% |
120 |
115.56 |
96.3 |
0.92 |
*An average value ± relative standard deviation of 5 observations
Amides are more stable and do not spontaneously release ammonia. Under catalyzed conditions, the amide group might hydrolyze, releasing ammonia or an amine, which then reacts with ninhydrin to form a different chromogen, such as the blue product observed for Nicotinamide.
The chromogen produced can exhibit a bathochromic shift (e.g., to 761 nm for Nicotinamide), resulting in a color shift toward longer wavelengths, influenced by the amide group's electronic properties. The reaction with amides is more selective, as it requires specific conditions and catalysts, making it less common but useful in targeted analytical applications.
The research method is validated, viz. stability, linearity, LOD, LOQ, Precision, and Recovery data for Nicotinamide in bulk drugs, and found within acceptable limits as per ICH Guidelines21
CONCLUSION
As a versatile analytical tool, based on the results and discussion, it can be concluded that the reaction between ninhydrin and the amide group in Nicotinamide is indeed a striking example of chemical ingenuity. The catalytic role of ammonium molybdate highlights how carefully selected reagents can enhance sensitivity and reactivity. The newly developed spectrophotometric method for determining Nicotinamide is precise, economical, and environmentally friendly. By highlighting its eco-friendliness, cost effectiveness, and the avoidance of organic solvents, we have shown how this method aligns with sustainable and economical laboratory practices. Overall, this innovative method suggests a practical solution for quality control of Nicotinamide in bulk quantities for research and academic laboratory settings with budget constraints. Its accuracy and precision ensure reliable results, which are crucial in pharmaceutical analysis.
ACKNOWLEDGEMENT
The authors gratefully acknowledge the receipt of pure Nicotinamide as a Gift sample from Wockhardt Pharmaceuticals Ltd.(Chhatrapati Sambhajinagar). We extend our heartfelt gratitude to Dr. S. S. Angadi, the esteemed principal of Yash Institute of Pharmacy, Chhatrapati Sambhajinagar, for his unwavering support and encouragement throughout this project.
AUTHORSHIP CONTRIBUTION STATEMENT
Vandana Patil: Designed the overall study concept and methodology
Krishna Chopde: Conducted experimental trials and quality control assessments
Amruta Jadhav: Contributed to the literature review and Data Synchronization
Suwarna Kale: Assisted in manuscript revision and provided the critical ideology
Sachidanand Angadi: Funding and Data Curation
REFERENCES


Dr. Vandana Patil, Krishna Chopde, Amruta Jadhav, Nilay Shinde, Spectral Insights: Bathochromic Shifts in Visible Spectra of Nicotinamide with Ninhydrin, Int. J. of Pharm. Sci., 2025, Vol 3, Issue 8, 883-892. https://doi.org/10.5281/zenodo.16789120
 10.5281/zenodo.16789120
