1 Center for Advanced Energy Materials, SRM TRP Engineering College, Tiruchy, India.
2 Department of Bioinformatics, Bharathidasan University, Tiruchy, Tamilnadu, India
3 Department of Chemistry, Annamalai University, Annamalai Nagar, Tamilnadu, India
Ag and Ag/Co bimetallic nanoparticles synthesized by chemical reduction method. Ag/NS/CD and Ag/Co/NS/CD nanomaterials were examined by UV-visible, fluorescence, FTIR, differential scanning colorimetry, XRD, FE-SEM and TEM in both the solution and solid phases. Nanotubes were noticeable in the TEM images while marble stones like images are observed in SEM. Surface plasmon absorption maxima for silver and silver/cobalt nanoparticles were apparent in UV-visible spectra at 420 and 405 nm, respectively. Blue-shifted absorbance and emission maxima noticed in Ag/NS/CD and Ag/Co/NS/CD showing that both nanometals were present in the CD cavity. For the aforementioned systems, molecular modelling and antibacterial outcomes have been analysed. Molecular docking study indicates that, NS drug showed anticancer activity against the 1r51 and 2oh4 proteins.
Nimesulide known as N-(4-Nitro-2-phenoxyphenyl)methanesulfonamide (NS, Fig. 1) is a non-steroidal anti-inflammatory medication (NSAID) having analgesic and antipyretic characteristics that is comparatively COX-2 selective. It is used to treat acute pain, osteoarthritis symptoms and primary dysmenorrhea in adolescents and adults over the age of 12 [1,2]. Ag and Ag/Co nanoparticles interact with the NO2 or SO2 group of NS, changing their spectroscopic properties. Ag and Ag/Co nanoparticles with the blue shifted spectra cause a progressive decrease in the absorption and emission intensities. Silver ions can be chemically reduced by trisodium citrate in an aqueous phase to create Ag and Ag/Co nanoparticles [3-9].
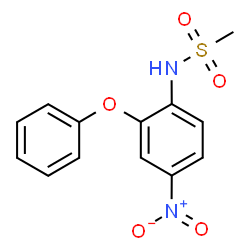
Fig. 1. Chemical structure of Nimesulide (NS).
This study looked at how the nimesulide drug interacted with cyclodextrin with silver and silver/cobalt nanoparticles. In addition, Ag and Ag/Co nanoparticles are employed to examine how well cyclodextrins (CD) release drugs into biomimicking settings. In aqueous media, CD partially forms inclusion complexes with a range of medicines into the cavity [10-12]. As biomimetic microreactors, innovative media for photochemical and photophysical research, building blocks and functional units for supramolecular structures, as well as in a variety of industrial settings, CDs have been used extensively [13,14]. The chemical characteristics of guest molecules placed inside the cavity may be affected by the small volume and relatively low polarity of the CD cavity. Upon complexation with CD, the guest's photophysical and photochemical properties primarily undergo notable changes. This has been used in research on the equilibria of inclusion complexation between the drug-coated CD and the metal nanoparticles' shifting properties [15].
2. Experimental
2.1. Preparation of Drug:CD inclusion complex in solution
In the 10 ml standard measuring flask, various concentrations of α-CD or β-CD solution (0.1, 0.2, 0.4, 0.6, 0.8, and 1.0 10-2 M) were taken. The NS stock solution had a 2 ×10⁻² M concentration. The NS stock solution (0.1 or 0.2 ml) was added to the flasks mentioned above. The combined solution was thoroughly shaken and diluted with three times as much distilled water, up to 10 ml. All of the flasks had a final drug concentration of 4 ×10⁻⁴ M. The studies were conducted at 298 K, or room temperature.
2.2. Preparation of silver and silver/cobalt nanoparticles
The process below has been used to produce silver nanoparticles. In 50 ml of deionized water, 0.01 M of silver nitrate was dissolved, and the solution was heated to between 50 and 60 °C for 20 to 30 minutes. With vigorous shaking, one to two ml of 1% trisodium citrate in deionized water were added to this solution. Ag nanoparticle production is confirmed by the appearance of a pale yellow colour [16-20]. The warmed silver nanoparticle solution was then gradually supplemented with 0.01 M cobalt sulphate solution in 50 ml of deionized water while being constantly stirred.
2.3. Preparation of Ag-NS-CD nanomaterials
Using the sol-gel process, solid inclusion complex nanomaterial was formed. In 40 cc of distilled water, CD (1 mmol) was dissolved. A gradual dilution of NS (1 mmol) in 10 ml of ethanol was added to the CD solution. Using a magnetic stirrer, this mixture was heated to 50 °C for two hours. The silver nano solution was then added to this solution and mixed one more for two hours. After that, this solution was frozen and dried (mini-lyophilized) at -80 °C. The powder samples of Ag/NS/CD that were collected were used for additional analysis. The same method was utilized to make Ag/Co/NS/CD nanomaterials. The Ag/Co nanoparticle solution was added to the NS/CD inclusion complex.
2.4. Antibacterial Activity
By using the disc diffusion method, the antibacterial activity of NS was evaluated against bacterial pathogens. In order to do this, a bacterial pathogen was inoculated in nutrient broth and cultured for 1–2 hours before an antibacterial experiment. On the Muller Hinton agar plates, every bacterial strain was dispersed separately. The disc was loaded with various quantities of NS -25 µl, 50 µl, 75 µl and 100 µl was incubated for 24 hours at 37 °C. The assay was performed three times. After the incubation period was over, the zone of inhibition was measured in millimeters. All the data were statistically analyzed.
2.5. Molecular Modeling Studies
The molecular modelling software Spartan 08 was used to create the molecular geometry of NS, CD, and its inclusion complexes. After constructing two orientation inclusion complexes structurally, the most stable complexation energy has been determined using the semi-empirical PM3 method in the gas phase using Gaussian 09W software.
3. RESULT AND DISCUSSION
3.1. Effect of α-CD, β-CD, and solvents on nimesulide drug
In the presence of α-CD, β-CD and solvents, the nimesulide absorption and fluorescence spectra were provided in Table 1, and Fig.2). The absorption maximum of NS in water seen at 298 nm. The NS undergo a red shift from 298 nm to 305 nm when α-CD and β-CD molecules are added. The absorbance in both the α-CD and β-CD steadily increased with a rise in CD concentrations. NS has dual emission peaks at 367 and 433 nm in both water and the CDs. Shorter wavelength intensities increased with a blue shift as CD concentration increased, whereas longer wavelength intensities decreased at the same maxima. Due to the increased stiffness of NS in the CD cavities, a dual emission spectrum was produced. According to the above mentioned findings, the NS molecule is tightly bound within the CD cavities [21-27]. The Benesi-Hildebrand relation can be used to calculate the association constant (K) of the inclusion complexes of NS (Table 1).
Table 1 Absorbance and fluorescence spectral maxima of NS with different solvents, α-CD and β-CD concentrations.
|
Solvents |
labs |
log e |
lflu |
|
Cyclohexane |
287 218 |
4.03 4.27 |
320 373 |
|
1,4-Dioxane |
298 218 |
4.02 4.07 |
320 415 |
|
Ethyl acetate |
298 218 |
4.00 3.89 |
350 |
|
Acetonitrile |
298 212 |
4.01 4.24 |
350 |
|
2-Propanol |
298 219 |
4.07 3.89 |
320 372 |
|
Ethanol |
298 219 |
4.03 4.25 |
367 430 |
|
Water |
298 |
3.64 |
367 433 |
|
α-CD [0.01 M) |
305 |
3.84 |
359 433 |
|
β-CD [0.01 M] |
306 |
3.86 |
360 434 |
|
α-CD K (1:1) x105 M-1 |
156 |
|
44 |
|
β-CD K (1:1) x105 M-1 |
104 |
|
90 |
|
α-CD DG (kcalmol-1) |
-12.7 |
|
-9.5 |
|
β-CD DG (kcalmol-1) |
-11.7 |
|
-11.3 |
|
Excitation wavelength (nm) |
|
|
300 |
K – binding constant, DG – Gibbs free energy
The absorption and emission spectral data of NP was examined in various polarity solvents in order to compare the NS:CD inclusion complexation process (Table 1). From the non-polar to polar solvent, the NS molecule's absorption and emission spectrum maxima are red shifted. In all the solvents, the NP molecule exhibit a dual emission. The stronger delocalization of the NO2/SO2 groups and the aromatic ring's π-cloud is reflected in the larger red shift in the absorption and emission spectral maxima [28-30]. In solvents, NS exhibits different spectral maxima for the absorption and emission indicates NS molecules included in the CD cavity.
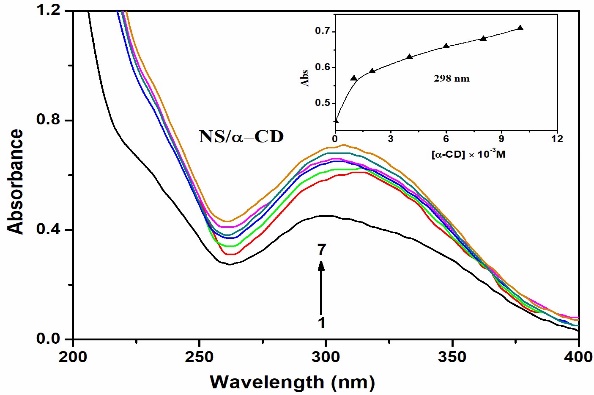
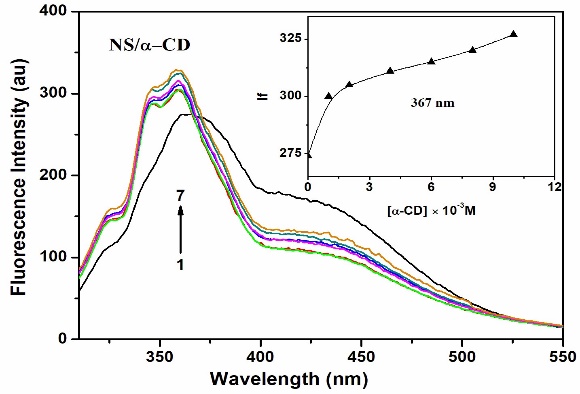
Fig. 2. Absorption and fluorescence spectra of NS in different α-CD concentrations (M): (1) 0, (2) 0.001, (3) 0.002, (4) 0.004, (5) 0.006, (6) 0.008, (7) 0.01. Insert figure: Absorbance/ fluorescence intensity vs [α-CD]
3.2. Molecular Modeling
The semi-empirical PM3 approach was used to optimise the ground state geometries of NS, α-CD, β-CD and their inclusion complexes [21-27]. The HOMO, LUMO, energy, enthalpy, entropy, free energy, dipole moment, zero-point vibrational energy, Mullikan charge, and zero-point vibrational energy of the NS, α-CD and β-CD, as well as inclusion complexes are listed in Table 2 and Fig.3.
Table 2 Energetic features, thermodynamic parameters and HOMO-LUMO energy calculations for NS and its inclusion complexes by semiempirical PM3 method
|
Properties |
NS |
α-CD |
β-CD |
NS-α-CD |
NS -β-CD |
|
EHOMO (eV) |
-9.63 |
-10.37 |
-10.35 |
-9.12 |
-9.20 |
|
ELUMO (eV) |
0.74 |
1.26 |
1.23 |
0.54 |
0.58 |
|
EHOMO – ELUMO (eV) |
-8.89 |
-11.63 |
-11.58 |
-9.66 |
-9.78 |
|
Dipole (D) |
6.66 |
11.34 |
12.29 |
10.75 |
10.07 |
|
E (kcal mol-1) |
-162.25 |
-1247.62 |
-1457.63 |
-1340.86 |
-1560.37 |
|
ΔE (kcal mol-1) |
|
|
|
-68.89 |
-59.48 |
|
G (kcal mol-1) |
115.86 |
-676.37 |
-789.52 |
-655.35 |
-807.39 |
|
ΔG (kcal mol-1) |
|
|
|
-136.88 |
-97.99 |
|
H (kcal mol-1) |
160.59 |
-570.84 |
-667.55 |
-714.64 |
-954.59 |
|
ΔH (kcal mol-1) |
|
|
|
-16.79 |
-126.45 |
|
S (kcal/mol-Kelvin) |
0.103 |
0.353 |
0.409 |
0.462 |
0.495 |
|
ΔS (kcal/mol-Kelvin) |
|
|
|
0.006 |
-0.017 |
|
ZPE |
149.62 |
635.09 |
740.56 |
891.84 |
893.14 |
|
Mulikan charge |
|
0.00 |
0.00 |
0.00 |
0.00 |
kcal/mol; **kcal/mol-Kelvin; ZPE = Zero point vibration energy
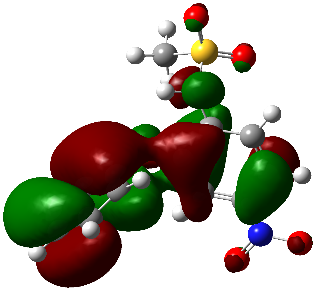
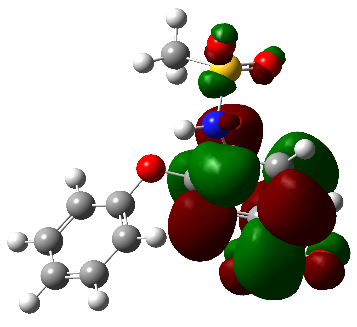
(a) optimized structure (b) HOMO (d) LUMO
Fig. 3. PM3 optimized structure of (a) NS (c) HOMO, and (c) LUMO of NS
The above NS:CD parameter values are significantly different from those of the isolated NS molecule, indicating the formation of an inclusion complex. The guest molecule's critical bond distances, bond angles and dihedral angles before and after complexation in α-CD and β-CD as determined by the PM3 method. The findings indicate that the CDs environment marginally modifies the NS's geometry.
NS molecule can form two different kinds of inclusion complexes with α-CD and β-CD: Either an aromatic ring (without substitution) or a phenyl ring (with NO2/SO2 group substitution) may be covered in the CD cavity. In NS, the horizontal bond distance between the aromatic ring hydrogen and SO2 is 8.91 Å, while the vertical bond distance between the SO2 and NO2 group is 8.16 Å (Fig. 3). The horizontal bond distance between the aromatic ring hydrogens and the vertical bond length between the SO2 and NO2 groups are greater in NS than the α-CD and β-CD cavity size. Because the horizontal bond length of the NS molecule exceeds the CD dimensions, it cannot completely encapsulate within the CD cavity. Additionally, because the NS size is larger than the CD cavity size, it is not possible to encapsulate the SO2 or NO2 groups substituted phenyl rings; as a result, the aromatic ring (without substitution) is encapsulated in the CD cavity. According to the findings, the NS molecule is partially enclosed in the α-CD and β-CD cavities. Further, it was confirmed by the inclusion complexes' optimised structures that the NP molecule was only partially incorporated into the CD cavity.
3.3. Effect of Ag and Ag/Co nanoparticles on nimesulide drug
Absorption and fluorescence spectra for the Ag and Ag/Co with NS nanoparticles in the solution phase were measured. The emergence of silver nanoparticles signaled the transformation of the colourless liquid into a yellowish hue. Around 420 nm, an absorption band was found, which corresponded to roughly spherical Ag nanoparticles. The cobalt solution causes the absorbance maxima in the Ag nanoparticle solution to blue shift from 420 nm to 405, 260 and 220 nm. The fluorescence peak of the Ag nanoparticles was discovered at about 480 nm. The Ag nanoparticle fluorescence maxima shift from 480 nm to 470 nm upon the addition of cobalt solution. The stimulation of surface plasmon vibrations in the nanoparticle caused the colloidal silver solution to take on its distinctive color, which served as an appropriate spectroscopic signature of their production. The number of particles cannot be connected linearly to the absorbance intensities because the absorbance of the plasmon resonance band relies on particle size, shape, metallic substance and its surrounding environment [31-36].
When NS was doped into the Ag nanoparticles, the absorption wavelength shifted from 420, 250 nm to 419, 263 nm, while the emission shifted from 480 nm and 340 nm to 472, 356, 313 nm. The introduction of β-CD solution into the Ag nanoparticles caused the absorption to red shift to 435 nm and 257 nm, and the emission moved to 472 nm, 359 nm, and 323 nm. When NS/β-CD was added to the Ag nanoparticles, the absorption maxima blue shifted to 410, 280 nm, while the emission shifted to 448, 336, 302 nm.
Upon doping of NS into the Ag/Co nanoparticles, the absorption red shifted from 405, 260 nm to 458, 353, 287 nm and the emission moved from 470, 365, 293 nm to 473, 355, 334 nm. Upon adding β-CD to the Ag/Co nanoparticles, the absorption red shifted to 464, 269 nm while the emission blue shifted to 471, 364, 337 nm. When NS:β-CD was doped into the Ag/Co nanoparticles, the absorption blue shifted to 403, 275 nm and the emission moved to 450, 360, 298 nm. The observed red or blue shifts in both absorption and emission spectra indicate that NS and CD are effectively doped on Ag and Ag/Co nanoparticles.
3.4. FE-SEM and TEM Image Analysis
The powdered forms of silver nano, Ag/Co nano, NS, Ag/NS/β-CD, and Ag/Co/NS/β-CD nanomaterials were examined using FE-SEM and EDAX (Fig. 4). The photographs unmistakably demonstrate the morphologies of the silver nanoparticles and inclusion complex nanomaterials: Ag is shaped like a stone, Ag/Co is like a dull marble stone, NS is shaped like a crystal, Ag/NS/CD inclusion complex is like a crystal, and Ag/Co/NS/CD is like a plate, respectively. This morphology differs from that of the pure NS molecule, as can be seen from the SEM images. According to FE-SEM-EDAX data, (a) Ag nano contains 58.31% silver and 41.69% oxygen. (b) Ag /Co solution contains 44.08% silver, 44.08% cobalt and 17.45% oxygen, c) NS has 53.16% carbon, 28.88% oxygen, 12.48% nitrogen and 5.48% sulphur, (d) The composition of Ag/NS/β-CD is 45% silver, 25% carbon, 15% oxygen, 10% nitrogen and 5% sulphur, (e) Ag/Co/NS/β-CD has a composition of 35% silver, 28% cobalt, 16% carbon, 8% oxygen, 9% nitrogen and 3% sulphur. Changes in the morphologies and composition of the atoms help as evidence that a new Ag/Co nano inclusion complex has formed.
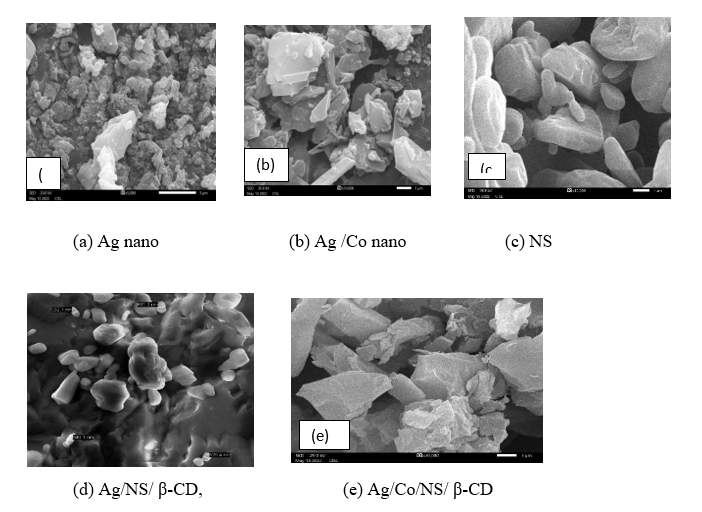
Fig. 4. SEM images for (a) Ag nano, (b) Ag nano/Co solution, (c) NS, (d) Ag/NS/ β-CD, (e) Ag/Co/NS/ β-CD
Fig. 5 displays TEM images of Ag/NS/β-CD and Ag/Co/NS/β-CD. TEM pictures of Ag/NS/β-CD and Ag/Co/NS/β-CD microstructure have showed distinct shape. TEM images of Ag/NS/β-CD and Ag/Co/NS/β-CD revealed the presence of nanotubes with dimensions of 200 nm in length and 51 nm in width. The TEM-EDX findings support the formation of nanoparticles, including: (a) Ag/NS/β-CD, which contains contain 20.83% of silver, 64.25% of carbon, 10.70% of oxygen, 3.83% of nitrogen and 0.39% of sulfur and (b) Ag/Co/NS/β-CD has 7.53% of silver, 0.92% of cobalt, 78.68% of carbon, 10.21% of oxygen, 1.58% of nitrogen and 1.08% of sulfur is present. The existence of Ag, Co, and the NS/CD inclusion complex is confirmed by the EDX spectra of the bimetallic nanoparticles.
3.5. Infrared Spectral Studies
FT-IR spectra of the Ag nano, Ag/Co nano, NS, Ag/NS/β-CD, and Ag/Co/ NS/β-CD are measured. Due to the reduction of Ag+ to Ag0 nanoparticles, FTIR frequencies were found to exhibit the most pronounced peaks at 3289, 2355, 1633, and 699 cm-1 in Ag nanoparticles. Ag/Co nanoparticles also showed the related peaks with frequency variations at 3242, 2435, 1641, and 675 cm-1.
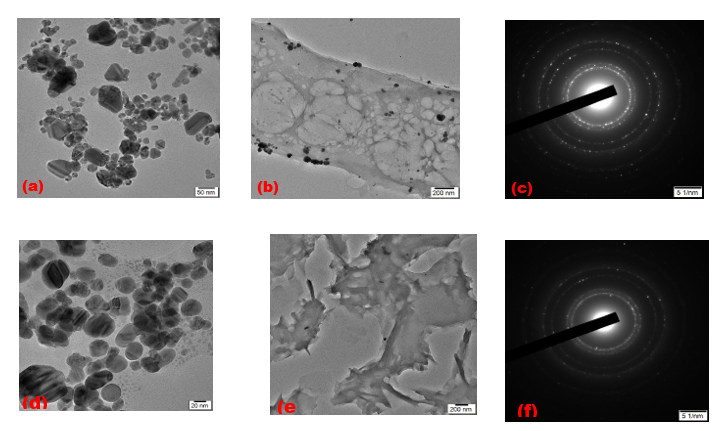
Fig. 5. TEM images for (a-c) Ag/NS/β-CD, (d-f) Ag/Co/NS/β-CD.
The NH frequency in NS, appears at 3275 cm-1 was moved to 3310 and 3305 cm-1 in Ag/NS/β-CD and Ag/Co/NS/β-CD, respectively. The SO2 stretching vibration, of the NS emerges at 1149 cm-1 was moved to 1376 and 1380 cm-1 in Ag/NS/β-CD and Ag/Co/NS/β-CD respectively. The NO2 stretching vibration of the NS shows at 1334 cm-1 was shifted to 1175 and 1179 cm-1 in Ag/NS/β-CD and Ag/Co/NS/β-CD respectively. The aromatic C=C stretching band of NS is seen at 1639 cm-1 displaced to 1637 and 1643 cm-1 in Ag/NS/β-CD and Ag/Co/NS/β-CD respectively. The C-C band in NS is visible at 974 cm-1 displaced to 923 and 928 cm-1, respectively in Ag/NS/β-CD and Ag/Co/NS/β-CD. The CH3 stretching frequency in NS appears at 1440 cm-1 moved to 1458 and 1460 cm-1 in Ag/NS/β-CD and Ag/Co/NS/β-CD respectively. The intensity of the IR frequencies in the Ag/NS/β-CD and Ag/Co/NS/β-CD nanoparticles considerably changed when compared to NS indicating that the NS and CD doped on the metal nanoparticles.
3.6. DSC Thermogram
DSC profiles of pure Ag nano, Ag/Co nano, pure NS, Ag/NS/β-CD and Ag/Co/NS/β-CD are also measured. Each three exothermic peaks noticed in the Ag nano and Ag/Co at 198.8, 250.2, 341.1°C and 180.4, 205.3, 290.3 °C respectively. In NS drug, two exothermic and one endothermic peak can be seen at 315.5, 337.2 °C, and 159.7 °C respectively. In Ag/NS/β-CD, two endothermic and one exothermic peak can be seen at 105.5, 174.5°C, and 305.5°C respectively. In Ag/Co/NS/β-CD, each one endothermic and exothermic peak show at 120.5 °C, and 315.5 °C respectively. The endothermic peaks are caused by the loss of water in CD nanomaterials. In contrast to the isolated NS, a new peak seen in the Ag/NS/β-CD and Ag/Co/NS/β-CD, indicates the formation of the nanomaterials.
3.7. Powder X-Ray Di?ractograms
XRD patterns were used to determine the formation of the nanoparticles. Strong powder peaks for pure Ag nano can be found at 15.04°, 21.70°, 31.91° and 66.58°. These peaks line up with the metallic silver face-centered cubic structure in reflection. Strong powder peaks for Ag/Co nanoparticles were seen at 11.34°, 18.15°, 22.90°, 31.85°, 36.05° and 64.75°. When compared to free NS, XRD pattern of the Ag/NS/β-CD nanomaterials revealed a clear, distinct diffraction pattern (10.38o, 12.27°, 19.26°, 22.45°, 37.81°, 43.67° and 77.08°), indicating the formation of nanomaterials. Peaks found in the Ag/Co/NS/β-CD nanomaterials at 10.15°, 12.20°, 19.15°, 22.58°, 37.75°, 44.01°, 64.14° and 77.06°. The Powder XRD pattern exhibits strong, acute peaks that demonstrate the nanomaterials present in the powder form. The production of metal/NS:CD nanomaterials was further supported by a number of prominent peaks that appeared in the 10° to 80° degree range. The development of new nanomaterials is generally shown by the difference in peak intensities between the corresponding free molecule diffraction patterns and the NS:CD complex diffraction patterns.
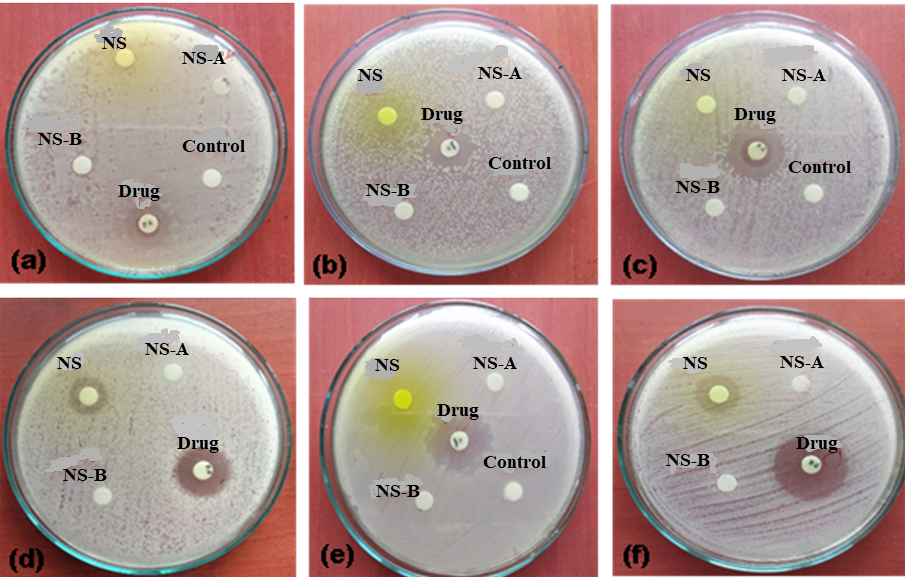
3.8. Antibacterial results
The antibacterial activity of the NS, Ag/NS/β-CD, Ag/Co/NS/β-CD and drug samples was tested against six bacterial pathogens (Fig.6). Escherichia coli (2), Staphylococcus aureus (2) and Salmonella typhi (2) exhibit relatively less activity against the pure isolated NS drug compared to Leucobacteralbus (15), Bacillus subtilis (12), and Bacillus pumilis (18). But according to antibacterial activity results, both Ag/NS/β-CD, and Ag/Co/NS/β-CD are inactive against all the six bacterial pathogens.
3.9 Anticancer Activity of NS
The anticancer activity of NS (ID No. 4495) was analyzed using molecular docking methods, as illustrated in Figs. 7 and 8. Figures A and B display the 3D and 2D interactions between the Epidermal Growth Factor Receptor (EGFR) complex and epiregulin (EREG) (PDB ID: 5WB7). BH interacted with the 1r51 protein, forming a conventional carbon-hydrogen bond with Lys127, alkyl interactions with Arg128, Cys103, and π- carbon interactions with Arg105, Glu126. The LibDock score for this interaction is approximately 65.01. For the 2oh4 protein, NS formed conventional hydrogen bond with Asp1026, Ala1048, Leu1047 and alkyl interactions with Ala1063, Ile1051. The LibDock score for this interaction is around 81.67.
Using the AutoDock method, several ADMET parameters were evaluated for NS drug; the solubility level is approximately 3 (indicating absorption-distribution-metabolism-excretion-toxicity processes), the blood-brain barrier (BBB) level is around 3 (reflecting the properties of central nervous system vasculature), and hepatotoxicity applicability is noted at MD ~11.7105. Hepatotoxicity refers to liver injury caused by drugs or herbal compounds and can be challenging to diagnose. Further, ADMET EXT CYP2D6 predictions indicates false result, while ADMET EXT Hepatotoxicity prediction is true, and ADMET EXT Plasma Protein Binding (PPB) prediction is true. PPB measures the unbound fraction of siRNA in plasma at equilibrium and is crucial for small molecule regulatory filings due to its implications for drug concentration at the site of action. Overall, these results suggest that NS exhibits anticancer activity against both the 1r51 and 2oh4 proteins.
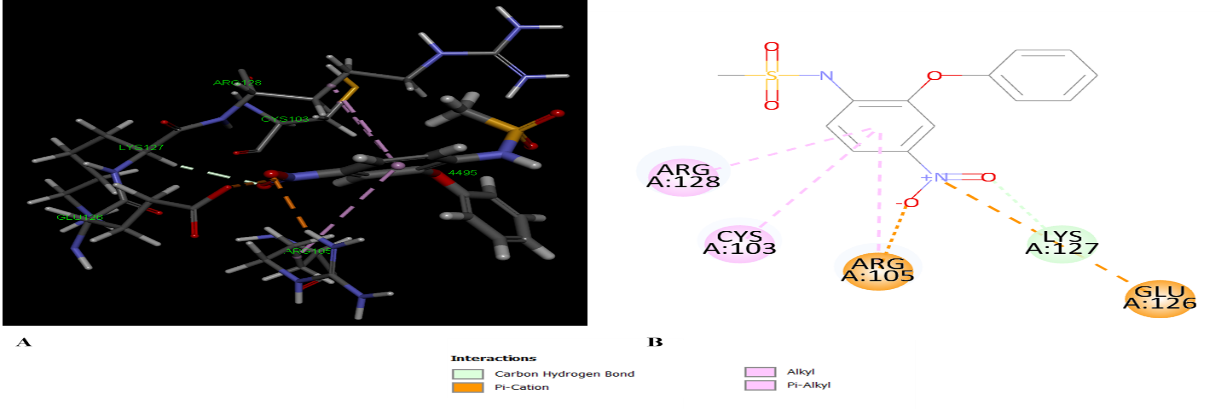
Fig. 7. Anticancer activity of NS (ID No. 4495) with 1r51 amino acid residues.
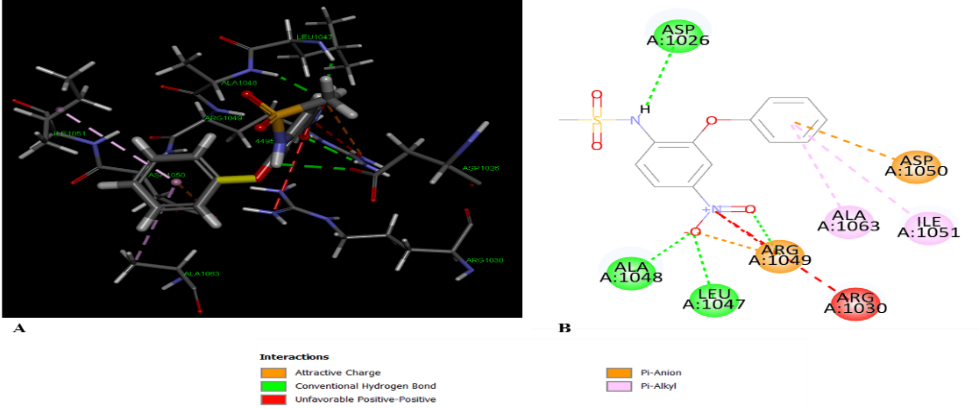
Fig. 8. Anticancer activity of NS with 2oh4 amino acid residues.
CONCLUSION
Different spectral, SEM, TEM and computational techniques were used to synthesize and analyze the Ag/NS/β-CD and Ag/Co/NS/β-CD nanomaterials. According to all experimental data spectral and microscopic variations appeared when NS:CD doped on the Ag and Ag/Co nanoparticles. Marble stones like images were seen in SEM whereas in TEM nanotubes images were seen in Ag/NS/β-CD and Ag/Co/NS/β-CD. Antibacterial activity results shows both nano and NS drug are inactive against all six bacterial pathogens. Molecular docking analysis confirmed NS drug have anticancer activity against 1r51 and 2oh4 proteins.
This work was supported by the Rashtriya Uchchatar Shiksha Abhiyan (RUSA) Phase -2.0 [No. 128/A1/ RUSA 2.0, Health and Environment] New Delhi, India. One of the authors, A.Mani is thankful to the RUSA, New Delhi, India for the award of JRF fellowship.
Conflict of interests: The authors declare that they have no conflict of interest.
Ethical approval: All ethical guidelines have been adhered.
CRediT authorship contribution statement

Methodology: Formal Analysis; Investigation: Data Curation: PM3 Software: Ayyadurai Mani
Antibacterial activity; Anticancer activity : Poomalai Senthilraja
Resources: Validation: Conceptualization: Writing - Original Draft: Review and Editing: Supervision: Narayanasamy Rajendiran
REFERENCES


Ayyadurai Mani, Poomalai Senthilraja, Narayanasamy Rajendiran, Spectral, microscopic, anticancer activity of silver and silver/cobalt-doped nanoparticle with nimesulide drug, Int. J. of Pharm. Sci., 2026, Vol 4, Issue 3, 2521-2532. https://doi.org/10.5281/zenodo.19148434
 10.5281/zenodo.19148434