Channabasweshwar Pharmacy College (Degree), Latur 413512 Maharashtra, India.
A rapid, sensitive, specific, and stability-indicating RP-HPLC method was developed for the quantification of Evogliptin in tablet dosage forms. Chromatographic separation was achieved using Altima C18 (4.6 × 150 mm, 5 µm) column with a mobile phase of 0.01N KH2PO4 and acetonitrile in the ratio of 60:40 v/v. The flow rate was 1.0 mL/min, and detection was carried out at 234 nm. The retention time of Evogliptin was 2.802 minutes. The method was validated as per ICH Q2(R1) guidelines and showed excellent linearity (5–30 µg/mL), accuracy (99.30%), and precision (%RSD < 2%). The LOD and LOQ were 0.24 and 0.73 µg/mL, respectively. The method was found to be robust and specific and can be employed for routine quality control and stability analysis of Evogliptin in pharmaceutical dosage forms. Index Terms— Evogliptin, Method Development, RP-HPLC, Validation.
Evogliptin is a DPP-4 inhibitor used in the management of type 2 diabetes mellitus. Developing a reliable and validated analytical method for quantifying Evogliptin is crucial for ensuring quality control of its formulations. This study aimed to develop a stability-indicating RP-HPLC method that can detect Evogliptin even in the presence of its degradation products.
Drug Profile
Drug Name: Evogliptin
|
|
Pharmacokinetic Parameters |
|
|
1. |
Elimination Half Life |
32.5 to 39.8 hours |
|
|
Chemical and Physical Data |
|
|
|
Formula |
C19H26F3N3O |
|
|
Molar Mass |
401.42 mol−1 |
|
|
Melting Point |
208-213 °C (293 to 298 °F) |
|
|
Solubility |
0.11 mg/mL in water |
|
|
Storage |
at -20° c |
|
|
Physical state |
Solid, white powder |
|
|
pKa value predicted |
13.69 |
Structure:
II. MATERIALS AND METHODS:
Reagents and Chemicals:
Evogliptin API, HPLC-grade acetonitrile, KH2PO4 buffer and water were used.
Instrumentation and Chromatographic Conditions:
Chromatographic separation was performed using Altima C18 column (150 × 4.6 mm, 5 µm). The mobile phase comprised 0.01N KH2PO4 and acetonitrile in a 60:40 v/v ratio. The flow rate was maintained at 1.0 mL/min. The detection wavelength was 234 nm, with a column temperature of 30°C.
Preparation of Standard and Sample Solutions:
Stock solution of Evogliptin (200 µg/mL) was prepared and further diluted to obtain working standards (5–30 µg/mL). Sample solutions were prepared from tablets equivalent to 5 mg of Evogliptin per tablet.
Method Validation Parameters:
The method was validated for system suitability, linearity, accuracy, precision, LOD, LOQ, specificity, robustness, and forced degradation studies according to ICH Q2(R1).
III. RESULTS AND DISCUSSION:
System Suitability:
According to ICH guidelines plate count should be more than 2000, tailing factor should be less than 2 and resolution must be more than 2. All the system suitable parameters were passed and were within the limits.
|
Peak |
Evogliptin |
||
|
Inj. |
RT (min) |
USP Plate Count |
Tailing Factor |
|
1 |
2.884 |
3025 |
1.37 |
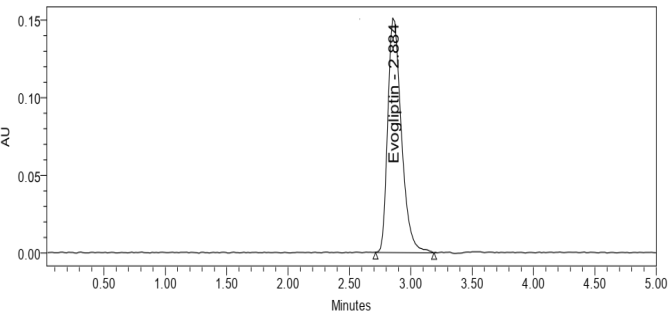
Figure 1: System suitability Chromatogram
Specificity: Retention times of Evogliptin were 2.802 min. We did not found and interfering peaks in blank and placebo at retention times of these drugs in this method. So this method was said to be specific.
Repeatability:
Table: 1 Repeatability Table of Evogliptin
|
Sr. No |
Peak Area of Evogliptin |
|
1. |
750659 |
|
2. |
744212 |
|
3. |
740982 |
|
4. |
753452 |
|
5. |
743546 |
|
6. |
749423 |
|
Mean |
748046 |
|
S.D. |
5059 |
|
%RSD |
0.68 |
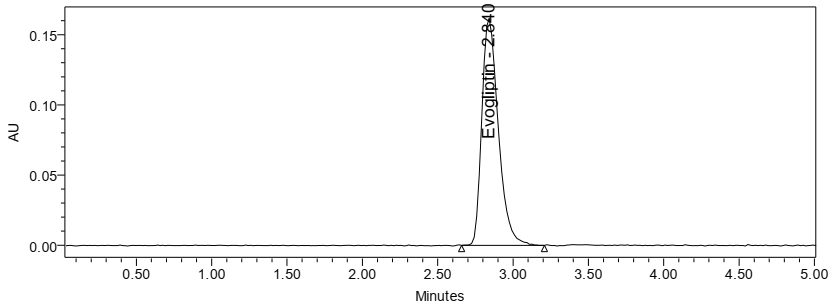
Figure: 2 Repeatability Chromatogram
Precision:
System Precision:
Table: 2 System Precision Table of Evogliptin
|
Sr. No |
Peak Area of Evogliptin |
|
1. |
748266 |
|
2. |
758578 |
|
3. |
753143 |
|
4. |
740264 |
|
5. |
755393 |
|
6. |
755393 |
|
Mean |
752840 |
|
S.D. |
6725 |
|
%RSD |
0.9 |
Intermediate precision (Inter-day Precision):
Table: 3 Intermediate Precision Table of Evogliptin
|
Sr. No |
Peak Area of Evogliptin |
|
1. |
743937 |
|
2. |
731128 |
|
3. |
735403 |
|
4. |
731454 |
|
5. |
734604 |
|
6. |
736749 |
|
Mean |
735546 |
|
S.D. |
4669.6 |
|
%RSD |
0.6 |
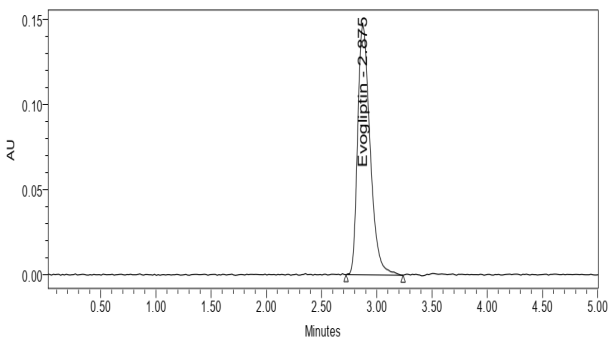
Figure: 3 Intermediate Precision Table of Evogliptin
Linearity:
Table: 4 Linearity Data for Evogliptin
|
Evogliptin |
|
|
Conc. (μg/ml) |
Peak Area |
|
0 |
0 |
|
5 |
190311 |
|
10 |
395411 |
|
15 |
580801 |
|
20 |
759604 |
|
25 |
955241 |
|
30 |
1154717 |
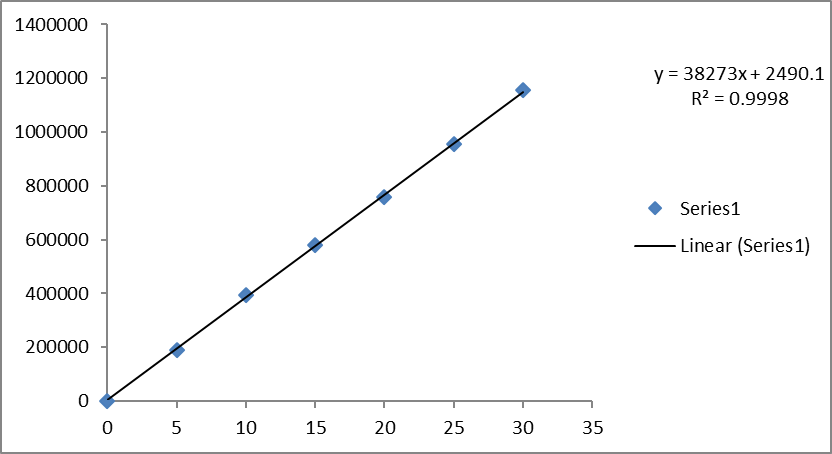
Figure: 4 Calibration curve of Evogliptin
Robustness:
Table: 5 Robustness Data for Evogliptin
|
Sr. No. |
Condition |
Standard |
%RSD of Evogliptin |
|
1. |
Flow Rate increased 0.9ml/min |
-0.1ml/min |
1.2 |
|
2. |
Flow Rate Increased 1.1ml/min |
+0.1ml/min |
0.3 |
|
3. |
Mobile phase KH2PO4 : ACN |
+5 |
0.4 |
|
4. |
Mobile phase (+) KH2PO4 : ACN |
-5 |
0.2 |
|
5. |
Temperature (-) 27°C |
-3°C |
0.4 |
|
6. |
Temperature (+) 33°C |
+3°C |
1.3 |
Limit of quantification (LOQ) and Limit of detection (LOD)
LOD and LOQ were calculated based on the standard deviation of the response and the slope of the regression equation. As observed, the LOD and LOQ of Evogliptin were 0.24 and 0 μg/ml.
Accuracy:
Three levels of Accuracy samples were prepared by standard addition method. Triplicate injections were given for each level of accuracy and mean %Recovery was obtained as 99.30% for Evogliptin.
Table: 6 Accuracy Table of Evogliptin
|
% Level |
Amount Spiked (μg /ml) |
Amount recovered (μg /ml) |
% Recovery |
Mean %Recovery (98-102%) |
|
50% |
10 |
9.97 |
99.75 |
99.30% |
|
10 |
9.98 |
99.82 |
||
|
10 |
9.93 |
99.32 |
||
|
100% |
20 |
20.01 |
100.05 |
|
|
20 |
20.21 |
101.05 |
||
|
20 |
19.68 |
98.40 |
||
|
150% |
30 |
29.57 |
98.57 |
|
|
30 |
29.48 |
98.27 |
||
|
30 |
29.54 |
98.47 |
Forced Degradation Studies:
The formulation was tested under degradation conditions and the degraded samples were injected. The assay results were within acceptable limits, indicating all samples passed.
Table: 7 Degradation Data of Evogliptin
|
Sr. No. |
Degradation Condition |
%Drug Degraded |
%Drug Un-Degraded |
|
1. |
Acid |
2.40 |
97.60 |
|
2. |
Base |
2.85 |
97.15 |
|
3. |
Oxidation |
4.51 |
95.49 |
|
4. |
Thermal |
2.43 |
97.57 |
|
5. |
UV |
1.93 |
98.07 |
|
6. |
Water |
2.47 |
97.53 |
IV. CONCLUSION
Retention times were decreased and that run time was decreased, so the method developed was efficient that can be adopted in regular Quality control test in day-to-day analysis.
REFERENCES


Sarita Mohite, Pratik Lomate, Amol Naragude*, Stability-Indicating Analytical Method Development and Validation for Evogliptin in Pharmaceutical Dosage Form, Int. J. of Pharm. Sci., 2025, Vol 3, Issue 7, 842-848. https://doi.org/10.5281/zenodo.15828149
 10.5281/zenodo.15828149
