Calcutta Institute of Pharmaceutical Technology & Allied Health Sciences
The simple and rapid spectrophotometric technique has been developed to measure and validate the absorbance of antidepressant drug fluoxetine hydrochloride. This study's objective is to use UV spectroscopy to precisely and accurately estimate the maximum wavelength of the bulk drug and the pH at which the bulk drug exhibits the highest absorbance. According to Beer’s law concentration range of bulk drug and sample is 2-20µg/ml in buffer at pH 1.2, 6.8 and 7.4 respectively. The ?max of the bulk drug is 226nm. The linear regression equations of bulk drug were determined to be y = 00.0463x + 00.0602, y = 00.0417x + 00.0749, y = 00.0408x + 00. 0015 and for the marketed formulation found to be y = 00.0412x + 00.0825, y = 00.0386x + 00.0829, y = 00.0374x + 00.0816 in 1.2, 6.8 and 7.4 pH buffer respectively. The regression coefficient of each and every equation were found to be above 00.995 which denoted that all equations were following linearity.
Fluoxetine hydrochloride is a second-generation antidepressant drug that is classified as a selective serotonin reuptake inhibitor (SSRI). It regulates by growing the quantity of a biological chemical called serotonin in the brain. [1]. It was initially developed to treat depression, but since receiving FDA approval in 1987, it is now often used to treat depression and several other conditions. Major depressive disorder, bulimia and bipolar I’ are all treated with this SSRI. ‘N-methyl-3-phenyl-3-[4-(trifluoromethyl) phenoxy] propan-1-amine; hydrochloride’ is the IUPAC name of fluoxetine hydrochloride, which has the molecular formula ‘C17H19ClF3NO’ with a molecular weight of ‘345.8 g/mol’. It is essentially a crystalline solid that ranges from white to off white. Fluoxetine hydrochloride is freely soluble in methanol and ethanol [2]. Fluoxetine causes prolonged amounts of 5-HT in particular areas of the brain by blocking the serotonin reuptake transporter at the presynaptic terminal. Though, because to its comparatively low affinity for 5-HT, ‘dopaminergic, adrenergic, cholinergic, muscarinic, and histamine receptors’, FLU has a far more satisfactory adverse effect profile than previously identified classes of antidepressants, such as tricyclic antidepressant [3].
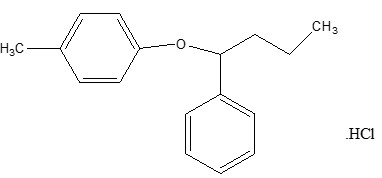
Fig 1: Structure of Fluoxetine hydrochloride
MATERIALS AND METHODS
Materials
A gift sample of pure fluoxetine hydrochloride was received from institute. Loba Chemie Pvt. Ltd. was the supplier of ‘potassium dihydrogen phosphate, potassium chloride, sodium hydroxide, sodium chloride, and hydrochloric acid’ (HCl). Every additional chemical and reagent employed in the investigation was of analytical grade. Prodep (sun pharma) the marketed product of fluoxetine hydrochloride (label claimed 20 mg) was purchased from local market.
Equipment’s
UV-visible spectroscopy (Shimadzu 1900i) was used with ‘1 cm path length quartz cell’, analytical weighing balance, and ultrasonic bath sonicator were used in this study.
Preparation of buffer solution
For the preparation of 1000 ml 6.8 pH phosphate buffer take ‘28.80 gm disodium hydrogen phosphate and 11.5 gm of potassium dihydrogen phosphate’ dissolved into few amounts of distilled water. Then take the 1000ml volumetric flask and pour it into the volumetric flask and make up the volume upto 1000ml [4].
For the preparation of 1000ml 7.4 pH phosphate buffer take ‘2.38gm disodium hydrogen phosphate, 0.19gm potassium dihydrogen phosphate and 8gm sodium chloride’ and mixed into few quantities of distilled water. Then take 1000ml volumetric flask and pour the solution into volumetric flask and make up the volume upto 1000ml [4,5].
For the preparation of 1000ml 1.2 pH HCl buffer take ‘2gm sodium chloride in water and add 7.0 ml HCl’ with it. Then take 1000ml volumetric flask and pour the solution into it and adjust the volume upto 1000ml[5,6].
Preparation of standard solution
After weighing 10 mg of fluoxetine hydrochloride bulk drug, the sample's stock solution was made by dissolving it in 9:1(buffer: methanol) ratio of HCl and phosphate buffer solutions with a pH level of 1.2, 6.8, and 7.4, respectively and methanol. Each buffer solution's aliquot sample (10 mL) was placed in a volumetric flask, diluted to 10 mL to provide a concentration range of ‘2–20 mcg/ml’, and its corresponding wavelength was examined.
Preparation of sample solution
Triturate and crushed the ten tablets of fluoxetine hydrochloride in fine powder. 10mg equivalent tablet powder was weighed. Then the sample was prepared by dissolving the drug into solvent in 9:1 ratio (buffer: methanol). In this process prepared the sample in the concentration range of 2 to 20µg/ml. Filtered the sample by whatman filter paper and measure the absorbance of sample at 226nm.
Validation of method
By analyzing linearity, accuracy, limit of detection, and limit of quantification according with the International Council for Harmonization's guidelines, the side-by-side equation approach was verified [7].
Linearity
Buffer solution at pH 1.2, 6.8, and 7.4 was used to make up the volume after 1.6, 1.8, and 2.0 ml of solution were shifted from the stock solution to separate 10 ml of the volumetric flask. Fluoxetine hydrochloride concentrations ranged from 2 to 20 mcg/ml [8].
Precision
The precision takes into account how closely a set of results determined by examining several samples of a single analyte agree with one another. ‘Repeatability’ (system precision) and ‘intermediate’ (method precision) investigations confirmed the approach's accuracy. To determine the technique precision, the system precision investigation was conducted by replicating the absorbance of fluoxetine hydrochloride three times on the same day and on separate days [9].
LOD and LOQ
The lowest analyte concentration in a sample that may be identified but is typically not measured is known as the limit of detection, or LOD. Equations i & ii were used to compute LOD and LOQ [10]. LOD=3.3 ×IS
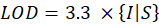
LOQ=10 ×IS
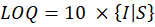
Where, I is the standard deviation of intercept and S is mean value of slope.
Result And Discussion:
Major depressive disorder, bulimia, panic disorder, and bipolar I are all treated with fluoxetine hydrochloride, a selective serotonin reuptake inhibitor. According to reports, the UV Spectroscopy approach makes it feasible to estimate fluoxetine hydrochloride significantly. This method's accurate, precise, and selective approach to fluoxetine hydrochloride measurement has been successful.
The absorption spectra for fluoxetine hydrochloride showed a maximum absorbance at 226nm wavelength in different pH. So, the absorbance of fluoxetine hydrochloride in different pH was checked at 226nm of maximum wavelength. For the bulk drug, the linearity was found to be between 2 and 20 mcg/ml.
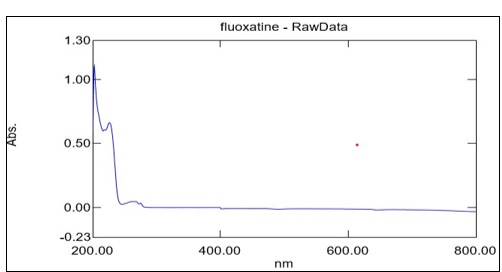
Fig 2: Determination of ?max of fluoxetine hydrochloride
Quantification of unknown materials using an equipment such as a UV spectrophotometer. The absorbance of fluoxetine hydrochloride bulk in different concentration was determined in different pH. Calibration curve was performed three times and the mean values ± standard deviation was reported as shown in Table 1 & Table 2.
Table 1: Calibration data of fluoxetine hydrochloride bulk drug in different pH
|
Sr. No. |
Concentration |
|
Absorbance |
|
|
|
|
pH 1.2 |
pH 6.8 |
pH 7.4 |
|
1 |
2 |
0.146 ± 0.004 |
0.166 ±0.008 |
0.085 ±0.007 |
|
2 |
4 |
0.239 ±0.006 |
0.237 ±0.005 |
0.164 ±0.008 |
|
3 |
6 |
0.345 ±0.006 |
0.316 ±0.009 |
0.253 ±0.004 |
|
4 |
8 |
0.437 ±0.002 |
0.405 ±0.004 |
0.337 ±0.006 |
|
5 |
10 |
0.529 ±0.009 |
0.489 ±0.004 |
0.401 ±0.003 |
|
6 |
12 |
0.621 ± 0.007 |
0.584 ±0.009 |
0.485 ±0.008 |
|
7 |
14 |
0.709 ±0.008 |
0.659 ±0.004 |
0.566 ±0.008 |
|
8 |
16 |
0.795 ± 0.008 |
0.751 ±0.006 |
0.647 ±0.006 |
|
9 |
18 |
0.888 ±0.005 |
0.828 ±0.006 |
0.730 ±0.002 |
|
10 |
20 |
0.989 ±0.003 |
0.897 ±0.007 |
0.837 ±0.005 |
Table 2: data of Fluoxetine hydrochloride marketed formulation
|
Sr. No. |
Concentration |
|
Absorbance |
|
|
|
|
pH 1.2 |
pH 6.8 |
pH 7.4 |
|
1 |
2 |
0.173 ± 0.001 |
0.160 ± 0.002 |
0.160 ± 0.002 |
|
2 |
4 |
0.243 ± 0.003 |
0.241 ± 0.002 |
0.228 ± 0.006 |
|
3 |
6 |
0.328 ± 0.002 |
0.310 ± 0.005 |
0.308 ± 0.002 |
|
4 |
8 |
0.409 ± 0.005 |
0.394 ± 0.003 |
0.381 ± 0.001 |
|
5 |
10 |
0.489 ± 0.002 |
0.469 ± 0.001 |
0.448 ± 0.005 |
|
6 |
12 |
0.579 ± 0.003 |
0.543 ± 0.002 |
0.531 ± 0.001 |
|
7 |
14 |
0.655 ± 0.001 |
0.619 ± 0.006 |
0.604 ± 0.001 |
|
8 |
16 |
0.748 ± 0.001 |
0.708 ± 0.001 |
0.698 ± 0.001 |
|
9 |
18 |
0.833 ± 0.006 |
0.789 ± 0.001 |
0.748 ± 0.003 |
|
10 |
20 |
0.899 ± 0.004 |
0.846 ± 0.002 |
0.828 ± 0.002 |
For the bulk drug and the marketed formulation, the linearity was found to be between 2 to 20 mcg/ml. Fig 2 & Fig 3 displays the calibration curves. The linear regression equations for bulk drug were found to be y = 00.0463x + 00.0602, y = 00.0417x +00.0749, y = 00.0408x + 00.0015 and for the marketed formulation found to be y = 00.0412x + 00.0825, y = 00.0386x + 00.0829, y = 00.0374x + 00.0816 in 1.2, 6.8 and 7.4 pH buffer respectively. “The correlation coefficient” (r2) value of the bulk drug was detected to be 0.999, 0.999, 0.998 and for marketed formulation was detected to be 0.9994, 0.9993, 0.999 in 1.2, 6.8 and 7.4 pH buffer solution respectively.
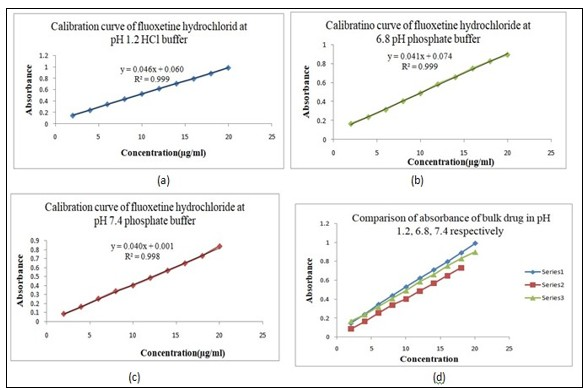
Fig 3: Calibration curve of bulk drug in different pH
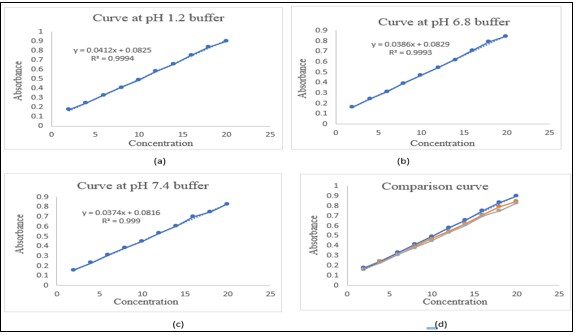
Fig 4: Absorbance vs concentration curve of marketed formulation in different pH
According to Table 3 & Table 4, the relative standard deviation for 3 reproduces was less than 2% for both bulk drug & marketed formulation and system precision. At varying pH values, the LOD and LOQ results displayed in Table 5 were determined to be satisfactory.
Table 3: Systems precision data for bulk drug fluoxetine hydrochloride.
|
Sr. No. |
Absorbance |
At pH |
1.2 |
Absorbance |
at pH |
6.8 |
Absorbance |
at pH |
7.4 |
|
|
1 |
2 |
3 |
1 |
2 |
3 |
1 |
2 |
3 |
|
1 |
0.798 |
0.805 |
0.790 |
0.654 |
0.680 |
0.678 |
0.564 |
0.570 |
0.568 |
|
2 |
0.785 |
0.795 |
0.788 |
0.660 |
0.673 |
0.661 |
0.575 |
0.578 |
0.559 |
|
3 |
0.802 |
0.789 |
0.804 |
0.663 |
0.684 |
0.673 |
0.559 |
0.569 |
0.574 |
|
µ |
0.795 |
0.796 |
0.794 |
0.659 |
0.679 |
0.670 |
0.566 |
0.572 |
0.567 |
|
SD |
0.008 |
0.008 |
0.008 |
0.004 |
0.005 |
0.008 |
0.008 |
0.004 |
0.007 |
|
%RSD |
1.00 |
1.00 |
1.00 |
0.60 |
0.73 |
1.19 |
1.40 |
0.69 |
1.23 |
Table 4: Systems precision data for marketed drug fluoxetine hydrochloride.
|
Sr. No. |
Absorbance |
at pH |
1.2 |
Absorbance |
at pH |
6.8 |
Absorbance |
at pH |
7.4 |
|
|
1 |
2 |
3 |
1 |
2 |
3 |
1 |
2 |
3 |
|
1 |
0.748 |
0.749 |
0.749 |
0.706 |
0.701 |
0.703 |
0.696 |
0.699 |
0.701 |
|
2 |
0.750 |
0.751 |
0.750 |
0.709 |
0.698 |
0.701 |
0.701 |
0.710 |
0.697 |
|
3 |
0.746 |
0.753 |
0.753 |
0.709 |
0.699 |
0.706 |
0.697 |
0.706 |
0.703 |
|
µ |
0.748 |
0.751 |
0.750 |
0.708 |
0.699 |
0.703 |
0.698 |
0.705 |
0.700 |
|
SD |
0.001 |
0.001 |
0.001 |
0.001 |
0.001 |
0.001 |
0.001 |
0.003 |
0.002 |
|
%RSD |
0.133 |
0.133 |
0.133 |
0.141 |
0.143 |
0.142 |
0.143 |
0.425 |
0.285 |
Table 5: Detection and quantification data of fluoxetine hydrochloride
|
pH |
Brand Name |
LOD (µg/ml) |
LOQ (µg/ml) |
|
1.2 |
API Prodep |
0.358 0.160 |
1.08 0.485 |
|
6.8 |
API Prodep |
0.48 0.170 |
1.46 0.518 |
|
7.4 |
API Prodep |
0.40 0.176 |
1.13 0.534 |
CONCLUSION
The ?max of fluoxetine hydrochloride is 226 nm, according to the study mentioned above. The highest absorbance of the bulk drug was found in1.2 in a pH HCl acetic buffer. Additionally, the suggested approach is cost-effective, sensitive, accurate, simple, and precise. In addition, this developed method is appropriate for everyday laboratory work.
List of Abbreviations
SSRI: Selective serotonin reuptake inhibitor
FLU HCl: Fluoxetine hydrochloride
5-HT: 5-hydroxytryptamine
HCl: Hydrochloric acid
LOD: Limit of detections
LOQ: Limit of quantifications
µ: mean
SD: Std. deviation
% RSD: Percentage of relative std. deviation
ACKNOWLEDGEMENT
Authors are thankful to our respected Principal sir, Prof. (Dr.) V. P. Ramachandran, Vice- Principal sir Prof. (Dr.) Subhabrota Majumdar of Calcutta Institute of Pharmaceutical Technology & Allied Health Science, Howrah, India.
Authors’ contributions
We affirm that the writers listed in this article completed this research work. Dr. Subhabrota Majumdar: conceptualization, methodology, formal analysis and Banhishikha Kar: contributed to the supervision, writing review, and editing the project. Dipannita Naskar has contributed to writing of original draft preparation also formatted and removed typological errors from the manuscript.
Availability of data and materials
Not applicable.
Funding
This research article received no external funding.
Ethics approval and consent to participate
Not applicable.
Consent for publication
Not applicable.
Competing interests
The authors declare that they have no competing interests.
REFERENCES

Dipannita Naskar, Dr. Subharota Majumdar, Banhishikha Kar, UV Spectrophotometric Method Development and Validation for the Determination of Fluoxetine Hydrochloride in Bulk Drug and Commercial Formulation, Int. J. of Pharm. Sci., 2025, Vol 3, Issue 5, 4827-4834. https://doi.org/10.5281/zenodo.15547480
 10.5281/zenodo.15547480
