
We use cookies to ensure our website works properly and to personalise your experience. Cookies policy
Faculty Of Pharmacy, Chhatrapati Shivaji Maharaj University, Navi Mumbai, Panvel, Maharashtra, India 410221
Caffeic acid, a naturally occurring polyphenolic compound with notable antioxidant, antibacterial, and anti-inflammatory properties, is found in a wide range of plant-based foods and beverages. This study aimed to develop and validate a UV spectrophotometric method for the quantitative estimation of caffeic acid and apply it to various food samples, including coffee, clove, cinnamon, kokum, and Tamarind. A calibration curve was constructed using standard solutions of caffeic acid measured at 325 nm, and the method was validated according to ICH and other regulatory guidelines for parameters such as linearity, precision, accuracy, limit of detection (LOD), and limit of quantification (LOQ). The method exhibited excellent linearity, precision (%RSD < 1%), and recovery (95.8–105.5%). Further, extraction efficiency was compared under different conditions—boiling, warm water incubation, and cold soaking—revealing that boiling led to the highest extraction of caffeic acid. Coffee showed the highest content among all samples. The validated method proves to be simple, cost-effective, and suitable for routine caffeic acid analysis in food matrices.
Caffeic acid (3,4-dihydroxycinnamic) is widely distributed in plant tissues, and it is one of the hydroxycinnamate and phenylpropanoid metabolites. This polyphenol is present in many food sources, including blueberries, coffee drinks, cider, and apples [1]. It is well-known for having antibacterial, anti-inflammatory, and antioxidant qualities. It is also important for human health and plant defense systems. Because of its bioactive potential, it is frequently used in cosmetics, pharmaceuticals, and functional foods. The quantification of caffeic acid in food products and herbal formulations is essential for quality control, nutritional labeling, and pharmacological studies [2]. Among the various analytical techniques available, UV-Visible spectrophotometry stands out as a cost-effective, simple, and reliable method suitable for routine analysis, especially in settings lacking access to advanced instrumentation like HPLC or LC-MS. Caffeic acid exhibits strong absorbance in the UV region due to the presence of conjugated double bonds and phenolic hydroxyl groups, which allow its detection at specific wavelengths (typically around 320–330 nm) [3]. The development of a validated UV spectrophotometric method offers a convenient approach for both qualitative and quantitative analysis of caffeic acid in diverse food matrices [4]. This study aims to develop and validate a UV spectrophotometric method for the estimation of caffeic acid and apply it to the analysis of various food samples, including coffee, fruit juices, to evaluate their polyphenolic content.
METHODS AND MATERIALS
Caffeic acid (CA) standard was procured from Yucca Chemicals. UV-Visible spectrophotometric analysis was performed using an Alpha chemika double beam digital spectrophotometer, employing quartz cuvettes with a 1 cm optical path length, maintained at a temperature of 25 ± 1°C. An accurately weighed quantity of 0.35 mg of caffeic acid was transferred into a 10 mL volumetric flask. The volume was made up using a mixture of ethanol and distilled water in the ratio 1:9 (v/v) to prepare a stock solution. From this stock solution, 8 replicate samples were prepared by pipetting appropriate aliquots into separate 10 mL volumetric flasks. Each flask was then diluted to volume with the same ethanol: distilled water (1:9) solvent system to obtain a series of working standard solutions with different concentrations suitable for calibration. Distilled water was used as the blank solution to calibrate the spectrophotometer [5]. The absorbance of each replicate was recorded at 325 nm, the λmax of caffeic acid, against the blank. The objective of the analytical procedure should be clearly understood since this will govern the validation characteristics which need to be evaluated. Typical validation characteristics which should be considered are listed below:
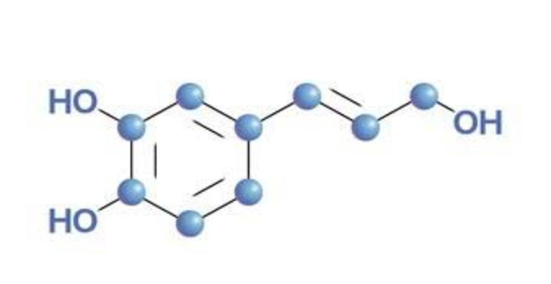
Fig 1. Structure of caffeic acid
METHOD VALIDATION
The method was validated according to the parameters established in guidelines as Brazil, 2003; FDA, 2004; ICH, 2005; INMETRO, 2011 [6,7]
RESULT AND DISCUSSION
LINEARITY
The linearity was obtained through analysis of three analytical curves on three different days.
Table 1. Linearity of caffeic acid
|
Concentration |
Absorbance |
Absorbance (μg/mL) |
Absorbance |
|
|
Day 1 |
Day 2 |
Day 3 |
|
0.2 0.3 0.4 0.5 0.6 0.7 0.8 |
0.209 0.316 0.433 0.543 0.648 0.761 0.875 |
0.211 0.317 0.432 0.541 0.659 0.766 0.870 |
0.210 0.319 0.430 0.544 0.654 0.765 0.879 |
PRECISION
The method's precision was tested for repeatability and intermediate precision tests.
REPEATABILITY
The repeatability was determined by analysis of seven solutions of CA in a concentration of 5 μg/mL prepared on the same day.
% RSD = 0.55%
Table 2: repeatability of caffeic acid
|
Concentration |
Absorbance |
|
0.4 0.4 0.4 0.4 0.4 |
0.431 0.435 0.432 0.436 0.430 0.434 |
INTERMEDIATE PRECISION
Three different days with the same concentration of 0.4 in 6 replicates repeated
Table 3: Intermediate Precision Of Caffeic Acid
|
Day 1 |
Day 2 |
Day 3 |
|||
|
Conc. (μg/mL) |
Abs. (μg/mL) |
Conc. (μg/mL) |
Abs. (μg/mL) |
Conc. (μg/mL) |
Abs. (μg/mL) |
|
0.4 |
0.431 |
0.4 |
0.437 |
0.4 |
0.429 |
|
0.4 |
0.435 |
0.4 |
0.434 |
0.4 |
0.432 |
|
0.4 |
0.432 |
0.4 |
0.439 |
0.4 |
0.428 |
|
0.4 |
0.436 |
0.4 |
0.436 |
0.4 |
0.431 |
|
0.4 |
0.430 |
0.4 |
0.435 |
0.4 |
0.430 |
|
0.4 |
0.434 |
0.4 |
0.438 |
0.4 |
0.427 |
|
% RSD |
0.55% |
% RSD |
0.44% |
% RSD |
0.44% |
ACCURACY
Accuracy was determined using nine determinations across the linear concentration range of the method. Three concentrations—low (0.2 µg/mL), medium (0.5 µg/mL), and high (0.8 µg/mL)—were selected, with three replicate readings at each level. Accuracy was expressed as the ratio between the mean experimentally determined concentration and the corresponding theoretical concentration, and results were reported as percent recovery using the following formula:
Low, Medium, and High Conc. have been taken as 0.2, 0.5, and 0.8, respectively.
Table 4: Accuracy Of Caffeic Acid
|
LOW Conc. (μg/mL) |
MEDIUM Conc. (μg/mL) |
HIGH Conc. (μg/mL) |
|||
|
Conc. |
Abs. |
Conc. |
Abs. |
Conc. |
Abs. |
|
0.2 |
0.208 |
0.5 |
0.540 |
0.8 |
0.871 |
|
0.2 |
0.209 |
0.5 |
0.543 |
0.8 |
0.875 |
|
0.2 |
0.211 |
0.5 |
0.547 |
0.8 |
0.8 |
|
Accuracy % |
95.8% |
Accuracy % |
105.5% |
Accuracy % |
105.5% |
LIMIT OF DETECTION AND QUANTIFICATION
The detection and quantification limits of the method were calculated using the formula described in the literature, based on the standard deviation of the intercept (σ) and the slope (IC) of the analytical calibration curve. The calculations were performed according to the following equations:
LOD = 3.3 × (σ / IC)
LOQ = 10 × (σ / IC)
Where:
σ = standard deviation of the intercept
IC = slope of the analytical curve
σ=Standard Deviation
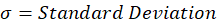
S = Slope
LOD =3.3 x σS

LOD = 3.3 x (0.11451.1136


Limit of Quantification
σ = Standard Deviation
S= Slope
LOQ = 10 x (σs)


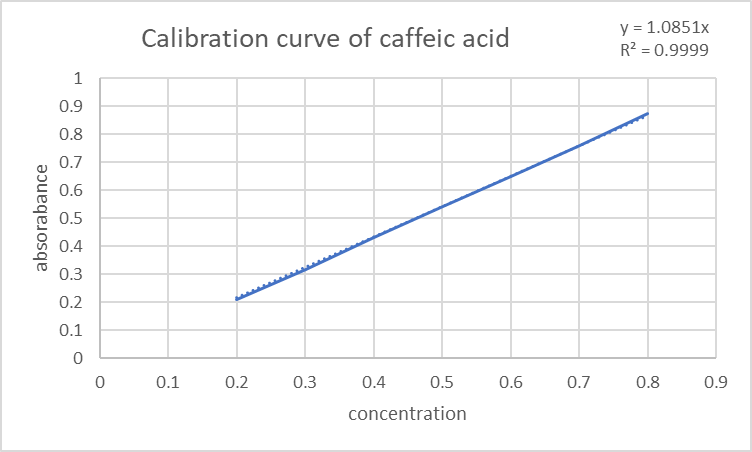
Fig 3: Calibration Curve Of Caffeic Acid
ESTIMATION OF CAFFEIC ACID IN FOOD SAMPLES
Caffeic acid is a phenolic compound found in various foods such as coffee, clove, and cinnamon. It has antioxidant properties and is linked to several health benefits [8]. UV spectrophotometry is a widely used method for analyzing such compounds due to its sensitivity and simplicity. This study aims to validate a UV spectrophotometric method for estimating the concentration of caffeic acid in food samples, focusing on commonly consumed spices and beverages[9].
MATERIALS AND METHODS
The food samples (coffee, clove, cinnamon, kokum, and Tamarind) were collected and prepared by diluting each sample in specific concentrations. Standard solutions of caffeic acid were prepared for calibration. UV absorbance was measured using a UV-Vis spectrophotometer at a wavelength of 320 nm. The concentration of caffeic acid in the food samples was determined by comparing the absorbance values with the standard curve. Comparative Extraction Analysis of Caffeic Acid Under Varying Conditions [10].
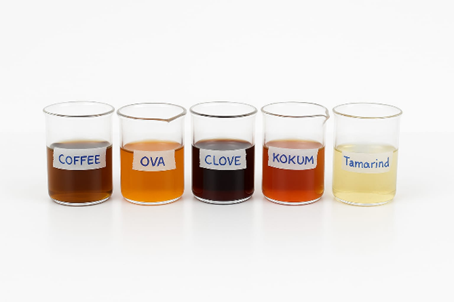
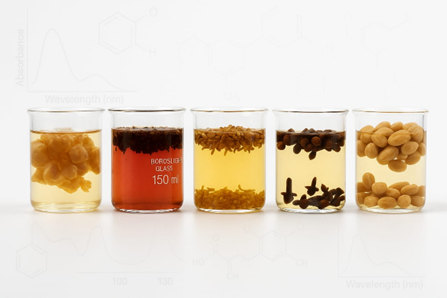
Fig 5. Extracts Of Selected Food Samples
To evaluate the extractability of caffeic acid from different food samples, three extraction conditions were employed: (1) boiling for 10 minutes, (2) incubation in warm water for 3–4 hours, and (3) soaking at room temperature for 24 hours. The absorbance of each extract was measured using a UV spectrophotometer at the selected wavelength corresponding to caffeic acid. The comparative absorbance values obtained are presented in Table 5.
Table 5: Concentration of Caffeic Acid in Different Food Samples At Three Different Time Periods.
|
Food samples |
Concentration (10 minutes boiling) (μg/mL) |
Concentration (3-4 hours in warm water) (μg/mL) |
Concentration (24 hours of soaking at room temp) (μg/mL) |
|
0.9223 0.7596 0.5968 0.3255 |
0.8681 0.6836 0.5208 0.3798 0.2930 |
0.8138 0.5968 0.4557 0.3255 0.2604 |
It was observed that boiling for 10 minutes resulted in the highest absorbance values across all samples, indicating efficient extraction of caffeic acid under thermal conditions. The 3–4 hours warm water extraction yielded slightly lower absorbance values, while 24-hour cold soaking showed the lowest absorbance, suggesting a reduction in extraction efficiency over time at lower temperatures. This trend was consistent across all tested substances—coffee, clove, cinnamon, kokum, and imli—with coffee consistently exhibiting the highest absorbance and hence the highest caffeic acid content. The findings suggest that both temperature and duration significantly influence the solubility and extractability of caffeic acid from plant-based sources.
CONCLUSION
The UV spectrophotometric method developed in this study demonstrated high reliability and sensitivity for the estimation of caffeic acid in food samples. Validation results confirmed its accuracy, precision, and reproducibility, meeting the required analytical standards. Among the tested food sources, coffee exhibited the highest concentration of caffeic acid, particularly when extracted under thermal conditions. Boiling significantly enhanced the extractability of caffeic acid compared to warm or room-temperature methods. This study confirms that UV spectrophotometry is a practical and accessible technique for routine caffeic acid analysis in both research and industry settings.
REFERENCES


Akshada Chikane, Shara Kesharwani, Aniket Kalambe, Dr. Tripti Sharma, UV Spectrophotometric Method for Estimation of Caffeic Acid in Food Samples, Vol 3, Issue 6, 824-830. https://doi.org/10.5281/zenodo.15597715
 10.5281/zenodo.15597715