

We use cookies to ensure our website works properly and to personalise your experience. Cookies policy
Department of Pharmaceutical Analysis, Karnataka College of Pharmacy, Bengaluru, Karnataka, India
A simple, rapid and reproducible reversed-phase high-performance liquid chromatographic method was developed and validated for simultaneous estimation of dapagliflozin and sitagliptin in bulk drug standards and a combined tablet dosage form. Separation was achieved on an XBridge C18 column (250 × 4.5 mm, 5 µm) using acetonitrile and 10 mM Tris buffer adjusted to pH 8.1 in a 40:60 (v/v) ratio as the mobile phase. The flow rate was 1.0 mL/min, injection volume 20 µL, column temperature 25 ± 1°C and detection wavelength 224 nm. Sitagliptin and dapagliflozin were retained at approximately 4.510 and 7.813 min, respectively, with a 15-min analytical run. Linearity was established over 10–60 µg/mL for dapagliflozin and 50–100 µg/mL for sitagliptin, with coefficients of determination of 0.9918 and 0.9881, respectively. Precision experiments gave %RSD values below 0.50% across the reported intra- and inter-day experiments. Mean recoveries were 99.50–100.30% for dapagliflozin and 99.20–100.80% for sitagliptin. The reported LOD/LOQ values were 2.56/8.448 µg/mL and 13.85/45.705 µg/mL, respectively. Robustness was examined by deliberate variation of flow rate and detection wavelength, with peak-area %RSD values remaining below 0.71%. The method therefore provides a practical chromatographic procedure for simultaneous analysis of the two antidiabetic agents in pharmaceutical analytical work.
Dapagliflozin is a sodium-glucose cotransporter-2 inhibitor, whereas sitagliptin is a dipeptidyl peptidase-4 inhibitor. Their complementary pharmacological actions have supported the development and use of combination antidiabetic therapies. Reliable analytical procedures are therefore required for identification and quantitative quality assessment of formulations containing these active pharmaceutical ingredients.
Reversed-phase high-performance liquid chromatography (RP-HPLC) remains one of the most widely used techniques for pharmaceutical assay because it combines chromatographic separation with sensitive UV detection. Published analytical procedures have described individual determination of dapagliflozin and sitagliptin as well as simultaneous chromatographic methods. A simultaneous RP-UHPLC procedure for the two drugs has also been reported in lipid-based formulations, while other studies have investigated stability-indicating RP-HPLC methods for combined products.¹–⁴
Despite these reports, laboratory-specific methods may require different stationary phases, aqueous buffers, pH conditions, detection wavelengths and concentration ranges. The present study was therefore undertaken to develop and validate a straightforward isocratic RP-HPLC procedure for simultaneous estimation of dapagliflozin and sitagliptin using UV detection, followed by evaluation of specificity, linearity, precision, accuracy, robustness, detection limit and quantitation limit.
MATERIALS AND METHODS
Chemicals and reagents
Dapagliflozin and sitagliptin reference standards were obtained as gift samples from Anwita Drugs and Chemicals Pvt. Ltd., Hyderabad, India. A combined tablet containing 10 mg dapagliflozin and 100 mg sitagliptin (Dapazen S 10/100) was procured from a local pharmacy. HPLC-grade acetonitrile and methanol, analytical-grade Tris buffer and HPLC-grade water were used. Water was obtained using a Direct-Q purification system. A 0.45-µm nylon membrane filter was used for filtration.
Instrumentation
The study used an Agilent 1120 Compact LC HPLC system equipped with a pump, Rheodyne injector and variable-wavelength UV detector. Chromatographic data were acquired and evaluated using EZChrom Elite software. An XBridge C18 column (250 × 4.5 mm, 5 µm) was used for separation. A Shimadzu AUX 220 analytical balance, sonicator and filtration assembly were used during sample preparation. A Shimadzu UV-1800 double-beam UV-visible spectrophotometer was used for wavelength selection.
Chromatographic conditions
After preliminary trials, the mobile phase was optimized as acetonitrile:10 mM Tris buffer, pH 8.1 (40:60, v/v). The flow rate was 1.0 mL/min, injection volume 20 µL, column temperature 25 ± 1°C and detection wavelength 224 nm. The reported retention times were 4.510 min for sitagliptin and 7.813 min for dapagliflozin. A 15-min run was used for the analytical procedure. The column was equilibrated with the mobile phase for at least 40 min before injections.
Standard solutions and calibration
Separate stock solutions of dapagliflozin and sitagliptin were prepared at 1000 µg/mL in HPLC-grade methanol. A 100 µg/mL intermediate solution was prepared by dilution with mobile phase. Working solutions were prepared over 10–60 µg/mL for dapagliflozin and 50–100 µg/mL for sitagliptin. Solutions were sonicated for 15 min and filtered through a 0.45-µm nylon membrane. Twenty-microlitre portions were injected under the optimized conditions. Calibration curves were constructed by plotting peak area against concentration and applying linear regression analysis.
Specificity
Blank and combined-standard chromatograms were examined under the optimized conditions. The absence of a significant chromatographic response at the analyte retention positions in the blank was used to assess chromatographic selectivity.
Precision
Precision was evaluated using six replicate injections of the working solution. Intra-day precision was assessed in morning and afternoon experiments, while inter-day precision was assessed on two days. Peak areas were recorded and expressed as mean, standard deviation and %RSD.
Accuracy
Accuracy was evaluated at 80%, 100% and 120% levels using standard addition/recovery experiments. The study reports triplicate preparations at each level and expresses accuracy as percentage recovery.
Robustness
Robustness was assessed by deliberate variation of flow rate from 1.0 to 0.9 and 1.1 mL/min and detection wavelength from 224 to 223 and 225 nm. The effect of these changes on peak area and %RSD was recorded.
LOD and LOQ
The study determined LOD and LOQ using signal-to-noise criteria of approximately 3:1 and 10:1, respectively, and reported the resulting values for both analytes.
RESULTS
The validated method produced distinct chromatographic responses for the two analytes under the optimized isocratic conditions. The main validation findings are summarized in Tables 2–6 and representative chromatograms and analytical plots are presented in Figures 1–9.
TABLE 1. OPTIMIZED CHROMATOGRAPHIC CONDITIONS
|
Parameter |
Condition |
|
Stationary phase |
XBridge C18, 250 × 4.5 mm, 5 µm |
|
Mobile phase |
Acetonitrile:10 mM Tris buffer, pH 8.1 (40:60, v/v) |
|
Flow rate |
1.0 mL/min |
|
Detection wavelength |
224 nm |
|
Injection volume |
20 µL |
|
Column temperature |
25 ± 1°C |
|
Run time |
15 min |
|
Retention time |
Sitagliptin: 4.510 min; Dapagliflozin: 7.813 min |
TABLE 2. LINEARITY DATA
|
Analyte |
Range (µg/mL) |
Regression equation |
R² |
|
Dapagliflozin |
10–60 |
y = 23583.84x + 1474651.60 |
0.9918 |
|
Sitagliptin |
50–100 |
y = 25366.65x − 369120.76 |
0.9881 |
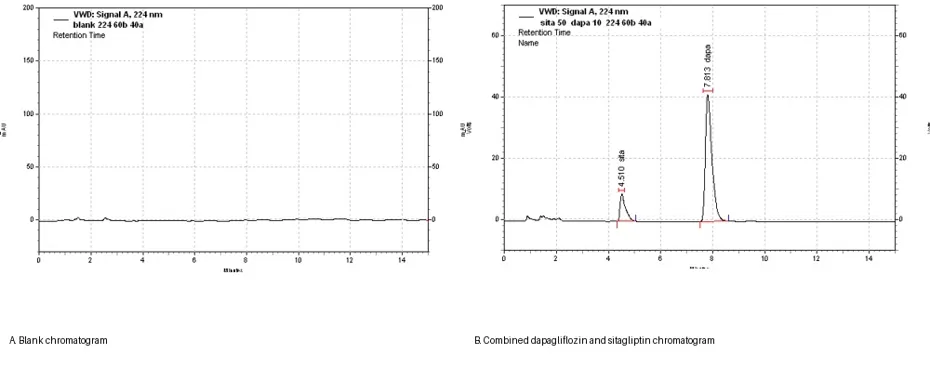
Figure 1. Representative chromatograms for specificity assessment: blank and combined standard.
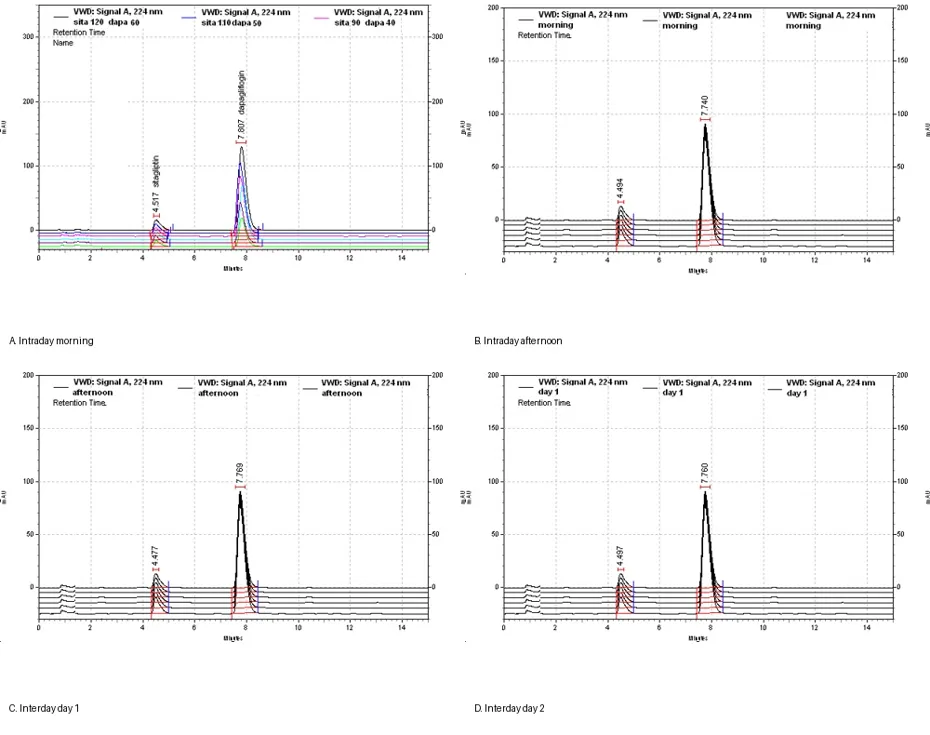
Figure 2. Representative chromatograms from intra-day and inter-day precision experiments.
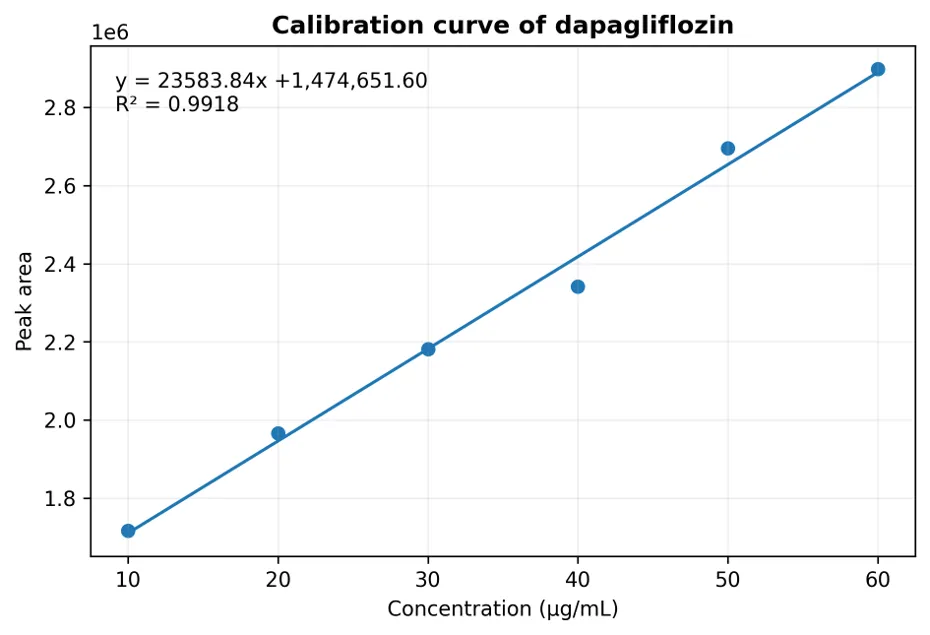
Figure 3. Calibration curve of dapagliflozin.
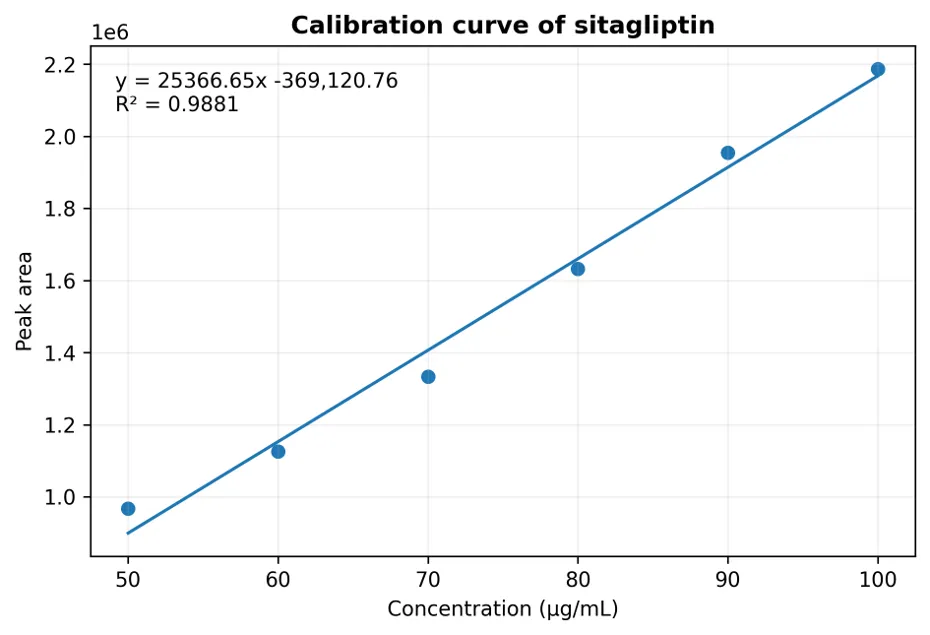
Figure 4. Calibration curve of sitagliptin.
TABLE 3. PRECISION RESULTS
|
Condition |
Dapagliflozin %RSD |
Sitagliptin %RSD |
|
Intraday – morning |
0.195 |
0.487 |
|
Intraday – afternoon |
0.037 |
0.060 |
|
Interday – day 1 |
0.034 |
0.058 |
|
Interday – day 2 |
0.034 |
0.056 |
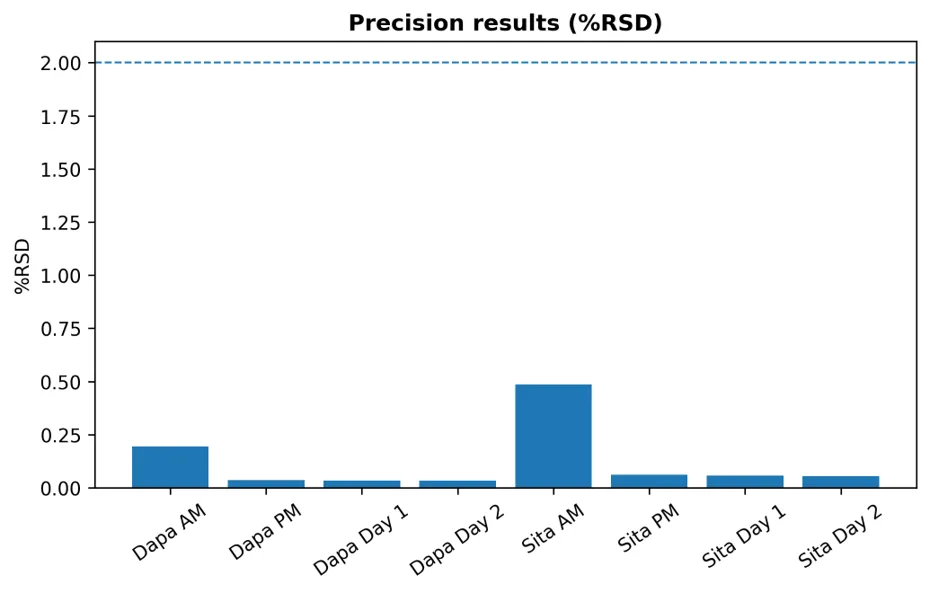
Figure 5. Precision expressed as %RSD of peak area.
TABLE 4. ACCURACY/RECOVERY RESULTS
|
Analyte |
80% |
100% |
120% |
|
Dapagliflozin |
99.50% |
99.80% |
100.30% |
|
Sitagliptin |
99.20% |
99.60% |
100.80% |
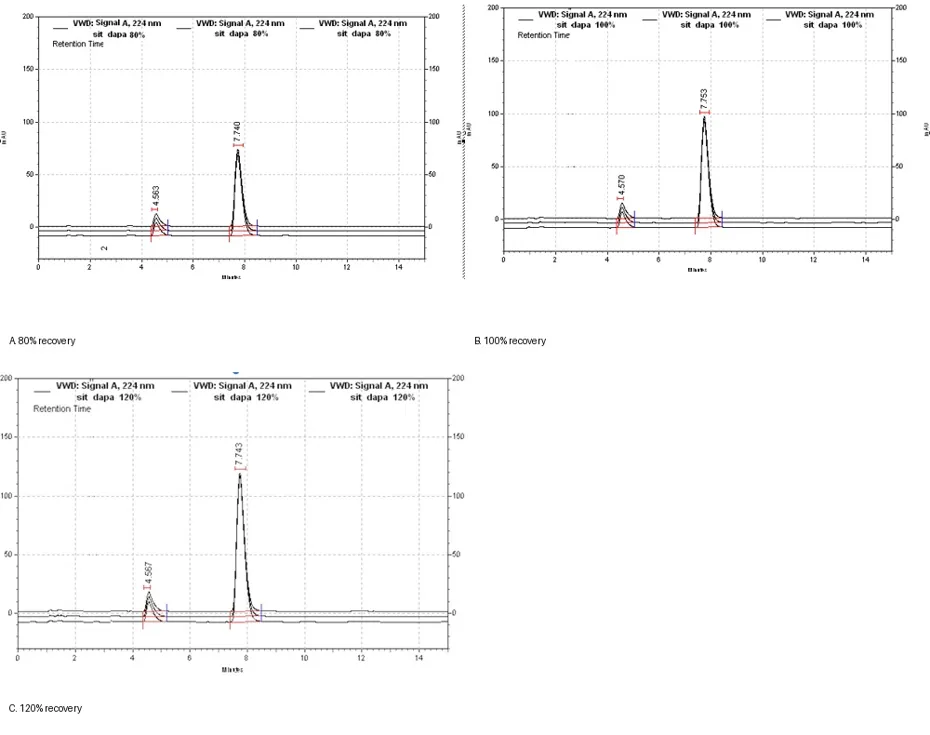
Figure 8. Representative chromatograms for 80%, 100% and 120% recovery levels.
TABLE 5. ROBUSTNESS RESULTS: PEAK-AREA VARIABILITY
|
Variation |
Dapagliflozin %RSD |
Sitagliptin %RSD |
|
Flow rate 0.9 mL/min |
0.67 |
0.51 |
|
Flow rate 1.0 mL/min |
0.58 |
0.60 |
|
Flow rate 1.1 mL/min |
0.70 |
0.66 |
|
Wavelength 223 nm |
0.66 |
0.30 |
|
Wavelength 224 nm |
0.70 |
0.60 |
|
Wavelength 225 nm |
0.50 |
0.5 |
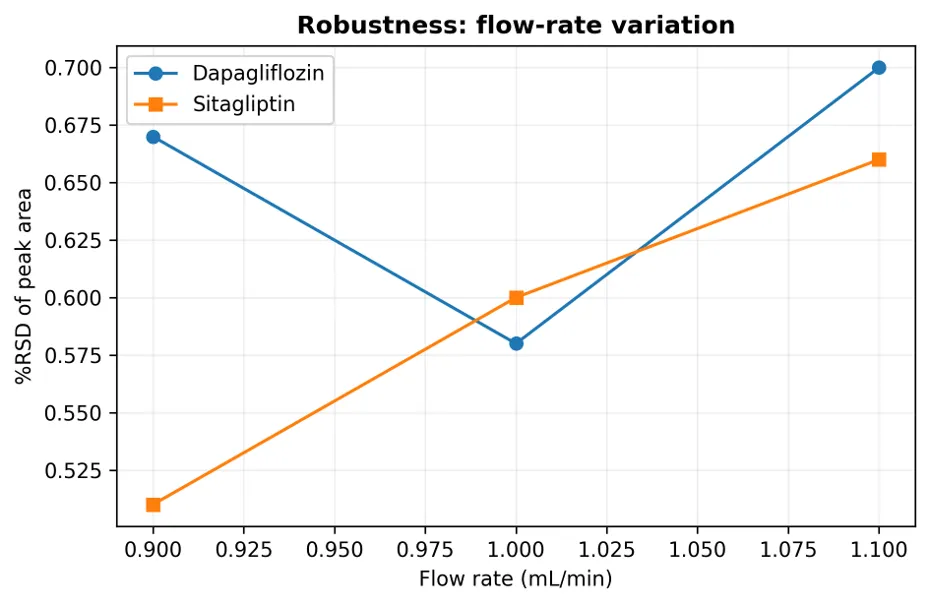
Figure 6. Robustness assessment by flow-rate variation.
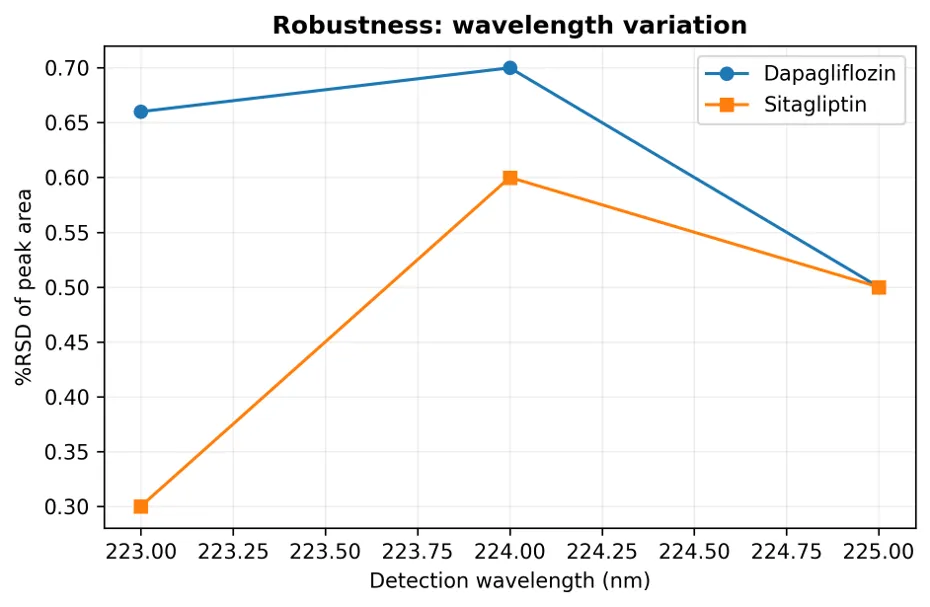
Figure 7. Robustness assessment by detection-wavelength variation.
TABLE 6. SUMMARY OF ANALYTICAL PERFORMANCE
|
Parameter |
Dapagliflozin |
Sitagliptin |
|
Detection wavelength |
224 nm |
224 nm |
|
Linearity range |
10–60 µg/mL |
50–100 µg/mL |
|
R² |
0.9918 |
0.9881 |
|
LOD |
2.56 µg/mL |
13.85 µg/mL |
|
LOQ |
8.448 µg/mL |
45.705 µg/mL |
|
Theoretical plates |
3185 |
4960 |
|
Tailing factor |
1.181 |
1.672 |
|
Recovery range |
99.50–100.30% |
99.20–100.80% |
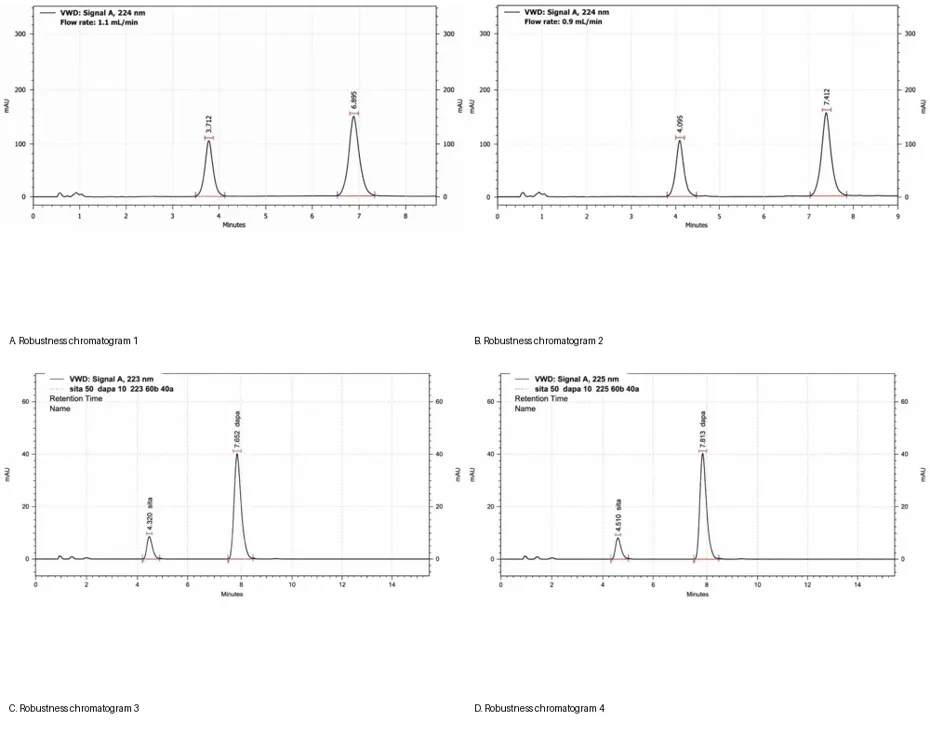
Figure 9. Representative chromatograms from robustness experiments.
DISCUSSION
The optimized separation used a conventional C18 stationary phase with a moderately alkaline Tris-buffered aqueous phase and acetonitrile. Under the reported conditions, sitagliptin and dapagliflozin were observed at approximately 4.510 and 7.813 min, respectively. The blank chromatogram showed no prominent response at the analyte peaks, supporting the specificity assessment made during method development.
The calibration data showed linear responses across 10–60 µg/mL for dapagliflozin and 50–100 µg/mL for sitagliptin. Regression of the experimental peak areas gave R² values of 0.9918 and 0.9881, respectively. The fitted equations calculated from the raw calibration data were y = 23583.84x + 1474651.60 for dapagliflozin and y = 25366.65x − 369120.76 for sitagliptin.
Precision was satisfactory in the reported experiments. Recalculation from the individual peak-area values provided %RSD values of 0.034–0.195% for dapagliflozin and 0.056–0.487% for sitagliptin across the four precision sets. These values are below the commonly applied 2% criterion for assay precision and are consistent with the precision conclusion of the source study.
Accuracy experiments gave recoveries of 99.50%, 99.80% and 100.30% for dapagliflozin at 80%, 100% and 120%, respectively, and 99.20%, 99.60% and 100.80% for sitagliptin. The results fall within the 98–102% recovery interval used in the study for the reported assay/recovery evaluation.
Robustness testing showed peak-area %RSD values of 0.58–0.70% for dapagliflozin and 0.51–0.66% for sitagliptin across the three flow-rate conditions. For wavelength variation, the corresponding ranges were 0.50–0.70% and 0.30–0.60%. The small deliberate changes therefore produced relatively low variability in peak response.
The reported LOD and LOQ were 2.56 and 8.448 µg/mL for dapagliflozin and 13.85 and 45.705 µg/mL for sitagliptin. These values should be interpreted in the context of the relatively high calibration ranges used in this study. The method was designed as a routine simultaneous UV-RP-HPLC procedure rather than as an ultra-trace assay.
CONCLUSION
A practical isocratic RP-HPLC method was developed for simultaneous estimation of dapagliflozin and sitagliptin using an XBridge C18 column, acetonitrile–Tris buffer (40:60, v/v) and UV detection at 224 nm. The method showed satisfactory chromatographic separation, linear response over the investigated ranges, low precision variability, acceptable recovery and robustness to small changes in flow rate and wavelength. The reported validation results support the suitability of the procedure for routine pharmaceutical analytical applications involving these two analytes. The manuscript deliberately does not introduce an assay percentage for the marketed tablet because a separate numerical assay result was not reported in the supplied thesis data.
ACKNOWLEDGEMENT
The author acknowledges the support of Karnataka College of Pharmacy, Bengaluru, for the academic and laboratory work associated with this study.
CONFLICT OF INTEREST
The conflict-of-interest statement should be confirmed by the authors before submission.
REFERENCES


Adithya H M, Dr. Harsha K Tripathy, Dr. C. Sreedhar, T. Sreenivasa Rao, Dr. Manju S V, K. Manogna, Pasupati Nath Tiwari, Development and Validation of a Simultaneous RP-HPLC Method for Dapagliflozin and Sitagliptin in Bulk and Pharmaceutical Dosage Form, Int. J. of Pharm. Sci., 2026, Vol 4, Issue 10, 1104-1113. https://doi.org/10.5281/zenodo.23212565
 10.5281/zenodo.23212565