
We use cookies to ensure our website works properly and to personalise your experience. Cookies policy
1,2 Department of Pharmaceutical Chemistry, Dr. Shri R.M.S. Institute of Science & Technology (College of Pharmacy) Bhanpura, Madhya Pradesh.
3 Maya Devi University
Background: UV Spectroscopy are analytical method a rapid and accurate technique to has been developed for simultaneous estimation of lamivudine and silymarin. The absorbance maximum for lamivudine and silymarin were observed at 270.4 nm and 324. 4nm. Lamivudine act as a nucleoside reverse transcriptase inhibitor (NRRI). They act as against HIV. Silymarin drug is used for treatment of chronic liver disease and hepatitis. Silymarin is hepatoprotective agent. Methods: Spectroscopy is the branch of science dealing with the study of interaction of electromagnetic radiation with matter. The technique of U.V. Spectroscopy is one of the most frequently employed in pharmaceutical analysis. It involves the measurement of the amount of ultraviolet (190-380nm) or visible (380-800nm) radiation absorbed by a s substance in solution. U.V. Spectroscopy instrumental method principle based on Beer’s-Lambert’s law. This study revealed that simultaneous iso-absorptive point was 284.0 nm both drugs are almost equal absorbance at this wavelength and also plotted Calibration curve of both drug concentration versus absorbance. Various methods of producer are used: i. Sample Preparation ii. Selection of Wavelength iii. Construction of calibration curves iv. Analysis of sample. Result: This comprehensive review study crucial for simultaneous estimation of lamivudine and silymarin by uv spectroscopy. The absorption maxima of lamivudine were found to be at 270.4nm, and this method obeyed Beer’s law in the concentration range is 5-30????????/????????. The limit of detection and quantification values for lamivudine were 0.043 and 0.130????????/????????. For silymarin absorbance maxima were found to be at 324.4nm, and the method obeyed beer’s law in the concentration range is 5-30????????/????????. The limit of detection and quantification value for silymarin were 0.129 and 0.392????????/????????. Conclusion: Spectroscopy analytical method is a most valuable, simple, specific, accurate, precision and rapid technique for pharmaceutical analysis of these two drugs. The method obeys Beer’s law and has a good limit of detection and quantification value. Simultaneous estimation of both drug lamivudine and silymarin by uv spectroscopy involves using specific wavelength to determine the concentration of both drugs.
Analytical chemistry is a branch of chemistry that deals with the identification of compounds and mixtures (qualitative analysis) or the determination of the proportions of the constituents (quantitative analysis) techniques commonly used are titration, precipitation, spectroscopy, chromatography. It also plays an important role in building up the quality products through in process control. Analytical chemistry is the study of the separation, identification, and quantification of the chemical components of natural and artificial materials. Qualitative analysis gives an indication of the identity of the chemical species in the sample and quantitative analysis determines the amount of one or more of these components. The separation of components is often performed prior to analysis.
Analyst before development of new method must consider several factors like:
It often happens that minor alteration in a known procedure fails to produce a successful analytical method for the problem confronting the analyst. A fresh approach is then called for and development of new analytical method is an important aspect of chemical research. Chemical analysis can be defined as the resolution of a chemical compound into its proximate parts to determining its elements or the foreign substances it may contain. The drug products are required by law to confirm a minimum standard of quality. With the rapid development of pharmaceuticals and higher challenges of quality the volume of analytical work is increasing day by day. This forces the development of analytical methods that are rapid, accurate, precise and reproducible.
TYPES OF CHEMICAL ANALYSIS
When a completely unknown sample is taken for analysis, presence of one or more component in the sample and prediction of structural features of the compound, are done by qualitative method.
This method deals with the determination of quantity i.e. content of each component or specified component of the sample, whose chemical behavior is known.
Quantitative analysis can be classified into two categories
In these methods volume and mass are used as means of detection i.e. gravimetry, titrimetry and volumetry.
These methods are based on the measurement of specific and nonspecific physical properties of a substance by using instrument.
The advents of new instrumental technique are opening avenues for the analyst to circumvent the difficulties in mixture analysis. Some of these techniques commonly employed are spectrophotometer, gas chromatography and high-performance liquid chromatography.
Comparison of different methods of analysis is given in Table-1.
|
Sr. No. |
Method |
Principle |
Application |
|
I |
Qualitative Analysis |
Chemical behavior of the substance. |
Detection of presence or absence of substance. |
|
II (A) |
Quantitative Analysis – Classical Methods |
||
|
1 |
Titrimetric Methods |
Determination of volume of known concentration required to react quantitatively with a measured volume of solution of the substance to be measured. |
|
|
(a) |
Acidimetry and Alkalimetry |
Neutralization reaction. |
Alkaline and acidic substances. |
|
(b) |
Redox Titration |
Change of oxidation among the reaction of ion to form precipitates. |
Ionic substance. |
|
(c) |
Precipitation Titration |
Complex formation of ion. |
Complexing agent. |
|
2 |
Gravimetric Method |
Producing and weighing of compound or element in pure form after chemical treatment. |
Analysis of standards. |
|
II (B) |
Instrumental Methods |
||
|
1 |
Spectroscopic Methods |
Interaction of electromagnetic radiation with matter. |
|
|
(a) |
Ultraviolet and Visible Spectroscopy |
Excitation of valence electrons. |
Quantitative analysis. |
|
(b) |
Infra-red Spectroscopy |
Excitation of molecular vibration. |
Structure determination and identification of organic and inorganic compounds. |
|
(c) |
Raman Spectroscopy |
Excitation of molecular vibration by light scattering. |
Structure determination and identification of organic compounds; symmetry of molecular groups in solid state. |
|
(d) |
Atomic Absorption Spectroscopy |
Absorption of atomic resonance line. |
Trace and quantitative analysis for a given metal. |
|
(e) |
Atomic Emission Spectroscopy |
Light emission from excited electronic states of atoms. |
Quantitative analysis for all elements emitting in UV–Vis spectrum. |
|
(f) |
X-Ray Diffraction |
Diffraction of X-rays from crystal planes. |
Identification of solid compounds; crystalline size. |
|
(g) |
X-ray Fluorescence |
Re-emission of X-rays from excited atoms. |
Quantitative analysis of elements, especially non-metals. |
|
(h) |
Fluorometry and Phosphorimetry |
Emission of light energy by electron. |
Inorganic and organic substances. |
|
(i) |
Nephelometry and Turbidimetry |
Intensity of transmitted light as a function of concentration of the dispersed phase. |
Water treatment plants, sewage work, beverage bottling industry. |
|
(j) |
Mass Spectroscopy |
Ionisation of molecule and conversion into fragmented ions. |
Structure determination and identification of organic compounds; analysis of trace volatiles in non-volatiles. |
|
(k) |
Nuclear Magnetic Resonance Spectroscopy |
Reorientation of magnetic nuclei in a magnetic field. |
Structure determination, identification of organic compounds, molecular conformation. |
|
(l) |
Electron Spin Resonance Spectroscopy |
Reorientation of magnetic electrons in a magnetic field. |
Trace analysis, structure determination, determination of reaction rates and mechanisms. |
|
2 |
Electrochemical Methods |
||
|
(a) |
Potentiometry |
Difference in electrode potential depends on concentration of ionic species in solution. |
pH determination, fluoride determination. |
|
(b) |
Voltammetry and Polarography |
Voltage–current–time relationship during electrolysis. |
Metals, anions, and many organic species. |
|
(c) |
Stripping Method |
Electrodeposition of ion onto an electrode surface and electrochemical stripping back into solution. |
Determination of metals in tap water. |
|
(d) |
Amperometry Method |
Difference in voltage is a function of volume of reagent. |
Trace metal analysis. |
|
(e) |
Coulometry Method |
Chemical reaction extent is proportional to quantity of electricity passed. |
Reagents difficult to analyze by ordinary chemical means like nitrates. |
|
(f) |
Electrogravimetry Method |
Chemical action proportional to quantity of electricity passed through electrode. |
Metal elements. |
|
(g) |
Conductance Techniques |
Conductivity of solution. |
Ionic species determination. |
|
3 |
Chromatographic Methods |
||
|
(a) |
Gas Chromatography (GC) |
Partitioning between vapour phase and solid/liquid. |
Multicomponent qualitative analysis of volatile organics. |
|
(b) |
Liquid Chromatography (HPLC) |
Partitioning between liquid and solid phase. |
Separation of ionic materials; multicomponent analysis. |
|
(c) |
Size-Exclusion Chromatography |
Solute size-dependent partitioning between pore and interstitial volume. |
Separation by hydrodynamic volume; polymer molecular weight distribution. |
|
(d) |
High-Performance Thin Layer Chromatography (HPTLC) |
Partitioning between liquid solution and solid. |
Multicomponent analysis. |
|
(e) |
Paper Chromatography |
Partitioning between liquid solution and paper. |
Separation of amino acids. |
|
4 |
Hyphenated Methods |
||
|
(a) |
GC–Mass Spectroscopy |
Combines separation efficiency of GC with sensitivity and specificity of mass spectroscopy. |
Identification and analysis of mixtures. |
|
(b) |
GC–IR Spectroscopy |
Combines separation efficiency of GC with specificity of IR. |
Separation and structural determination of mixtures. |
|
(c) |
HPLC–Mass Spectroscopy |
Combines separation efficiency of HPLC with sensitivity and specificity of mass spectroscopy. |
Analysis and identification of mixtures. |
|
5 |
Miscellaneous Methods |
||
|
(a) |
Thermal Analysis |
Change in physical and/or chemical properties as a function of temperature. |
Determination of purity and thermal stability. |
|
(b) |
Refractometry Method |
Refractive index as a function of concentration. |
Composition of binary liquid or gaseous mixtures. |
|
(c) |
Polarimetry Method |
Rotation of plane-polarized light by solution. |
Quantitative analysis of optically active compounds. |
Ultraviolet - Visible Spectroscopy
The technique of Ultraviolet – visible spectrophotometry is one of the most frequently employed in pharmaceutical analysis. It involves the measurement of the amount of ultraviolet (190-380 nm) or visible (380-800 nm) radiation absorbed by a substance in solution. Instruments which measure the ratio or a function of ratio of the intensity of the two beams of light in the ultraviolet and visible region are called ultraviolet- visible spectrophotometers.
The Essential Components of U.V. Spectrophotometer
Lambert law Beer’s law
It states that the intensity of a beam of parallel monochromatic radiation decreases exponentially with the number of absorbing molecules. In other words, absorbance is proportional to the concentration.
Lambert’s law
It state that the intensity of a beam of parallel monochromatic radiation decreases Exponentially as it passes through a medium of homogeneous thickness.
A combination of these two laws yield the Beer- Lambert law Mathematically, Beer- Lambert law is expressed
A = a b c
Where, A = absorbance or optical density
a = absorptivity or extinction coefficient
b = path length of radiation through sample (cm)
c = concentration of solute in solution
For the assay a substance in multicomponent sample, following method are being used routinely.
Simultaneous Equation Method: If the sample contain two absorbing drug (X and Y) each of which absorb at the λmax of other, it may be possible to determine both the drug by the technique of simultaneous equation method (vierodt’s method) provided that the certain criteria apply.
The information required is:
Two equation are constructed based upon the fact that the λ1 and λ2 the absorbance of the mixture is the sum of the individual absorbance of X and Y
At λ1 A1 = ax1bCx + ay1Cy (1)
At λ2 A2 = ax2bCx + ay2bCy (2)
For measurement in 1 cm cell, b = 1 Rearrange eq. (2)
Cy = A2 – ax2 Cx
Ay2
Substituting Cy in eq. (1) and rearranging gives
Cx = A2 ay1 – A1 ay2 (3)
Ax2 ay1 – Ax1 ay2
Cy = A1 ax2 – A2 ax1 (4)
Ax2 ay1 – Ax1 ay2
Absorption Ratio Method: The absorbance ratio method is a modification of the simultaneous equation procedure. It depend on the property that, for a substances which obey’s Beer’s law at all wavelength, the ratio of absorbance at any two wavelength is a constant value independent of the concentration or pathlength. For example, two different dilution of the same substance give the same absorbance ratio is referred A1/A2 2.0 in the USP this ratio is referred to as a Q value. The British pharmacopoeia also uses a ratio of absorbance at specified wavelength in certain confirmatory test of identity. For example, Cyanocobalamin exhibits three λmax, at 278nm, 361nm. And 550nm. The A361/A550 is required to be 3.30 ± 0.15 and the A361/A278 to be 1.79± 0.09.
In the quantitative assay of two component in admixture by the absorbance ratio method, absorbance are the measure at two wavelength one being the λmax, one component (λ2) and the other being a wavelength of equal Absorptivity of two Component (λ1) i.e. an iso – absorptive point
Geometric Correction Method: A number of mathematical correction procedure have been developed which reduce or eliminate the background irrelevant absorption that may be present in sample of biological origin. The simplest of these procedure is the three point geometric procedure, which may be applied if the irrelevant absorption is linear at the three wavelength selected. Consider an absorption spectrum comprising spectrum of the analyte and that of the background absorption. If the Wavelengths λ1, λ2, and λ3 are the selected so that the background absorbance B1, B2 And B3 are linear. Then the corrected absorbance, D, of the drug may be calculated from the three absorbance A1, A2 and A3 of the sample solution at λ1, λ2 and λ3 respectively.
D = Y (A2


(y+z) (1

y and z be the wavelength intervals (λ2 – λ1) and (λ1 – λ2)
Orthogonal Polynomial Method: The technique of orthogonal polynomial is another mathematical correction procedure which involves more complex calculation than the three point correction procedure. The basis of the method is that an absorption spectrum may be represented in term of the orthogonal function as follows:
A (λ) = p0 p0 (λ) + p1 p1 (λ) + p2 p2 (λ)…..pn pn (λ)
Where A denotes the absorbance at wavelength λ belonging to set of n+1 equally Spaced wavelength at which the orthogonal polynomials, p0 (λ), p1 (λ), p2 (λ)… pn (λ) are each defined.
These polynomials represent a series of fundamental shape and the contribution that each shape eg. P2 makes to the absorption spectrum is defined by the appropriate coefficient eg. P2 for P2. The coefficients are proportional to the concentration of the absorbing analyte, and a modified Beer – Lambert equation may be constructed
Pi = αJbc
Derivative Spectrophotometry Method: Involves the conversion of normal spectrum to its first, second or higher derivative spectrum. The transformation that occurs in the derivative spectra are understood by reference to a Gaussian bent which represents and ideal absorption band. In the context of derivative spectrophotometry, the normal absorption spectrum is referred to as fundamental, zeroth order or Dº spectrum. The first derivative (D1) spectrum is a plot of the change of absorbance with wavelength against wavelength that a plot of slope of the fundamental spectrum against wavelength or a plot of dA/d λ vs. λ. At λ2 and λ4 the maximum positive and maximum negative slopes respectively in the D1 spectrum. The λmax at λ3 is a wavelength of zero slope and give dA/dλ = 0 that is cross-over point, in the D1 spectrum. Derivative UV – visible spectrophotometry have been widely used over a last few years in the analysis of multicomponent in mixture. This transformation shows two principal advantages on derivative spectrophotometry .firstly, an even order spectrum is of narrower spectral band width than its fundamental spectrum. A derivative spectrum therefore shows better resolution of overlapping band than the fundamental spectrum and may permit the accurate determination of the λmax of the individual band. Secondly, derivative spectrophotometry discriminates in favour of substances of narrow spectral bandwidth against broad band with substances. This is because the derivative amplitude (D) that is the distance from a maximum to a minimum, is inversely proportional to the fundamental spectral bandwidth (W) raised to the power (n) of the derivative order. Thus,
Dα (1/W) n
For this reason, diverse procedures for the resolution of overlapped peaks have been applied. Thus, the zero - crossing method has been used for the first and second derivative spectra in diverse mixture. Apart from the spectroscopical method, chromatographical technique ex. GC, HPLC, HPTLC, etc. have gained significance in quantitative analysis of the drug in bulk, formulation and from biological fluids.
Validation
Validation means rectification or conformation, It is a concept which establishes the documented program of specified and reliable performance. The proof of validation is obtained through the collection and evaluation of data. Validation study is essential part of G.M.P. Once the problem is defined the following important factors are considered in choosing analytical method. These are concentration range, required accuracy and sensitivity, selectivity time requirements and cost of analysis.
VALIDATION PARAMETER
For validation the developed method is subjected to following studies
Analytical Method Validation
A process which establishes, through laboratory studies, a correlation between the performance characteristics of the method under consideration, with the requirement of its analytical application, is validation. Objective of validating analytical method is Provide sufficient evidence proving accuracy, reliability and reproducibility of the method, and also its suitability of the purpose.
The guidelines of ICH for parameter of validation are
Linearity of an analytical method is its ability to elicit test results that are directly, or derived applying mathematical transformation, proportional to the concentration of analyte in the sample within a given range. The ICH guidelines recommend a minimum of five concentrations for linearity. A linear relationship should be evaluated across the range of the analytical procedure. It may be demonstrated directly on the pure drug (by dilution of a standard stock solution) and/or formulation, using the proposed procedure.
Range of an analytical method is an interval between the upper level and the lower level of concentration of analyte that have been demonstrated to determine with the suitable degree of linearity, accuracy and precision. The range is normally expressed in the same units as the test results (e.g. percentage, parts per million) obtained by the analytical method. The range of the method is validated by verifying that the analytical method provides acceptable precision, accuracy and linearity when applied to samples containing analyte at the extremes of the range as well as within the range.
Accuracy of an analytical method is the closeness of the result obtained by that method to the true value. It should be established across a concentration range. It is calculate as the percentage of recovery by assay of know amount of analyte, added in the sample or as the difference of the mean and the accepted true value together with confidence interval. The ICH document recommended that the accuracy should be assessed using a minimum of nine determination over a minimum three concentration level, covering a specified range.
Precision of an analytical procedure express the closeness of agreement i.e. degree of scatter between a series of measurements obtained from multiple sampling of the same homogenous sample under prescribed condition. It precision may be consider by the three operation i.e. repeatability, intermediate precision and reproducibility. It is usually expressed by using statistical parameter such as variance, standard deviation or coefficient of variation of measurements.
Specificity is the ability of analytical method to assess, unequivocally, the analyte in the presence of other components of the sample.
Limit of detection is the lowest amount of analyte that can be detected in sample, but not necessarily quantified, under the experimental condition. Thus limit test nearly substantiate that the amount of analyte is above or below a certain level of concentration. It is generally determined by the analysis of sample with known concentration of analyte and by establishing the minimum level at which the analyte can readily be detected. The ICH documents a common approach which is used to compare measure signal from sample with known low concentration of analyte with those of blank sample.
Formula for Limit of detection LOD = 3.3 ????/S
???? = Standard deviation
S = Slope of the calibration curve
Limit of quantification is characteristic of quantitative assay for low level of compound in sample matrix, such as impurities in bulk drug substances and degradation product in finished pharmaceutical. It is the lowest amount of analyte in the sample that can be determined with acceptable precision and accuracy under stated experimental condition. It can be determined by the analysis of the sample with known concentration of the analyte and by establishing a minimum level at which the analyte can be determined with acceptable accuracy and precision. The ICH guidelines common approach to compare these measured signals from sample with low concentration of analyte with those of blank. Minimum concentration of the analyte can be reliably quantified with is 10:1 signal / noise ratio. Another approach depends on the determination of the slope of the calibration curve and standard deviation.
Formula for Limit of Quantification LOQ = 10 ????/S
???? = Standard deviation
S = Slope of the calibration curve
Ruggedness of an analytical method is the degree at which reproducibility of test result are obtained by the analysis of the same sample under varying condition. Such as change in laboratories, anlyst, instrument, lot of reagents, elapsed assay time, temperature, day, etc.
Robustness of the analytical method is measure of its capacity to remain unaffected by small, but deliberate variation, in parameter of method and provides an indication of its reliability during the normal range. It should show the reliability of an analysis with respect to deliberate variation in method parameter.
System suitability testing is an integral part of many analytical procedures. The test are based on the concept that the equipment, electronics, analytical operation and sample to be analyzed constitute an integral system that can be evaluate as such system suitability test parameter to be established for particular procedure depend on the type of procedure being validated.
DRUG PROFILE

Molecular Formula : C8 H11 N3 O3 S
Molecular Weight : 229.3 gm/mol
Chemical Name : (-) – 4 amino-1-[2R,5S]-2 (hydroxymethyl1)-1,3-oxathiolan-5y1] pyrimidin-2-one
Synonyms : L-2,3-dideoxy 3-thicytidine
Description : White almost white power
Melting Point : 160–162ºC
Solubility : Soluble in water, sparingly soluble in methanol
Pharmacokinetics : Plasma half-life is approximately 2.5 hours
Pharmacology : Hepatitis B (HBV). Lamivudine is phosphorylated to active metabolites that compete for incorporation In to viral DNA. They inhibit the HIV reverse Transcriptase enzyme competitively and act as a Chain terminator of DNA synthesis.
Absorption : Lamivudine was rapidly absorbed after oral administration in HIV-infected patients.
Distribution : It is distributed throughout most of body fluids.
Bioavailability : 86%
Metabolism : The only detected metabolite of lamivudine is trans-Sulfoxide.
Adverse Effects : Headache, Fatigue, Nausea, Anorexia, Abdominal pain, Vomiting, diarrhea, insomnia, dizziness. (Tripathi K.D.),
Storage : Should be kept in well closed container
Dose : For chronic hepatitis B-100 , For H.I.V. Infection 150 mg
Category : Anti H.I.V agent Nucleoside and nucleotide reverse transcriptase
Additional information : Lamivudine may exhibit polymorphism
Routes : Oral
Protein binding : 36%
Half life : 5-7 hour
Dosage form : Solution, Tablet
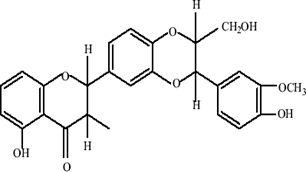
Molecular Formula : C25H22O10
Molecular Weight : 482.43
Chemical Name : 3,5,7, trihydroxy-2hydroxy-3methoxyphenol-3(hydroxy methil1-4-benzodioxan6-4) -4chromanone
Description : Yellow-brownish powder
Melting Point : 158-167 ºC
Solubility : Soluble in methanol, ethanol, and ethyl acetate.
Mode of Actions : Silymarin protect ageist its toxic principal amanting by Preventing its uptake through hepatocyte membrane and Inhibiting the effect of tumor necrosis factor which exacerbates lipid peroxidation.
Category : Hepatoprotective agent. Carbon tetrachloride Poisoning. Alcoholic liver disease. Chronic active hepatitis.
Pharmacokinetics : Plasma half-life is approximately 6-8 hour
Absorption :Silymarin is absorbed by oral route
Distribution : Silymarin is distributed in alimentary tract (Liver, stomach, intestine, pancreas)
Metabolism : It is mainly excreted as metabolites in the bile
Adverse Effects : Nausea, upset stomach, mild headache, vomiting,
Storage : Store at room temperature
Dose : 70-140 mg
The absorbance ratio method is a modification of the simultaneous equation procedure. It depend on the property that, for a substances which obey’s Beer’s law at all wavelength, the ratio of absorbance at any two wavelength is a constant value independent of the concentration or pathlength. For example, two different dilution of the same substance give the same absorbance ratio is referred A1/A2 2.0 in the USP this ratio is referred to as a Q value.
In the quantitative assay of two component in admixture by the absorbance ratio method, absorbance are the measure at two wavelength one being the λmax, of one component (λ2) and the other being a wavelength of equal Absorptivity of two component (λ1) i.e. an iso – absorptive point.
The concentration of two drug in mixture is calculated by using following equation
CS = QM – QL x A eq. (1)
QS – QL aS
CL = QM – QS x A eq. (2)
QL – QS aY
CS = Concentration of Silymarin in lab mixture
CL = Concentration of Lamivudine in lab mixture
QM = Ratio of absorbance of laboratory mixture at λ1 and λISO
QS = Absorptivity ratio at λ1 and λISO of Silymarin
QL = Absorptivity ratio at λ1 and λISO of Lamivudine
aS = Absorptivity at λISO of Silymarin
aY = Absorptivity at λISO of Lamivudine
A = Absorbance of laboratory mixture at λISO
Lamivudine powder (10 mg) was weighed accurately and transferred in to the 10 ml volumetric flask and dissolved in 3 ml of methanol and made up the volume with phosphate buffer saline (pH 7.4) (3:7 ratio) to get stock solution of 1000µg/ml And then the working stock solution 10 µg/ml was prepared from the stock solution these Working solutions were scanned in the entire UV range (200-400 nm) to determine
The λmax. The wavelength found for the analysis 270.4nm. The Calibration curve was plotted at the concentration range 5-30µg/ml. absorbance vs concentration were plotted to obtain the calibration curve. The drugs obeyed Beer’s law with the above concentration range.
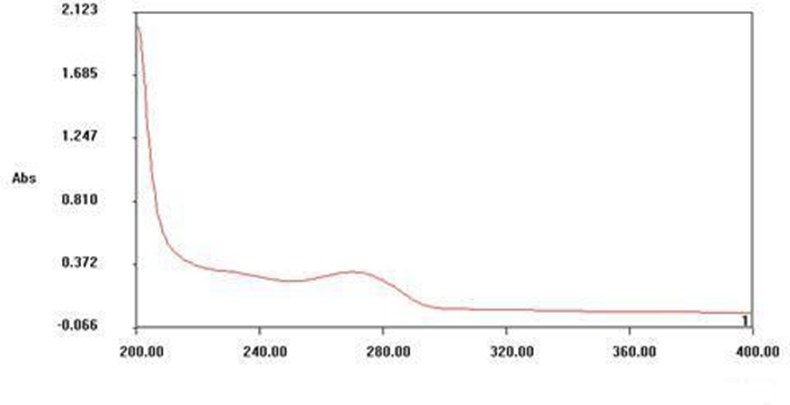
Fig.(1) Wavelength spectra of Lamivudine
Silymarin powder (10 mg) was weighed accurately and transferred in to the 10 ml volumetric flask and dissolved in 3 ml of methanol and make up the volume with phosphate buffer saline having the (pH 7.4) (3:7 ratio) to get stock solution of 1000µg/ml and then the working standard stock solution 10 µg/ml was prepared from the stock solution these working solutions were scanned in the entire UV range (200-400 nm) to determine the λmax. The wavelength found for analysis 324.4nm. The calibration curve was plotted at the concentration range 5-30µg/ml. The drugs obeyed Beer’s law with the concentration range 5-30µg/ml.

Fig. (2) Wavelength spectra of Silymarin
Both spectra of Lamivudine and Silymarin were overlaid to each other by operating the scan files and determined the Iso absorptive point. Here the study revealed that Iso-absorptive point was 284.0 nm and both drugs possessed almost equal absorbance at this wavelength. In absorption ratio analysis two wavelengths was selected, first wavelength was known as λ1 (324.4 nm) and second was known as λISO (284nm) respectively.
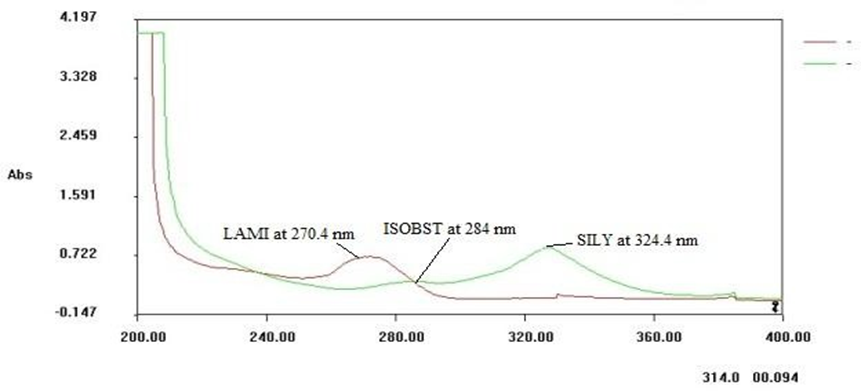
Fig(3) Overlain Spectra of Lamivudine and Silymarin


Anand Kumar Gupta, Aslam Hussain Agwan, Kriti Ranjana, A Comprehensive Review: Simultaneous Estimation of Lamivudine and Silymarin by UV Spectroscopy, Int. J. of Pharm. Sci., 2026, Vol 4, Issue 2, 1149-1165. https://doi.org/10.5281/zenodo.18519643
 10.5281/zenodo.18519643