
We use cookies to ensure our website works properly and to personalise your experience. Cookies policy
Sigma Institute of Pharmacy, Sigma University, Bakrol,, Vadodara, Gujarat, India 390019
RP-HPLC remains the gold standard in the pharmaceutical industry for quality control of both drug substances and drug products. Checking the reliability of these procedures requires thorough validation according to ICH guidelines, especially Q2(R1). In establishing the stability-indicating capability of a method, it requires forced degradation studies or so-called stress testing as outlined under ICH Q1 guidelines. The paper reviews in detail the parameters required to validate a method, namely specificity, linearity, accuracy, precision, and robustness, and also describes the procedure to be followed for acid, base, oxidative, thermal, and photolytic stress conditions. This paper aims at serving as a strategic tool for an analytical chemist in the development of robust yet regulatory-compliant analytical procedures.
HPLC remained the dominant separation technique in pharmaceutical analysis due to its high sensitivity, reproducibility, and suitability for non-volatile and thermally labile compounds. The HPLC techniques, RP-HPLC, which uses a non-polar stationary phase and polar mobile phase, also most common separation technique. [1]The prime objective of an analytical method in a regulatory context is to deliver results that are accurate and guarantee patient safety, and hence method validation is required. Validation is defined as the accumulation of documented evidence that provides a high degree of assurance that a specific process will consistently produce a product meeting its predetermined specifications and quality attributes. The major guidance towards this task comes from the International Council for Harmonisation through the ICH Q2(R1) guidelines. [2]
Concurrently, regulatory agencies such as the U.S. Food and Drug Administration (FDA) and the European Medicines Agency (EMA) require that analytical methods for stability assessment be stability-indicating; that is, the methods must quantify the API without interference from degradation products. This objective is realized via stress testing (forced degradation), as described in ICH Q1A(R2). The present review synthesizes these two critical components validation and stress testing into a unified workflow. [3,4]
HPLC Methodology: Strategic Mobile Phase Selection:
The choice of mobile phase is the most critical parameter in controlling selectivity and retention factor in RP-HPLC. [5]
Strategic Method Development in RP-HPLC
Stationary Phase Selection (The Column) [6-8] While C18 is the workhorse, modern separation requires a nuanced choice.
Table 1: HPLC Column Classification and Selection Guide
|
Column Chemistry |
Characteristics |
Recommended Application |
|
C18 (ODS) |
High hydrophobicity, dense carbon loading. |
General purpose; first choice for most small molecules. |
|
C8 (Octyl) |
Lower hydrophobicity than C18. |
Use when retention on C18 is excessive (> 30 mins) or for highly hydrophobic drugs. |
|
Phenyl-Hexyl |
interactions. |
Superior for aromatic compounds, isomers, and conjugated systems. |
|
Cyano (CN) |
Intermediate polarity; can operate in Normal or Reverse Phase. |
Good for polar compounds; offers orthogonal selectivity to C18. |
|
Pentafluorophenyl (PFP) |
Fluorine-based interactions. |
Excellent for halogenated compounds and separating positional isomers. |
|
Polar Embedded |
Amide or carbamate group embedded in alkyl chain. |
Prevents peak tailing for basic drugs; compatible with 100% aqueous mobile phases. |
Mobile Phase Optimization
Organic Modifiers
Buffer Selection
Buffer choice is dictated by the target pH and detection method.
Gradient vs. Isocratic
Principle of HPLC :
Working Principle of RP-HPLC :
The Core Concept: Differential Migration
Instrumentation:
The contemporary design of the HPLC system consists of five critical components, which follow a path designed with the purpose of minimal band broadening.
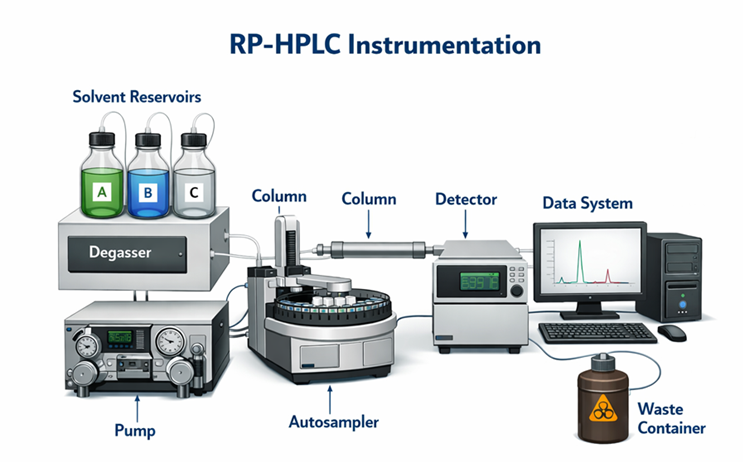
Figure 1 : Instrumentation of HPLC
RP-HPLC Method Validation Parameters:
Specificity and Selectivity:
Specificity is the ability to distinguish the analyte of interest from the expected co-existing substances like impurities, degradation products, and matrix interference. In RP-HPLC, this specificity is typically done through purity confirmation of the peak purity test using a Photo Diode Array detector, where the purity angle must be below the purity threshold. [15, 16]
Linearity and Range:
Linearity is the area of main interest in calibration, relating to the extent to which an analytical method’s response is proportional to, and increases with, an increment of sample amount within a given concentration interval. It is usually evaluated by examining the relationship of the response to concentration changes, by inspection of graphs of experimental data, or by using linear regression calculations. The results of these calculations, described by the correlation coefficient, indicate the quality of linear relationship. A linear relationship is established by using A, C, m, and b, where A is peak area, C is concentration, m is slope, and b is intercept, by A = mC + b. A value close to 1 is expected in pharmaceutical analysis. [11]
Accuracy (Recovery)
Accuracy represents the closeness of the measured value to the known value or reference value. Accuracy is commonly assessed by a series of recovery tests at three concentrations (for example, 50%, 100%, and 150%) with three injections at each concentration. [17,18]
Precision
Precision covers repeatability (intra-day), intermediate precision (inter-day) and reproducibility between labs. Precision is expressed as the Relative Standard Deviation (% RSD) in which the standard deviation is divided by the mean and multiplied by 100%. In the case of drug substances, an RSD of the standard is common. [19, 20]
Limit of Detection (LOD) and Limit of Quantitation (LOQ)
LOD is the lowest level of analyte present in the sample that can be detected but not necessarily analyzed with much precision. LOQ is the lowest level of analyte present in the sample that can be analyzed with acceptable precision as well as accuracy. [8]
Robustness
Robustness is termed as the capability of the given method to withstand slight systematic variations in the parameters, for example, changes in pH by a unit, variations in the organic phase, and changes in the temperature of the column. In essence, it is an assessment of the method’s robustness. [21]
Summary of Acceptance Criteria
The following table summarizes standard acceptance criteria widely accepted by regulatory bodies (FDA, EMA) for pharmaceutical assays. [18, 20]
Table 1: Standard Acceptance Criteria for Analytical Method Validation
|
Validation Parameter |
Acceptance Criteria (General Limit) |
Remarks |
|
System Suitability |
RSD<2.0% for peak area |
Tailing factor (T) ≤2.0; Plate count (N) >2000 |
|
Specificity |
No interference at retention time of analyte |
Peak Purity Angle < Purity Threshold |
|
Linearity |
Correlation Coefficient (R2) ≥0.999 |
Minimum 5 concentration levels |
|
Accuracy (Recovery) |
98.0%−102.0% |
Measured at 50%, 100%, 150% levels |
|
Precision (Repeatability) |
%RSD≤2.0% |
n=6 at 100% or n=9 (3x3 levels) |
|
Intermediate Precision |
%RSD≤2.0% (overall) |
Different days/analysts/equipment |
|
LOD |
Signal-to-Noise Ratio (S/N) ≈3:1 |
Or based on σ of response |
|
LOQ |
Signal-to-Noise Ratio (S/N) ≈10:1 |
Precision at LOQ should be RSD ≤10% |
|
Robustness |
System suitability must still pass |
Variations in pH, Flow, Temp, Mobile Phase |
|
Stability of Solution |
Change in response ≤2.0% over time |
typically 24-48 hours |
The Regulatory Landscape:
ICH Q1A(R2): Stability Testing of New Drug Substances and Products:
The parent guideline, ICH Q1A(R2), requires stress testing to predict probable degradation products and confirm the analytical methodology. It states that the nature of the stress testing will depend on the individual drug substance and the type of drug product involved. Stress testing has to be conducted on the drug substance (API). For the drug product formulation, this has to be conducted only if an interaction between API and excipients is suspected. [22]
ICH Q1B: Photostability Testing
In contrast to Q1A, ICH Q1B is extremely prescriptive and gives specific light sources and required exposure duration. Two different light-source configurations are proposed:
ICH Q2(R1) and Q3A/B: Validation and Impurities:
ICH Q2(R1) defines validation parameters, and Specificity is shown by peak purity analysis that is performed during stress studies. In parallel, ICH Q3A and Q3B define reporting, identification, and qualification criteria for degradation products; therefore, the need for a selective ion monitoring (SIM) approach which is able to detect impurities at very low levels, normally at 0.05% or 0.1%, is emphasized. [24, 25]
Scientific Basis and Protocols for Stress Conditions:
The design of a forced degradation study must be predictive. The following subsections detail the mechanism and recommended protocols for each stress type.
Hydrolytic Degradation [27]
Hydrolysis refers to the splitting of a molecule by its reaction with water. It is among the most frequently occurring degradation routes, particularly for pharmaceuticals containing hydrolytically sensitive functional groups such as esters, amides, lactones, and lactams. [26]
Mechanism: Protonation of electronegative atoms such as oxygen or nitrogen increases their susceptibility to nucleophilic attack by water.
Protocol: In stress testing, we usually begin by exposing the substance to 0.1 N HCl at room temperature. If after 24 hours there is no significant degradation, then the temperature can be ramped up to 60 °C. In cases where a molecule is highly stable, the acid strength can be increased to 1.0 N or even to 5.0 N HCl. The goal is usually about 5-20% degradation.
Mechanism: Hydroxide ions (OH?) function as strong nucleophiles and often promote degradation more aggressively than acidic conditions.
Protocol: Stress testing is usually begun with 0.1 N NaOH at room temperature.
Precaution: Many silica-based HPLC columns are unstable at elevated pH levels. Therefore, samples should be neutralized to around pH 7 prior to injection to avoid column damage.
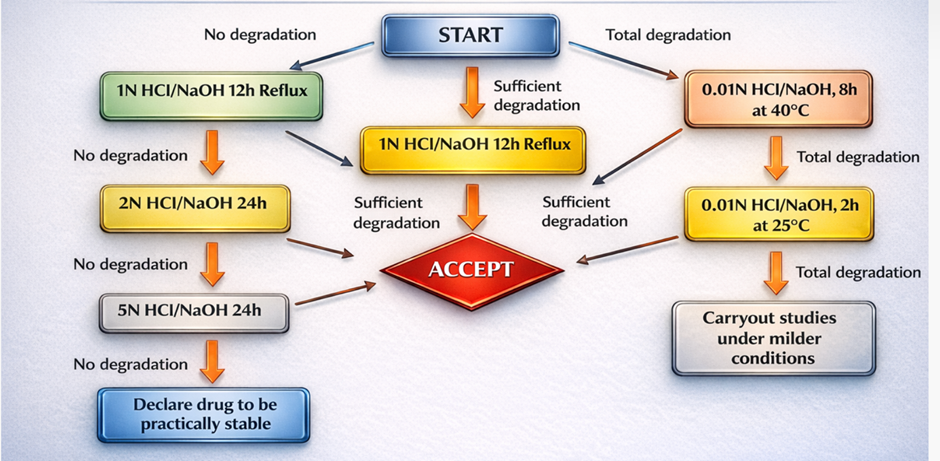
Figure 2 : Flow chart of Acidic hydrolysis and Alkaline hydrolysis
Protocol: The drug substance is refluxed in water to evaluate degradation that occurs solely due to moisture exposure, in the absence of acid or base-catalysed effects.
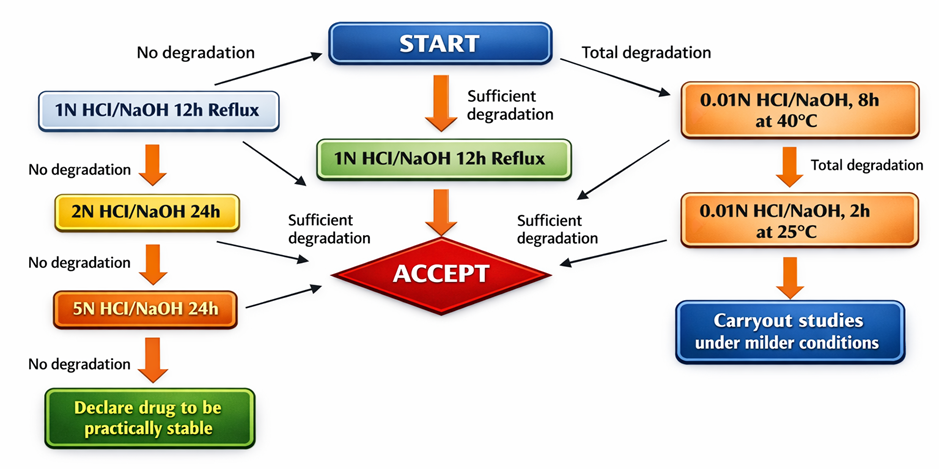
Figure 3 : Flow chart of Neutral hydrolysis
Oxidative Degradation [28]
Oxidative stress is notoriously difficult to control due to the complex nature of radical chain reactions (initiation, propagation, termination).
Application of Hydrogen Peroxide as the Standard Reagent.
Protocol: Solutions to be prepared between 0.3% to 3.0% H2
Storage: Store at room temperature and under light-excluded conditions for 7 days.
Warning: Do not heat peroxide solutions. When H2O2 is heated, hydroxyl radicals form that simulate the action of heat-induced degradation and thus may generate false results.
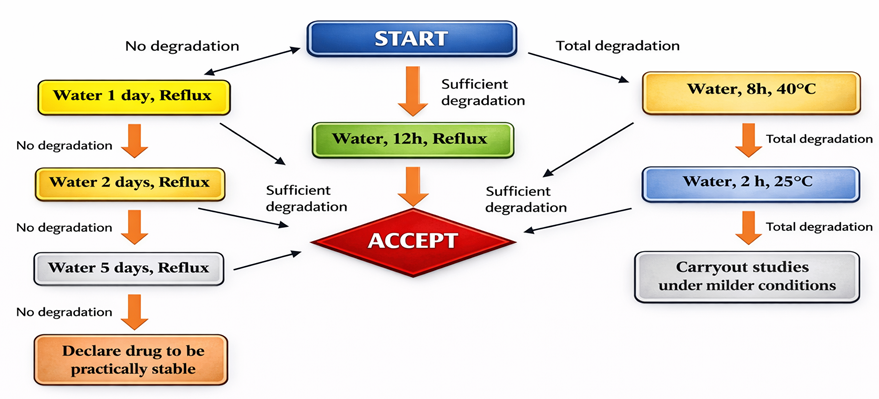
Figure 4 : Flow chart of Oxidative degradation
Photolytic Degradation:
In photolysis, the drug molecule absorbs one photon, jumping into an excited state, either a singlet state or a triplet state. In the excited state, bonds can break or rearrangements can occur.
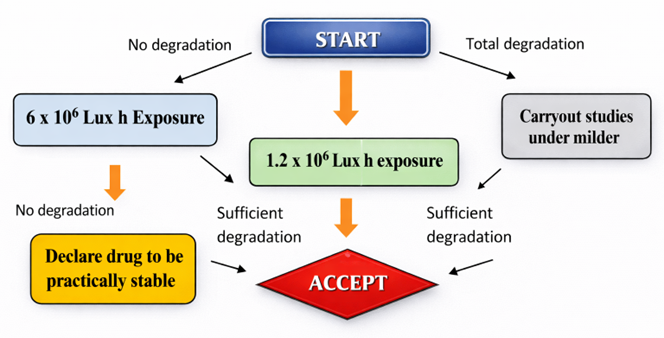
Figure 5 : Flow chart of Photolytic degradation
Table 2: Comprehensive Forced Degradation Protocol Summary
|
Stress Type |
Reagent/ Condition |
Temp |
Duration |
Precaution |
|
Acid |
0.1 N - 1.0 N HCl |
60°C |
1-48 hrs |
Neutralize before injection. |
|
Alkali |
0.1 N - 1.0 N NaOH |
RT - 60°C |
10 min - 24 hrs |
Monitor closely; often rapid. Neutralize. |
|
Oxidation |
3% -30% $H_2O_2$ |
RT |
1-24 hrs |
Peroxide peak can interfere in HPLC (early elution). |
|
Thermal (Dry) |
Oven |
80°C - 105°C |
3-10 days |
Use sealed vs. open containers to test volatility. |
|
Thermal (Wet) |
Water/Buffer slurry |
80°C |
1-5 days |
Distinguishes hydrolysis from pyrolysis. |
|
Photolytic |
UV + Visible (Q1B) |
Chamber |
~1 week |
Use Dark Control. Keep temperature controlled. |
Analytical Methodology and Validation:
Specificity and Peak Purity
The cornerstone of a SIM is specificity. The analyst must demonstrate that the API peak is spectrally pure.
Mass Balance Calculation
Mass balance is a critical quality attribute of a forced degradation study. It confirms that the loss in API correlates with the increase in degradation products.
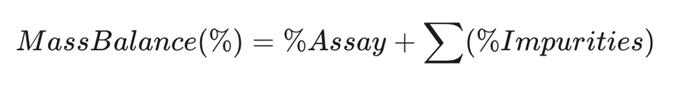
Regulatory expectations suggest mass balance should be within 95% to 105%.
Challenges and Troubleshooting:
Over-Degradation
Overdegradation of the drug by more than 20% leads to an induction of secondary degradation by causing breakdown of the main degradation product itself. This leads to an inherently complex chromatogram, contrary to actual stability. Solution: Stop the reaction as soon as it reaches an observation of 10 - 15% degradation.
Fluorescence and Precipitation
Some drugs precipitate in acidic or basic media.
CONCLUSION:
RP-HPLC still tops the list of the most reliable analytical technique for quality control purposes in the context of the pharmaceutical industry, particularly if it is rationally harmonized with ICH guidelines for the validation of analytical methods or forced degradation studies. With some good judgment in the RP-HPLC method development approaches, combined with rigorous criteria of RP-HPLC validation, i.e., specificity, precision, accuracy, robustness, and sensitivity, in good scientific judgment for the stress testing procedure, RP-HPLC can truly be a stability-indicating technique. Highlighted in the current treatment is the point that close control of the experimental parameter, the use of good judgment in the settings of the chromatographic procedure, or the help of analytical tools such as peak purity analysis and mass balance, are vital for maintaining regulatory requirements for the work.
REFERENCES


Chauhan Ajaykumar, Dalwadi Mitali, Vahoniya Mrunal, A Comprehensive Review on RP-HPLC Method Development, Validation, and Forced Degradation Studies According to ICH Guidelines, Int. J. of Pharm. Sci., 2026, Vol 4, Issue 1, 1913-1923. https://doi.org/10.5281/zenodo.18303633
 10.5281/zenodo.18303633