1Research scholar, Gujarat Technological University, Ahmedabad, Gujarat, India.
2Associate professor, Graduated School of Pharmacy, Gandhinagar, Gujarat, India
Purpose: For the simultaneous evaluation of Empagliflozin, Linagliptin, and Metformin HCl in a fixed dose combination, a recently established, precise, fast, accurate, and reliable RP-HPLC method has been developed and validated. Methods: Using a Water C18 column (250 mm x 4.6 mm id, 5µ particle size) and an optimized mobile phase combination of 1% orthophosphoric acid: ACN (40:60, %v/v) at a flow rate of 1.0 mL/min, isocratic separation was accomplished using the recommended method. The detection wavelength was determined to be 251 nm. Results: Empagliflozin, Linagliptin, and Metformin HCl were found to have retention durations of 6.482, 5.368, and 2.296 minutes, respectively. The concentration ranges of 2–10 µg/mL for Empagliflozin, 1–5 µg/mL for Linagliptin, and 200–1000 µg/mL for Metformin HCl showed linearity. Empagliflozin, Linagliptin, and Metformin HCl were found to have correlation values of 0.9998, 0.9999, and 0.9995, respectively. The computed %RSD, which was less than 2.0%, showed the accuracy and repeatability of the suggested approach. Empagliflozin, Linagliptin, and Metformin HCl were shown to have LODs and LOQs of 0.06 µg/mL and 0.059 µg/mL, 3.23 µg/mL and 0.18 µg/mL, and 0.048 µg/mL and 9.81 µg/mL, respectively. Conclusion: The proposed approach for evaluating the combination of Empagliflozin, Linagliptin, and Metformin HCl was found to be reliable, precise, easy, and robust.
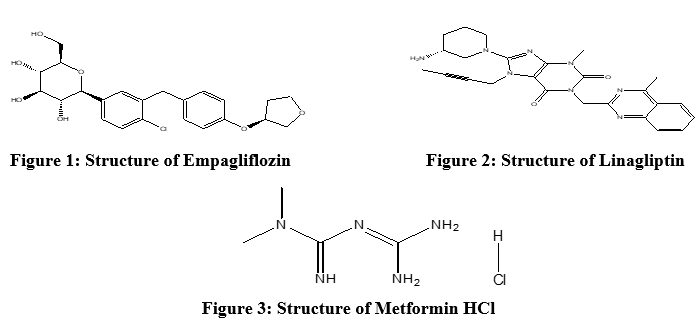
A fixed-dose combination of Empagliflozin, Linagliptin, and Metformin HCl is used to treat Type II diabetes. Taking many drugs might be difficult for some people, and they may not follow all recommended treatments. Therefore, giving Empagliflozin, Linagliptin, and Metformin HCl together as a single tablet produced an effect that was comparable to giving each medication separately. Taking all of their medications on one tablet and managing their type II diabetes may be made easier for people by this combination [1]. In January 2020, the FDA authorized the use of a triple fixed dosage combination of Empagliflozin, Linagliptin, and Metformin HCl in January 2020 [2]. Empagliflozin, a drug belonging to the SGLT-2 inhibitor family, stops SGLT-2 proteins from working in the kidney's proximal convoluted tubule. This causes a 90% recovery of glucose, a rise in the excretion of glucose in urine, and a fall in plasma glucose levels. Empagliflozin is (2S, 3R, 4R, 5S, 6R) in terms of chemistry. -2-[4-chloro] ((3S) oxolan3yl] oxyphenyl] methyl phenyl] 3-[[4-[6-(hydroxyl methyl) (hydroxyl methyl) for short 3-, 4-, 5-triol oxane. The structure of Empagliflozin is shown in Figure 1[3-4]. Linagliptin, a type of DPP-4 inhibitor, elevates glycosylated haemoglobin (HbA1c), lowers glucagon, which lowers the risk of hypoglycemia, and boosts insulin production. Chemically, Linagliptin is 8-[(3R) (3R) 1-yl-3-aminopiperidin [(4-methylquinazolin-2-yl) methyl] -7-but-2-ynyl-3-methyl (1) Purine 2, 6-dione. The structure of Linagliptin is shown in Figure 2 [5]. Intestinal glucose absorption, hepatic glucose production (gluconeogenesis), and peripheral glucose uptake and utilisation are all decreased by the biguanide medication Metformin HCl, which also improves insulin sensitivity. Chemically, Metformin HCl is 1, 1-dimethylbiguanide HCl. Figure 3 depicts the structure of Metformin HCl [6-7]. As a member of the SGLT-2 inhibitor family, the biguanide medicine Metformin HCl reduces peripheral glucose uptake and utilization, hepatic glucose synthesis (gluconeogenesis), and intestinal glucose absorption. It also enhances insulin sensitivity. 1, 1-dimethylbiguanide HCl is the chemical formula for Metformin HCl. The structure of Metformin HCl is shown in Figure 3 [21]. Numerous approaches, such as UV spectrophotometric, RP-HPLC, stability indicating RP-HPLC, HPTLC, and LC-MS/MS, have been described for dosage forms combining Empagliflozin, Linagliptin, and Metformin HCl with other drugs, according to a comprehensive review of the literature [8–20]. One RP-HPLC method has been described for the simultaneous measurement of Empagliflozin, Linagliptin, and Metformin HCl in a synthetic combination [21]. Three medications with attractive peak shapes were quickly eluted by the mobile phase used in the recommended RP-HPLC procedure. The medication's salt, metformin HCl, is a highly polar substance. Metformin was quickly eluted with the aid of the polar mobile phase. Metformin elutes after roughly two minutes using the method described, which uses acetonitrile and 1% orthophosphoric acid (60:40, %v/v) as the mobile phase. It was found that a 10-minute runtime reduced the amount of solvent used. It was found that the retention duration and runtime for metformin HCl in the method given were both 14 minutes. Thus, the proposed approach is rapid and effective. A new, quick, affordable, and easy RP-HPLC method was created and verified in the proposed study to concurrently measure Empagliflozin, Linagliptin, and Metformin HCl in fixed-dose combinations in accordance with ICH guidelines [22].
MATERIALS AND METHODS
Instruments
The DAD detector 2487 and the Water 2695 HPLC system were used to perform drug chromatographic separations. Empower 3 software was used to process the data. The three medications were separated using a Waters C18 column (250 x 4.6 mm, 5µ). A UV-visible spectrophotometer and a digital pH meter were employed.
Chemicals and reagents
The reference standards for metformin HCl, Empagliflozin, and Linagliptin were acquired from Alembic Pharmaceuticals in Gujarat, India, and Emcure Pharmaceuticals Ltd., respectively. In Gujarat, Finar Chemicals Pvt. Ltd. sold acetonitrile and methanol of HPLC quality. We went to Gujarat and bought HPLC quality water from Rankem Chemicals Limited. In Gujarat, we bought orthophosphoric acid from ACS Chemicals.
Chromatographic conditions
A Waters C18 column (250 4.6 mm id, 5µ particle size) and an optimized mobile phase consisting of 1% orthophosphoric acid: ACN (40:60, %v/v) at a flow rate of 1.0 mL/minute were used to perform the isocratic chromatographic separation. Ten microliters was the injection volume. To enable the three medications to separate, the run time was prolonged by ten minutes. It was discovered that 251 nm was the chosen wavelength.
Preparation of Standard Solutions
10 mg of Empagliflozin, 5 mg of Linagliptin, and 1000 mg of Metformin HCl were thoroughly weighed before being transferred into three different 100 mL volumetric flasks. After volume was increased to the necessary level with diluent, the final concentrations of Empagliflozin, Linagliptin, and Metformin HCl were 100 µg/mL, 50 µg/mL, and 10,000 µg/mL, respectively.
Preparation of the mobile phase
By mixing 1 mL of orthophosphoric acid with 100 mL of HPLC-grade water, you can create 1% orthophosphoric acid. After that, 60 mL of acetonitrile and 40 mL of 1% orthophosphoric acid were sonicated in an ultrasonicator. After degassing, filtered using a 0.45 µm filter.
Preparation of Diluent
The ratio of water to HPLC-grade acetonitrile was 60:40, %v/v.
Preparation of sample solution
A sample including 10 mg of Empagliflozin, 5 mg of Linagliptin, and 1000 mg of Metformin HCl was obtained using a volumetric flask with a 100 mL capacity, 60 mL of mobile phase, and 16 minutes of vigorous shaking. Diluent was added to the remaining amount until the proper level was reached. When the solution was passed through Whatman filter paper no. 42, the first few drops of the filtrate were discarded. This solution was diluted from 0.6 mL to 10 mL using the mobile phase. The solution was injected into 10 µL. At 251 nm, the regions of the resulting peak were identified.
Analytical Method Validation
ICH guidelines for system suitability, precision, specificity, linearity, accuracy, limit of detection, and limit of quantification were followed in the validation of the developed technique [22].
Specificity
By injecting the mobile phase as a blank solution, followed by a mixed drug standard solution, sample solution, and solution in a column under chromatographic conditions, the method specificity is assessed. The retention durations of the drug peaks from the chromatograms of the blank, standard, and sample solutions of Empagliflozin, Linagliptin, and Metformin HCl can then be compared to determine whether any interference caused by impurities occurred.
Linearity
To evaluate the linearity for Empagliflozin, Linearity, and Metformin HCl, calibration curves were created using mixed standard solutions of these three drugs in the ranges of 2–10 µg/mL, 1–5 µg/mL, and 200–1000 µg/mL, respectively. Empagliflozin (100 µg/mL), Linagliptin (50 µg/mL), and Metformin HCl (1000 µg/mL) stock solutions were pipetted in volumes of 0.2, 0.4, 0.6, 0.8, and 1.0 mL. Following the transfer of the solutions to a 10 mL volumetric flask, diluent was added to bring the volume up to the appropriate level.
Precision
Six replicas of a standard solution containing Empagliflozin (6 µg/mL), Linagliptin (3 µg/mL), and Metformin HCl (600 µg/mL), were injected in order to test for repeatability. A %RSD was computed after peak areas were evaluated. Three replicates of a standard solution comprising 2, 6, and 10 µg/mL of Empagliflozin, 1, 3, and 5 µg/mL of Linagliptin, and 200, 600, and 1000 µg/mL of Metformin HCl were administered on the same day in order to evaluate the intraday accuracy. To investigate inter-day precision, three identical standard solutions containing the medications, Empagliflozin (2, 6, 10 µg/mL), Linagliptin (1, 3, 5 µg/mL), and Metformin HCl (200, 600, 1000 µg/mL) were injected on separate days. Next, the %RSD was calculated.
Accuracy
Empagliflozin (6 µg/mL), Linagliptin (3 µg/mL), and Metformin HCl (600 µg/mL) medication solutions were assessed for accuracy using the standard addition technique, which involved adding standard solutions at three distinct levels. The amounts of 80%, 100%, and 120% in the sample solution, measured standard, sample area, and recovery percentage confirmed the presence of excipient interference in the dosage form.
Limit of detection (LOD) and limit of quantitation (LOQ)
An equation based on the slope and standard deviation of the intercepts of the set of three linearity calibration curves was used to calculate the LOD and LOQ. LOD = 3.3 × (SD/Slope) and LOQ = 10 × (SD/Slope) are the results of calculations for LOD and LOQ. where Slope is the mean slope of the three calibration curves and SD is the standard deviation of the Y-intercepts of the three calibration curves.
Robustness
Changing the mobile phase's flow rate (± 0.1 mL/min), ratio (± 2% v/v), and pH (± 0.05) allowed for the evaluation of the robustness of the suggested approach. The assay %, retention time, and peak area variations were computed and contrasted with the ideal response.
System suitability parameters
Five replicates of the standard solutions of Empagliflozin (6 µg/mL), Linagliptin (3 µg/mL), and Metformin HCl (600 µg/mL) were used to increase system suitability parameters. Retention time, theoretical plates, tailing factors, and resolution were recorded for each of the three medications, and the %RSD was computed.
RESULTS AND DISCUSSION
Method development
Several solvents and mobile phases, such as methanol, water, and ACN, were used to enhance the proposed approach. Several types of columns, such as Hypersil, Phemomenex, and Inertsil C18 columns, were subjected to the procedure. It was subsequently determined that the best option for chromatographic separation was a waters C18 (250 x 4.6 mm id, 5µ) column with a mobile phase of 1% orthophosphoric acid and acetonitrile (40:60, %v/v) at a flow rate of 1.0 mL/min. In addition, this column generates good responsiveness with good peak form and resolution. Empagliflozin for 6.480 minutes, Linagliptin was retained for 5.370 minutes, and Metformin HCl for 2.296 minutes. [23-26].
Selection of wavelength
The ideal wavelength is the one that reacts successfully to the substances being detected. In the present study, diluents containing pharmaceutical solutions of Empagliflozin (10 µg/mL), Linagliptin (10 µg/mL) and Metformin HCl (10 µg/mL),were produced. This medicinal solution's optimal absorbance was observed after it was scanned in the UV range of 200–400 nm. The wavelength of 251 nm was determined to be the most effective for detection. The UV spectrum seen in Figure 4.
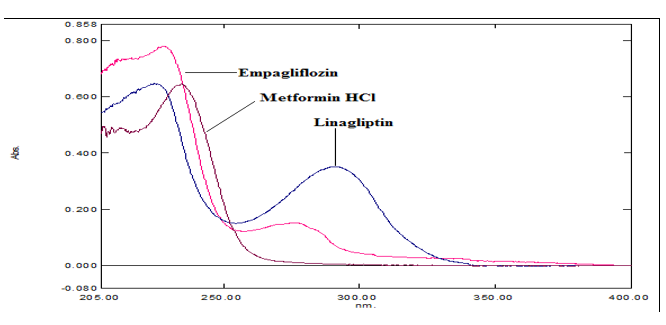
Figure 4: UV Spectra of Empaglifloz
Linagliptin and Metformin HCl
Table 1: Optimised chromatographic conditions
|
Parameters |
Chromatographic Condition |
|
Mode of elution |
Isocratic |
|
Mobile Phase |
1% orthophosphoric acid: ACN (40:60, %v/v) |
|
Column |
Water C18 (250× 4.6 mm id, 5µ) |
|
Flow rate |
1.0 mL/min |
|
Injection volume |
10 µL |
|
Detection wavelength |
251 nm |
|
Diluent |
Acetonitrile: Water (60: 40, %v/v) |
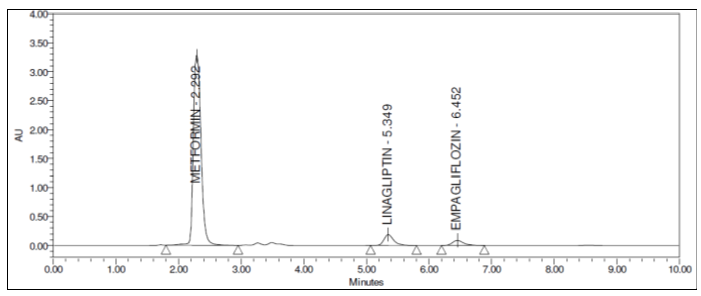
Figure 5: Optimised chromatograms of Empagliflozin, Linagliptin and Metformin HCl
Method validation
In order to validate the technique in accordance with the ICH Q2R1 guideline, a number of validation metrics, including linearity, precision, accuracy, LOD, LOQ, and robustness, were established [22].
Specificity
Analysis of the interference of dosage form excipients and any contaminants is used to determine the technique's specificity. The chromatograms of the sample, standard, and blank showed no signs of interference from the excipients. The drug solution chromatograms for the test, reference, and blank are shown in Figures 6, 7, and 8.
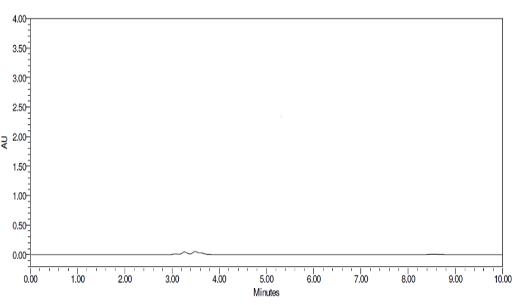
Figure 6: Chromatogram of mobile phase
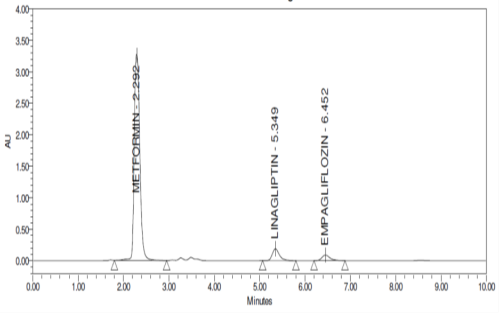
Figure 7: Chromatogram of Empagliflozin, Linagliptin and Metformin HCl standard
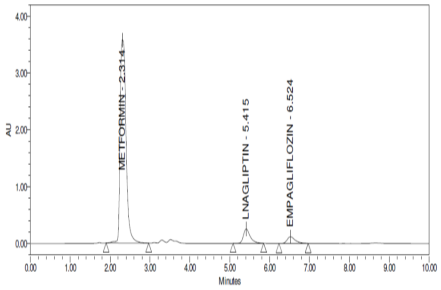
Figure 8: Chromatogram of Empagliflozin, Linagliptin and Metformin HCl samples
Linearity
The calibration curves for the drugs Empagliflozin, Linagliptin, and Metformin HCl, with concentration ranges of 2-10 µg/mL, 1-5 µg/mL, and 200-1000 µg/mL, respectively, were used to acquire the linearity data. The slope, correlation coefficient, and intercept of the linear response are illustrated in drug calibration curves. Figures 9, 10, 11, and 12 as well as Table 2 & 3 provides the results information.
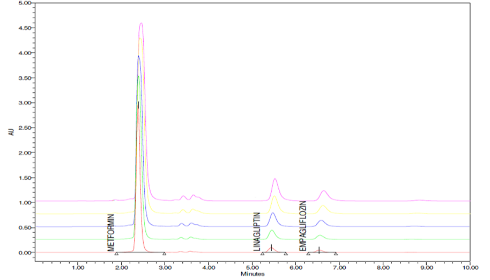
Figure 9: Overlain chromatogram of Empagliflozin, Linagliptin and Metformin HCl
Table 2: Results of Linearity study
|
Sr No |
Empagliflozin |
Linagliptin |
Metformin HCl |
||||||
|
Conc. (µg/mL) |
Area (AU) Mean ± SD (n=3) |
% RSD |
Conc. (µg/mL) |
Area (AU) Mean ± SD (n=3) |
% RSD |
Conc. (µg/mL) |
Area (AU) Mean ± SD (n=3) |
% RSD |
|
|
1 |
2 |
549351 ± 580.52 |
0.105 |
1 |
985672 ± 1005.50 |
0.101 |
200 |
20015786 ± 23000.71 |
0.116 |
|
2 |
4 |
1118490 ± 2118.84 |
0.189 |
2 |
2008028 ± 3214.86 |
0.160 |
400 |
26067976 ± 38023.35 |
0.145 |
|
3 |
6 |
1665619 ± 4083.16 |
0.245 |
3 |
2972551 ± 5509.56 |
0.183 |
600 |
31270965 ± 52950.17 |
0.169 |
|
4 |
8 |
2192508 ± 8015.90 |
0.365 |
4 |
3980593 ± 8024.35 |
0.201 |
800 |
36915896 ± 68118.54 |
0.184 |
|
5 |
10 |
2795432 ± 12738.04 |
0.455 |
5 |
5011378 ± 11376.61 |
0.227 |
1000 |
42425175 ± 100011.01 |
0.235 |
Table 3: Results of the linearity study
|
Parameters |
Empagliflozin |
Linagliptin |
Metformin HCl |
|
Linearity range |
2-10 µg/mL |
1-5 µg/mL |
200-600 µg/mL |
|
Slope |
2,77,910.85 |
10,00,861.71 |
26,688.21 |
|
Intercept |
- 2,654.28 |
- 5,560.28 |
1,53,93,257.80 |
|
Correlation coefficient(r2) |
0.9998 |
0.9999 |
0.9995 |
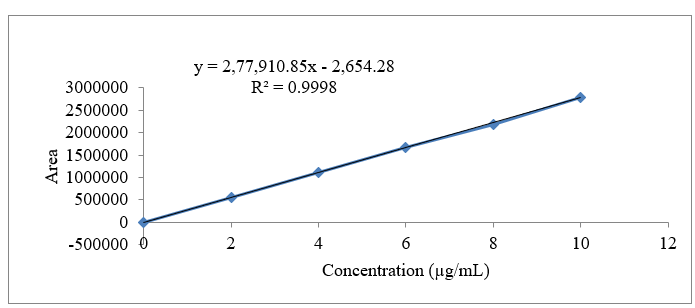
Figure 10: Calibration curve of Empagliflozin at 251 nm
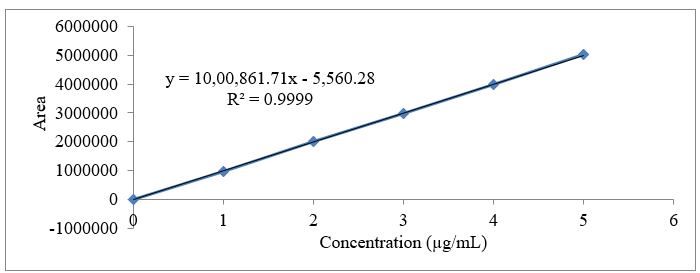
Figure 11: Calibration curve of Linagliptin at 251 nm
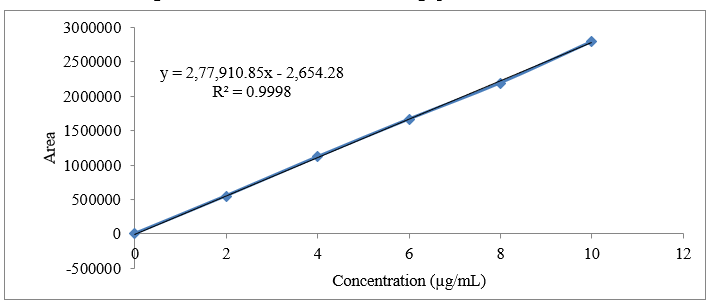
Figure 12: Calibration curve of Metformin HCl at 251 nm
Precision
Intraday and interday were employed to achieve repeatability and accuracy.
Repeatability
In order to attain accuracy and repeatability, intraday and interday were employed. In accordance with six replicates of identical concentrations of the drugs, Empagliflozin (6 µg/mL), Linagliptin (3 µg/mL), and Metformin HCl (600 µg/mL) in that order. Less than 2.0 was the computed percentage RSD. The details are shown in Tables 4.
Table 4: Results of repeatability study
|
Drug |
Conc. (µg/mL) |
Mean Peak Area (n=6) ±SD, % RSD |
Amount found ±SD, % RSD |
%Amount found ±SD, % RSD |
|
Empagliflozin |
6 |
1677024 ± 1419.26,0.088 |
6.06 ± 0.005, 0.088 |
100.10 ± 0.089,0.088 |
|
Linagliptin |
3 |
3019710.5 ± 1519.15, 0.050 |
3.02 ± 0.001,0.050 |
100.78 ± 0.050,0.050 |
|
Metformin HCl |
600 |
31283568 ± 19773.61, 0.063 |
597.41 ± 0.721, 0.12 |
99.56 ± 0.12,0.12 |
Table 5: Results of the intermediate precision study
|
Concentration (µg/mL) |
Intraday Precision |
Inter day Precision |
||||||
|
Mean Peak Area (n=3) ±SD, % RSD |
Mean Peak Area (n=3) ± SD, % RSD |
|||||||
|
EMPA |
LINA |
MET |
EMPA |
LINA |
MET |
EMPA |
LINA |
MET |
|
2 |
1 |
200 |
542410 ± 1395.67, 0.257 |
987780 ± 609.53, 0.061 |
19702499 ± 89483.67, 0.454 |
536819.33 ± 2349.45, 0.437 |
979343 ± 1009.25, 0.103 |
19175424.6±120041.71, 0.62 |
|
4 |
3 |
600 |
1671411 ± 6983.70, 0.417 |
2969771 ± 2662.01, 0.089 |
31107184 ± 160314.26, 0.51 |
16533430.6 ± 91247.9 ,0.55 |
29556797 ± 102533.68,0.34 |
31479746 ± 259970.43, 0.82 |
|
6 |
5 |
1000 |
2769560 ± 16713.39, 0.603 |
5013476 ± 8838.68, 0.176 |
41823550 ± 267651.56, 0.63 |
2742623.6 ± 19183.78, 0.69 |
49862734 ± 184521.58,0.37 |
31179432.6 ± 278041.9, 0.89 |
Accuracy
The accuracy of the approach was assessed using recovery trials at three levels of standard addition using commercially available formulations. The recovery percentages for Empagliflozin, Linagliptin, and Metformin HCl, ranged from 99 to 100%. There was no evidence of interference from the excipients in the dose form. Table 6 displays the results.
Table 6: Results of the recovery study
|
Drug |
Conc.* Level (%) |
Sample amount (?g/mL) |
Amount Added (?g/mL) |
Amount found (?g/mL) |
Amount recovered (?g/mL) |
% Recovery |
%RSD |
|
Empagliflozin |
80% |
6 |
4.8 |
10.81 |
4.81 |
100.14 |
0.15 |
|
100% |
6 |
6.0 |
12.02 |
6.01 |
100.29 |
0.16 |
|
|
120% |
6 |
7.2 |
13.24 |
7.22 |
100.41 |
0.17 |
|
|
Linagliptin |
80% |
3 |
2.4 |
5.40 |
2.40 |
100.17 |
0.27 |
|
100% |
3 |
3.0 |
6.01 |
3.00 |
100.21 |
0.15 |
|
|
120% |
3 |
3.6 |
6.61 |
3.60 |
100.20 |
0.14 |
|
|
Metformin HCl |
80% |
600 |
480 |
1081.69 |
481.89 |
100.18 |
0.17 |
|
100% |
600 |
600 |
1201.98 |
601.54 |
100.09 |
0.19 |
|
|
120% |
600 |
720 |
1322.69 |
721.89 |
100.21 |
0.11 |
*Concentration
LOD and LOQ
The calibration curve was used five times before the standard deviation (SD) of the intercepts was determined. In Table 7, the LOD and LOQ values are displayed.
Table 7: Results of the LOD and LOQ study
|
Parameters |
Empagliflozin |
Linagliptin |
Metformin HCl |
|
LOD(µg/mL) |
0.06 |
0.015 |
3.23 |
|
LOQ(µg/mL) |
0.18 |
0.048 |
9.81 |
Robustness
By altering the mobile phase's pH, composition, and flow rate, robustness was assessed for Empagliflozin (6 µg/mL), Linagliptin (3 µg/mL), and Metformin HCl (600 µg/mL). The results obtained from the changes were found to be desirable. It was concluded that the RSD was below 2.0%. The findings are displayed in Table 8.
Table 8: Results of the robustness study
|
Parameters |
Condition |
Empagliflozin |
Linagliptin |
Metformin HCl |
||||||
|
Mean Area ±SD (n=3) |
% RSD |
% Assay |
Mean Area ±SD (n=3) |
% RSD |
% Assay |
Mean Area ±SD (n=3) |
% RSD |
% Assay |
||
|
Flow rate ±0.1 mL/min |
0.9 |
1662616 ± 605.97 |
0.036 |
100.30 |
29934736 ± 2886.34 |
0.09 |
99.91 |
31282520 ±48401.55 |
0.15 |
99.66 |
|
1.0 |
1665619 ±4083.14 |
0.026 |
100.50 |
2994551 ± 5509.56 |
0.18 |
100.7 |
31416901±34106.87 |
0.10 |
100.3 |
|
|
1.1 |
1669420 ± 384.69 |
0.023 |
99.90 |
3006788 ± 6923.02 |
0.23 |
100.3 |
31358698±69054.91 |
0.22 |
100.1 |
|
|
Mobile phase ±2%v/v |
42:58 |
1676512 ± 410.17 |
0.024 |
100.73 |
2980205 ± 3695.93 |
0.12 |
99.47 |
31534969±58257.686 |
0.18 |
99.47 |
|
40:60 |
1665619 ±4083.14 |
0.026 |
100.50 |
2994551 ± 5509.56 |
0.18 |
100.7 |
31416901±34106.87 |
0.10 |
100.3 |
|
|
38:62 |
1659304± 492.97 |
0.029 |
99.70 |
3022286 ±8235.6 |
0.27 |
100.8 |
31408969±72649.87 |
0.23 |
100.4 |
|
|
pH 0.05 |
1.95 |
1673926± 441.66 |
0.025 |
100.57 |
3028514 ± 6687.45 |
0.22 |
100.0 |
31387393±49507.70 |
0.15 |
100.2 |
|
2.0 |
1665619 ±4083.14 |
0.026 |
100.50 |
2994551 ± 5509.56 |
0.18 |
100.7 |
31416901±34106.87 |
0.10 |
100.3 |
|
|
2.05 |
1675603± 342.37 |
0.020 |
100.67 |
3008209 ±2650.16 |
0.08 |
100.4 |
31410727±40085.77 |
0.12 |
100.4 |
|
System suitability parameters
The suggested method was utilised to determine the retention time, theoretical plates, tailing factor, and resolution; the results were deemed to be acceptable [23]. Table 9 illustrates results.
Table 9: System suitability parameters
|
Parameters |
Empagliflozin |
Linagliptin |
Metformin HCl |
|
(n=5) |
Observation ± SD, % RSD |
Observation ± SD, % RSD |
Observation ± SD, % RSD |
|
Retention Time (min) |
6.482 ± 0.008, 0.12 |
5.368 ±0.009, 0.17 |
2.296 ±0.0035, 0.15 |
|
Theoretical Plates |
6419.6± 26.13, 0.40 |
6167.3 ± 23.51, 0.38 |
4410.4 ±6.228, 0.14 |
|
Tailing factor |
1.3 ± 0.010, 0.82 |
1.4 ± 0.008, 0.59 |
1.21 ± 0.0089, 0.73 |
|
Resolution |
3.8 ±0.019, 0.51 |
11.6 ± 0.054, 0.47 |
- |
Assay of dosage form by the proposed method
An analysis of a fixed dosage combination (Trijardy® XR) containing 10 mg of Empagliflozin, 5 mg of Linagliptin, and 1000 mg of Metformin HCl was conducted by producing three duplicates of the same concentration of the standard and sample drugs [23].
Table 10: Analysis of dosage form
|
Label Claim (mg/tablet) |
Assay (Content in mg) |
% Assay (Mean* ± S.D, n=5) |
||||||
|
EMPA* |
LINA** |
MET*** |
EMPA |
LINA |
MET |
EMPA |
LINA |
MET |
|
10 |
5 |
1000 |
10.1 |
5 |
1001.23 |
100.17± 0.22 |
100.01 ± 0.017 |
100.12 ± 0.13 |
Empagliflozin
** Linagliptin
*** Metformin HCl
These results indicate the newly developed method's accuracy, precision, usability, and quickness. It may be used for the routine analysis of dosage formulations.
CONCLUSION
The recommended RP-HPLC technique was created and verified in compliance with ICH recommendations. A mobile phase of 1% orthophosphoric acid and acetonitrile (40:60 v/v) was used for chromatographic separation. Empagliflozin, Linagliptin, and Metformin HCl had respective co-efficients of correlation of 0.9991, 0.9991, and 0.9995 at 251 nm, indicating that the method was linear in the practical ranges of 2–10 µg/mL, 1–5 µg/mL, and 200–1000 µg/mL. Empagliflozin, Linagliptin, and Metformin HCl were all found to be accurately, precisely, and quickly estimated using the proposed method. Empagliflozin, Linagliptin, and Metformin HCl could be calculated fast, correctly, and efficiently using the method that was given. The technique's sensitivity is demonstrated by the obtained detection and quantification limits. The precision of the developed method. Acceptable percentage RSD readings and high recoveries speak to the accuracy and precision of the established approach. For routine examination of the fixed dosage combination of Empagliflozin, Linagliptin, and Metformin HCl, the assay's results demonstrate that the approach can be successfully implemented and used without interference.
ACKNOWLEDGEMENT
Dr. C.N. Patel and Dr. Ankit Chaudhary have the author's deepest gratitude for their assistance and encouragement in his study.
REFERENCES


Neha Mochi, Dr. Rajesh Patel*, A Novel RP-HPLC-DAD Method Development and Validation for The Concurrent Quantification of Empagliflozin, Linagliptin and Metformin HCl In a Fixed Dose Combination, Int. J. of Pharm. Sci., 2025, Vol 3, Issue 1, 431-443. https://doi.org/10.5281/zenodo.14609205
 10.5281/zenodo.14609205
