
We use cookies to ensure our website works properly and to personalise your experience. Cookies policy
Sarada Vilas College of Pharmacy, Mysuru, Karnataka, India.
This research centers on the development and characterization of transdermal patches containing Astragaloside IV, employing hydroxypropyl methylcellulose (HPMC) and polyvinylpyrrolidone (PVP) as the primary polymers. The objective of the study was to design a topical patch system that enhances stability, sustained drug release, skin compatibility, and patient compliance. Multiple patch formulations (F1–F5) were prepared using variable ratios of HPMC and PVP, then systematically evaluated for their physicochemical properties, including organoleptic characteristics, FTIR spectroscopy, microscopic uniformity, thickness, weight, tensile strength, folding endurance, moisture content, drug content, pH, flexibility, and in vitro drug release. Astragaloside IV was confirmed to be a white to off white, odorless crystalline powder with high solubility in methanol, ethanol, and DMSO. UV spectrophotometric analysis established ?max at 256 nm in methanol. FTIR and DSC studies showed no drug–polymer incompatibility. Microscopy revealed smooth, homogeneous films without visible defects. Drug content was consistent across batches (96.9–98.4%), confirming uniform incorporation. The optimized formulation showed cumulative release above 93.25?±?0.474 after 12?hours, with kinetics fitting first-order and Korsmeyer–Peppas models, indicating diffusion-controlled sustained release. Stability studies confirmed integrity and efficacy under accelerated conditions, demonstrating successful development of stable hydrophilic polymer-based patches for prolonged topical delivery of Astragaloside?IV.
The development of novel drug delivery systems is a key focus in pharmaceutical research, aimed at overcoming the limitations of conventional oral and parenteral routes. Although oral administration is convenient and preferred by patients, it is limited by enzymatic degradation in the gastrointestinal tract, poor absorption, first-pass metabolism, and gastrointestinal irritation. These issues often necessitate higher or more frequent dosing, reducing therapeutic efficacy and increasing side effects. Parenteral delivery bypasses first-pass metabolism and provides rapid action but is invasive, painful, and associated with infection risk and poor compliance, particularly in paediatric and geriatric patients.1. Transdermal Drug Delivery Systems (TDDS) have emerged as a promising alternative. They offer controlled and sustained drug release, avoidance of hepatic metabolism, reduced dosing frequency, and improved adherence. While the concept originated in traditional medicine through medicated plasters, modern TDDS have evolved into advanced, patient-friendly systems. However, the skin—especially the stratum corneum—poses a significant barrier. Only drugs with favourable physicochemical properties, such as low molecular weight and balanced lipophilicity, can permeate effectively. To enhance penetration, permeation enhancers and novel carrier systems are often employed.1. Recent advancements have improved the feasibility of TDDS, with more than 20 patches approved worldwide for conditions such as pain, hormonal imbalance, and cardiovascular diseases. Nearly 40% of new drug candidates are now exploring dermal or transdermal routes, highlighting their growing importance. TDDS may act locally (dermal) or systemically, the latter providing controlled delivery into systemic circulation while remaining non-invasive.1. In conclusion, TDDS represent a rapidly advancing approach that can improve therapeutic outcomes by enhancing efficacy, safety, and patient compliance. This thesis focuses on formulation strategies, permeability challenges, and recent technological innovations in TDDS. Greater understanding of skin–drug interactions and integration of nanotechnology are expected to further expand their clinical potential in the near future.2
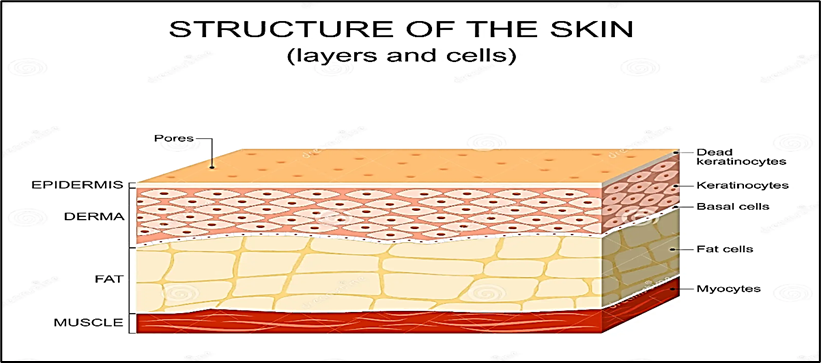
Figure 1: Structure Of Skin2
Skin as a Site of Percutaneous Absorption
Human skin, covering nearly 2 m² in adults, is composed of three primary layers: the epidermis, dermis, and subcutaneous tissue. The outermost layer of the epidermis, the stratum corneum (SC), is only 10–20 µm thick but represents the major barrier to percutaneous absorption. It consists of keratin-filled, flattened corneocytes embedded in a lipid matrix arranged in alternating hydrophilic and lipophilic lamellae. This “brick-and-mortar” structure effectively restricts the penetration of most xenobiotics. The viable epidermis beneath is more permeable but lacks vasculature, receiving nutrients by diffusion from the dermal capillaries. The dermis, rich in blood vessels and connective tissue, represents the site of systemic absorption, while the underlying subcutaneous tissue provides cushioning and thermal regulation.3
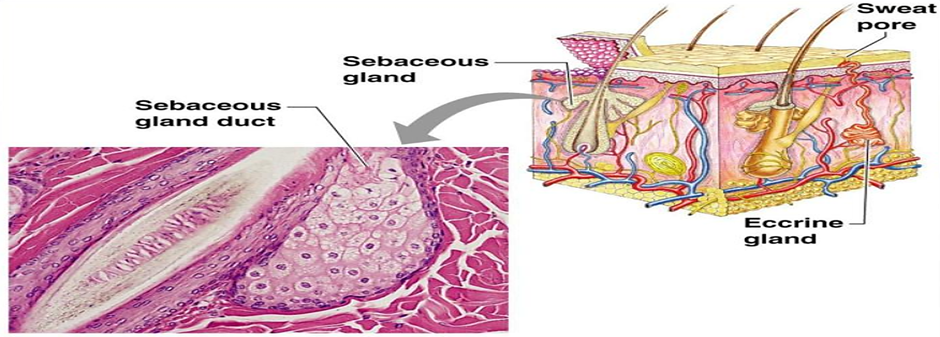
Figure 2: Skin appendages and their associated structures
Drug molecules can traverse the skin by three main pathways: (i) the transcellular route through corneocytes, favouring hydrophilic molecules; (ii) the intercellular lipid route, favouring lipophilic compounds; and (iii) appendageal pathways through hair follicles and sweat glands, which represent only ~0.1% of the surface but can provide entry sites for ions, macromolecules, or particulate carriers. However, the SC barrier remains the dominant determinant of absorption, and most drug candidates fail to reach therapeutic systemic levels without additional formulation strategies.4
Mechanism Of Percutaneous Penetration4
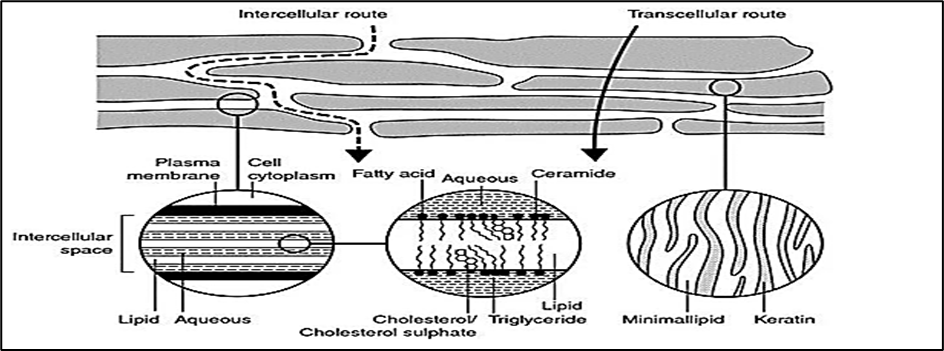
Figure 3: Simplified diagram of stratum corneum and two micro-routes of drug penetration
2. Aim And Objective:
A) Aim:
To design, optimize, and evaluate a safe, stable, and patient-friendly transdermal drug delivery system (TDDS) of Astragaloside IV
B) Objectives Of the Study:
The present work is undertaken with the following objectives:
3. MATERIALS AND METHODS
A) MATERIALS
Astragaloside IV was obtained from Dham Tec Pharm and Consultant (Mumbai, India). Hydroxypropyl methylcellulose (HPMC) was purchased from Otto Chemika-Biochemical Reagents (Mumbai, India). Polyvinylpyrrolidone K30 (PVP K30), polyethylene glycol (PEG), oleic acid, and glycerine were supplied by Karnataka Fine Chemicals (Bangalore, India). Ethanol was procured from Bio Liqua Research Pvt. Ltd. (Bangalore, India).
B) METHODOLOGY
Preformulation studies
Preformulation studies are critical in the development of a transdermal drug delivery system (TDDS). They provide information on the physicochemical properties of the drug, excipient compatibility, and suitability for incorporation into the patch matrix. The following parameters are typically evaluated7
Organoleptic properties
Astragaloside IV’s organoleptic properties, including appearance, colour, and odour, were characterized using descriptive methods; taste assessment was not performed due to API safety policy. 7
Determination of melting point
“A small quantity of Astragaloside IV was introduced into a capillary tube sealed at one end and placed in a melting point apparatus. The temperature at which the sample softened and decomposed was carefully recorded. The procedure was repeated three times, and the average decomposition/melting point was reported.8
Solubility Analysis 9
Astragaloside IV’s solubility will be tested in various solvents, including water, methanol, ethanol, propylene glycol, PEG-400, and DMSO.
Calibration Curve of Astragaloside ? 10-12
A calibration curve of Astragaloside IV was constructed using the UV–visible spectrophotometric method. Precisely 50 mg of Astragaloside IV was weighed and transferred into a 50.0 mL volumetric flask, dissolved in HPLC-grade methanol, and diluted to volume to obtain a stock solution of 1000 µg·mL?¹. The stock solution was stored at 2–8 °C and protected from light. The UV spectrum of the stock solution was scanned between 200 and 800 nm using a Shimadzu UV-2450 spectrophotometer, The Maximum absorption wavelength (λ max) was identified. From the stock, working standard solutions of 5, 10, 15, 20 and 25 µg·mL?¹ were prepared from the stock by appropriate dilution in methanol; all solutions were filtered through 0.22 µm syringe filters prior to measurement. The absorbance of each standard (measured in triplicate) was recorded at 256 nm versus a methanol blank. A calibration curve was constructed by plotting concentration (µg·mL?¹) on the X-axis against mean absorbance on the Y-axis.
Drug-excipient compatibility studies by FTIR. 13-17
The drug-polymer and polymer-polymer interactions of Astragaloside IV were investigated using an FTIR spectrometer. Approximately 100 mg of dried potassium bromide (KBr) was added after the drug and polymer were finely ground and blended together in a mortar and pestle to ensure uniform mixing. The mixture was then compressed into a transparent disc using an evacuable die under high pressure. A hydraulic press can also be employed as a simpler alternative to prepare suitable KBr pellets. Baseline correction was carried out using pure, dried KBr. Finally, the prepared drug KBr discs were scanned in the spectral range of 4000–400 cm?¹ to identify possible interactions.
Differential Scanning Calorimetry 18
DSC studies of pure Astragaloside IV were performed. Precisely weighed samples were placed in DSC aluminium pans, and heating curves were recorded over a temperature range of 40–350 °C at a heating rate of 10 °C/min under an inert nitrogen atmosphere. The DSC thermograms were obtained using calibrated differential scanning calorimeters to analyse phase transitions and confirm drug purity and thermal stability.
Formulation of transdermal patches of Astragaloside ? 19-23
The transdermal patches of Astragaloside IV were prepared by the solvent-casting technique. As shown in Table 3, polymeric films were formulated using hydroxypropyl methylcellulose (HPMC) and polyvinylpyrrolidone (PVP) in varying ratios, maintaining a total polymer weight of 300 mg. The polymers were dissolved in ethanol: water (80:20 v/v) under magnetic stirring, and polyethylene glycol 400 (30% w/w of total polymer weight) was added as a plasticizer. Astragaloside IV (15 mg/patch), pre-dissolved in a small quantity of ethanol or DMSO, was incorporated into the polymeric solution with gentle stirring for 10 minutes. The mixture was cast onto clean polyester backing films fixed in Petri plates, covered with inverted funnels, and dried overnight at room temperature. Dried patches were peeled off, inspected for uniformity, cut to the desired size, and stored in a desiccator until further evaluation.
Table 1: Composition of Transdermal patches of Astragaloside ?
|
Ingredients |
Formulation code |
||||
|
F1 |
F2 |
F3 |
F4 |
F5 |
|
|
Astragaloside ? (mg) |
15 |
15 |
15 |
15 |
15 |
|
HPMC (mg) |
250 |
235 |
220 |
185 |
170 |
|
PVP (mg) |
50 |
65 |
80 |
115 |
130 |
|
PEG 400 (ml) |
2 |
2 |
2 |
2 |
2 |
|
Oleic Acid(ml) |
1 |
1 |
1 |
1 |
1 |
|
Ethanol: water |
12 |
12 |
12 |
12 |
12 |
4. Evaluation of Transdermal patches of Astragaloside ?:
Physical appearance 24
The colour, clarity, flexibility, and smoothness of each prepared transdermal patch were evaluated.
Thickness of the patch 24
Using a screw gauge, three distinct patch thicknesses were measured, and mean values were calculated.
Weight Uniformity 24
The patches measuring 1 × 1 cm2 were cut and weighed using an electronic balance. The average weight was calculated and recorded.
Tensile strength 21
The tensile strength of the patches was evaluated using a Universal Strength Testing Machine with a sensitivity of 1 gram. The instrument was equipped with two load cell grips, in which the lower grip remained fixed while the upper grip was movable. A test film of dimensions 4 × 1 cm² was placed between the grips, and a gradually increasing force was applied until the film ruptured. The tensile strength of the film was then determined from the kilogram dial reading. Tensile strength is expressed as follows.
Folding endurance 20
Folding endurance of the prepared films was evaluated manually. A strip of film (5 × 5 cm) was repeatedly folded at the same position until it broke. The total number of folds a film could withstand at the same spot without breaking or cracking was recorded as its folding endurance.
Percentage moisture absorption 20
The patches were accurately weighed and placed in a desiccator containing saturated potassium chloride solution, maintained at room temperature to provide 80–90% relative humidity. They were stored until a constant weight was obtained, after which the patches were removed and reweighed. The percentage of moisture uptake was calculated from the difference between the initial and final weights, relative to the initial weight.
Percentage moisture loss 23
The patches were individually weighed and placed in a desiccator containing anhydrous calcium chloride at room temperature. Once a constant weight was achieved, the final weight was noted. The percentage of moisture loss was calculated by comparing the difference between the initial and final weights with respect to the initial weight.
Drug Content 25
A patch of 1 cm² was accurately cut and placed in a 50 mL volumetric flask containing 10 mL of phosphate buffer (pH 7.4). The dispersion was stirred continuously for 4h and then kept undisturbed overnight to ensure complete extraction of the drug from the patch. The absorbance of the obtained solution was recorded at 256 nm using a UV–Visible spectrophotometer, with the respective buffer used as blank. To ensure reproducibility and reliability, the procedure was repeated five times.
In-vitro drug release kinetics 25
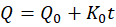
The in vitro drug release kinetics of the formulated transdermal patches were analyzed by fitting the release data to different mathematical models, namely zero-order, first-order, Higuchi, and Korsmeyer–Peppas equations, to determine the predominant release mechanism of Astragaloside IV. The zero-order model describes a constant rate of drug release independent of concentration, expressed as Q=Q0+K0t


Stability Studies 26
The stability of the prepared Astragaloside IV transdermal patches was evaluated under accelerated storage conditions to assess their reliability and predict long-term performance. To protect them from light, air, and moisture, the patches were sealed in laminated aluminium foil pouches. As per ICH guidelines, samples were stored at 40 ± 2 °C and 75 ± 5% RH for three months, with evaluations carried out at predetermined intervals—Day 0, Day 15, 1 month, 2 months, and 3 months.
a) Preformulation studies
Organoleptic properties
Table 2: Organoleptic Properties of Astragaloside ?
|
Sl. No. |
Parameter |
Specification |
Results |
|
1. |
Colour |
White to off-white |
Complies |
|
2. |
Odour |
Odourless |
Complies |
|
3. |
Taste |
Slightly bitter |
Complies |
|
4. |
Appearance |
Crystalline powder |
Complies |
Melting point of Astragaloside ?
The reported melting point of Astragaloside ? was found by the capillary technique to be 245 –254°C
Solubility Analysis
The solubility of the drug was assessed in various solvents to identify a suitable medium capable of dissolving both the drug and the excipients used in formulation. Factors such as pH, ionic strength, temperature, and buffer concentration are known to influence the solubility of a drug. The results are shown in the table number 3.
Table 3: Solubility data of Astragaloside ?
|
Sl. No. |
Solvent |
Solubility |
|
1 |
Methanol |
Very soluble |
|
2 |
Ethanol |
Very soluble |
|
3 |
Ethyl acetate |
Slightly soluble |
|
4 |
Dimethyl Sulfoxide. |
Freely soluble |
|
5 |
Chloroform |
Slightly soluble |
|
6 |
Water |
Very slightly soluble |
Calibration Curve of Astragaloside ?
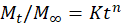
The maximum absorption of the Astragaloside IV solution, which was scanned between 200 to 800 nm, occurred at 256 nm. Utilizing a UV–visible spectrophotometer, the absorbance of the prepared solution was measured at 256 nm.
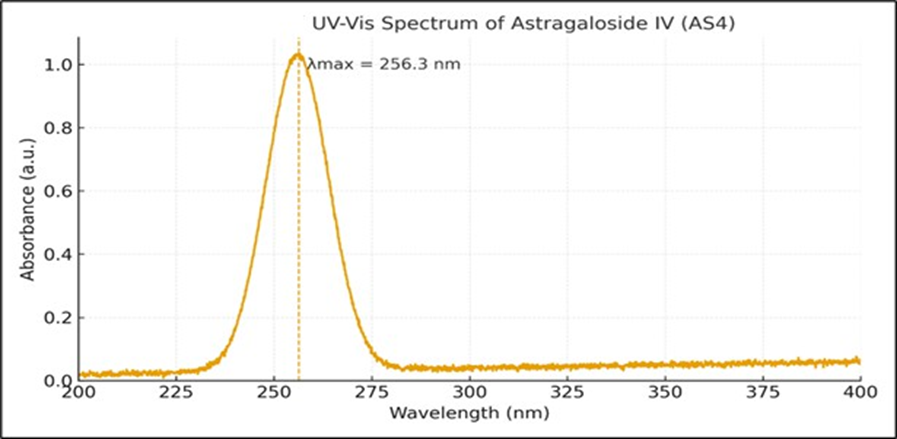
Figure 4: Absorption maxima of Astragaloside ?
The wavelength of maximum absorption (λmax) in methanol was found to be 256.3 nm.
Table 4: Data for calibration Curve of Astragaloside ? in Methanol
|
Sl. No. |
Concentration(µg/mL) |
Absorbance (λ = 256 nm) |
|
1. |
0 |
0.000 |
|
2. |
5 |
0.161 |
|
3. |
10 |
0.321 |
|
4. |
15 |
0.481 |
|
5. |
20 |
0.641 |
|
6. |
25 |
0.801 |
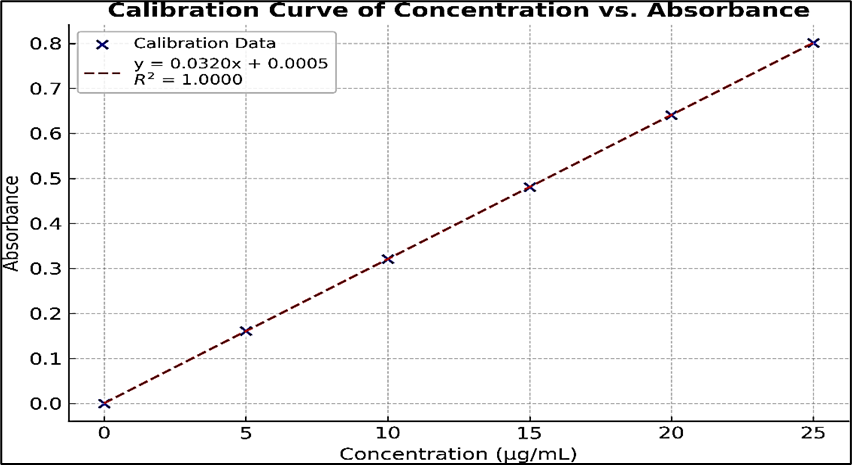
Figure 5: Calibration Curve of Astragaloside ?
The maximum absorption (λmax) of Astragaloside IV in methanol was observed at 256 nm. Its deplicated in the figure number 7. A calibration curve was constructed by plotting absorbance versus concentration. The regression equation was found to be y = 0.0320x + 0.0005, with a correlation coefficient (r² = 1.0000), indicating perfect linearity and confirming the method’s reliability for quantitative analysis. The results are shown in the figure number 5 and table number 4.
Drug-excipient compatibility studies by FTIR
Figure 6: FTIR Spectrum of Astragaloside ? Figure 7: FTIR Spectrum of HP

Figure8: FTIR Spectrum of Polyvinylpyrrolidone k 30

Figure 9: FTIR spectrum of physical mixture of Astragaloside ?
Table 5: FTIR Peaks of Astragaloside ?
|
Reference Peaks (CM-1) |
Obtained Peaks (CM-1) |
Functional Groups |
|
3400–3200 |
3375.24 |
O–H stretching |
|
2940–2850 |
2925.18 |
C–H stretching |
|
1725–1700 |
1712.38 |
C=O stretching |
|
1670–1600 |
1635.42 |
C=C bending |
|
1450–1375 |
1384.26 |
C–O–C stretching |
|
1250–1050 |
1076.58 |
C–H bending |
|
900–750 |
861.58 |
Anomeric region |
Table 6: Comparative FTIR spectral data of drug and excipients
|
Obtained peaks (cm-1) |
Obtained peaks (cm-1) of physical mixture |
Functional groups |
|
3375.24 |
3591.46 |
O–H stretching |
|
2925.18 |
3358.07 |
C–H stretching |
|
1712.38 |
2839.22 |
C=O stretching |
|
1635.42 |
1666.50 |
C=C bending |
|
1384.26 |
1301.95 |
C–O–C stretching |
|
1076.58 |
1242.16 |
C–H bending |
|
861.58 |
889.26 |
Anomeric region |
The peaks observed in the FTIR spectra correspond to the characteristic functional groups of Astragaloside IV, confirming the identity of the drug. Both the FTIR spectra of pure Astragaloside IV and the physical mixture with polymers show similar peak patterns and positions. The physical mixture’s FTIR peaks remain consistent with those of the pure drug, indicating that there is no significant interaction between Astragaloside IV and the polymers used. This confirms the compatibility and physical mixing of the drug with the polymer matrix without chemical modification.
Differential Scanning Calorimetry of Astragaloside ?
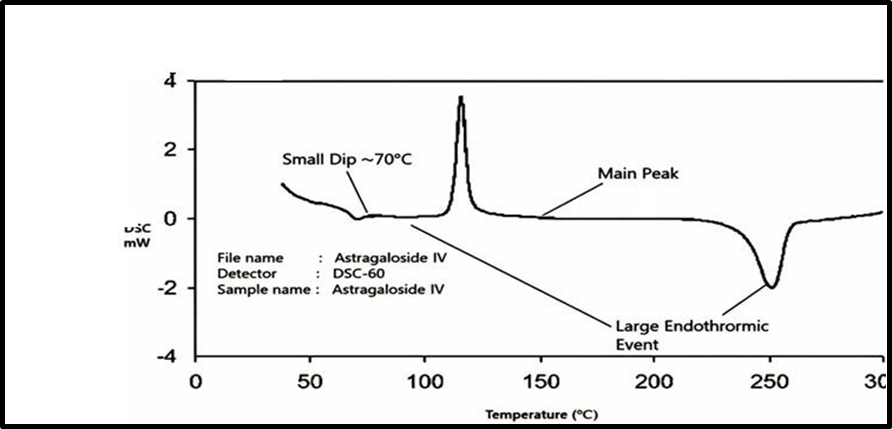
Fig 10: Differential Scanning Calorimetry of Astragaloside ?
The purity and compatibility of Astragaloside IV were evaluated using differential scanning calorimetry (DSC). The DSC thermogram of the pure drug exhibited a sharp and well-defined endothermic peak at around 250 °C, corresponding to its melting point. This sharp melting peak confirms the crystalline nature and thermal stability of Astragaloside IV in its pure form. When the drug was analysed in physical mixtures with the selected polymers, a similar endothermic peak appeared at nearly the same temperature (~250 °C). The retention of this characteristic peak in the thermograms of the mixtures indicates that there was no significant drug–polymer interactions, since any strong interaction or incompatibility would have caused noticeable shifts, broadening, or disappearance of the peak. Thus, the DSC analysis not only confirms the purity of Astragaloside IV but also demonstrates that its crystalline characteristics are preserved in the formulation. This suggests that the drug remains stable and compatible with the chosen excipients, making it suitable for further formulation development.
B) Evaluation of Transdermal patches of Astragaloside ?
Physical appearance
The Astragaloside ? formulated patches were observed to be clear, smooth, uniform, and flexible in their physical appearance, without any entrapment of air bubbles or cracks.
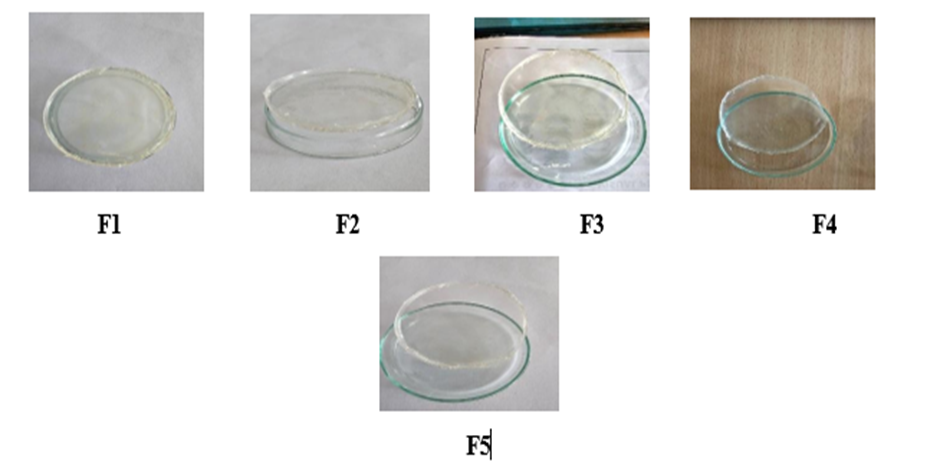
Figure 11: F1 to F5 Formulation of Transdermal patches of Astragaloside ?
Uniformity of weight
The uniformity of weight of the prepared Astragaloside ? patches was evaluated, and the data are shown in figure number 12. The average weight of patches was found in the range of 399.27 ± 0.80 to 402.90 ± 0.36 mg, with low standard deviation values indicating uniformity of the process. The results confirm that the prepared patches complied with the uniformity of weight requirement, showing good reproducibility in formulation.

Figure 12: Graphical representation of Uniformity of Weight
Thickness of the patch
The prepared transdermal patches exhibited consistent thickness across all formulations, ranging from 0.18 ± 0.006 mm to 0.22 ± 0.006 mm. This uniformity in thickness indicates a controlled and reproducible fabrication process, essential for ensuring consistent drug release and optimal performance of the patches in transdermal drug delivery applications. The results obtained were deplicated in figure 13.
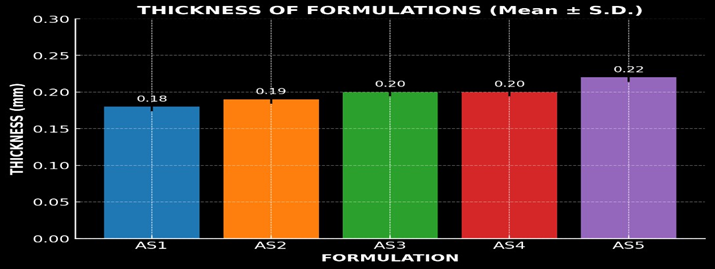
Figure 13: Graph of Thickness
Tensile Strength
The tensile strength of the Astragaloside IV transdermal patches reflected their ability to resist rupture. The patches showed good tensile strength, ranging from 0.42 ± 0.012 to 0.59 ± 0.014 kg/cm², attribute d to the presence of PEG 400 as a plasticizer. No cracking was observed, confirming adequate flexibility and mechanical stability. Percentage elongation, measured using a Hounsfield universal testing machine, indicated satisfactory stretchability before breaking. The order of tensile strength was AS5 > AS4 > AS2 > AS3 > AS1, while percentage elongation followed the order AS5 > AS3 > AS4 > AS2 > AS1. The result is shown in figure number 14.
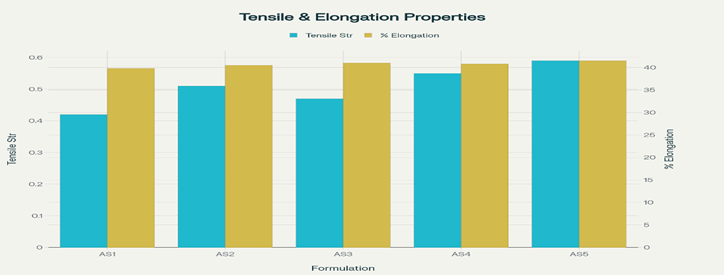
Figure 14: Graph of Tensile Strength
Folding endurance
The folding endurance values of the prepared Astragaloside IV patches varied between 180± 2.0 to 260 ± 2.0 folds (Table 13). The formulated film AS5 exhibited optimal folding endurance (260 folds) without any significant batch variation. The results were found satisfactory, indicating that the patches would not break and would maintain their integrity during handling and application. The results are deplicated in the figure 15.

Figure 15: Graphical depiction of Folding endurance
Percentage moisture absorption
The percent moisture absorption values of the prepared Astragaloside IV patches are shown in figure number 19, and the order of percentage moisture absorption was found to be AS5 > AS4 >AS3 > AS2 > AS1. The values varied between 2.15 ± 0.08% and 4.85 ± 0.15%. This indicates that the patches absorbed only a small amount of atmospheric moisture, which is desirable to maintain flexibility and prevent brittleness. The results confirm that all the prepared patches possess satisfactory stability and mechanical integrity under normal storage conditions and the result are graphically represented in the figure number 16.
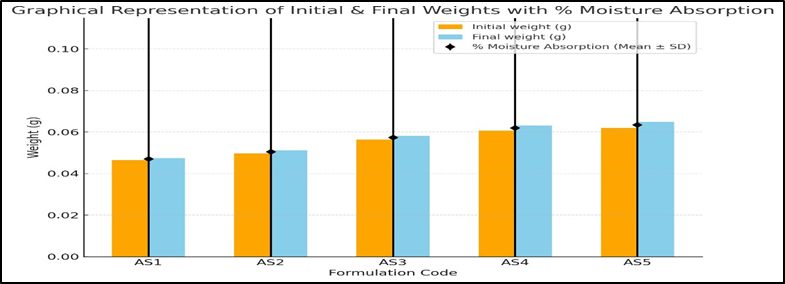
Figure 16: Graph of Percentage moisture absorption
Percentage moisture loss

Figure 17: Graph of Percentage moisture loss
The studies on moisture loss were conducted at 80–90% relative humidity. All of the Astragaloside IV patches exhibited minimal percentage of moisture loss. The data is presented in figure 17, with the percentage moisture loss occurring in the following order: AS2 > AS5 > AS4 > AS1 > AS3. The low moisture content of the formulations helps maintain their stability and prevents the films from drying out completely or becoming brittle.
Drug content
Data of Astragaloside IV estimation in transdermal patches by UV–visible spectrophotometer at 256 nm have been recorded and graphically represented in figure number 18. The formulation's percentage drug content ranges from 96.9 ± 0.3 to 98.4 ± 0.3. The low standard deviation values indicate uniform drug distribution within the polymeric matrix, confirming reproducibility of the manufacturing process.
Figure 18: Graphical representation of Drug content
In-vitro release studies
Table 7: Percentage Cumulative Drug Release
|
Time (min) |
% Cumulative Drug Release (Mean ± S.D.) * |
||||
|
Formulation Code |
|||||
|
AS 1 |
AS 2 |
AS 3 |
AS 4 |
AS 5 |
|
|
0 |
0 |
0 |
0 |
0 |
0 |
|
15 |
8.42 ± 0.215 |
12.36 ± 0.352 |
10.25 ± 0.295 |
9.58 ± 0.187 |
11.21 ± 0.246 |
|
30 |
14.85 ± 0.318 |
20.54 ± 0.447 |
18.33 ± 0.321 |
15.92 ± 0.264 |
17.65 ± 0.382 |
|
60 |
28.67 ± 0.428 |
34.72 ± 0.518 |
32.45 ± 0.411 |
29.38 ± 0.333 |
30.82 ± 0.401 |
|
120 |
42.15 ± 0.462 |
50.16 ± 0.612 |
48.39 ± 0.503 |
44.73 ± 0.426 |
46.95 ± 0.512 |
|
240 |
56.82 ± 0.573 |
65.27 ± 0.437 |
62.84 ± 0.389 |
58.12 ± 0.357 |
61.48 ± 0.469 |
|
360 |
69.38 ± 0.421 |
78.41 ± 0.583 |
75.26 ± 0.528 |
71.45 ± 0.441 |
73.92 ± 0.517 |
|
480 |
80.46 ± 0.533 |
85.63 ± 0.391 |
83.72 ± 0.612 |
82.11 ± 0.518 |
84.35 ± 0.449 |
|
600 |
86.23 ± 0.412 |
89.74 ± 0.523 |
89.74 ± 0.523 |
87.15 ± 0.482 |
88.65 ± 0.493 |
|
720 |
90.18 ± 0.532 |
93.25 ± 0.474 |
92.08 ± 0.513 |
91.36 ± 0.437 |
92.79 ± 0.521 |
* All values represent the mean of 3 readings (n-3)
The cumulative percentage of drug released over 12 h ranged from 90.18 ± 0.532 % (AS1) to 93.25 ± 0.474 % (AS2) for the Astragaloside IV transdermal films.
The order of drug release among the formulations was:
AS2 > AS5 > AS3 > AS4 > AS1.
The formulation AS2 showed a better in-vitro drug release profile across the cellulose membrane when compared to the other formulations. This might be attributed to the suitable combination of polymers, plasticizer concentration, and the effect of permeation enhancer used. Thus, formulation AS2 is considered the optimized formulation. The results are depicted in Table number 7 and figure 19.
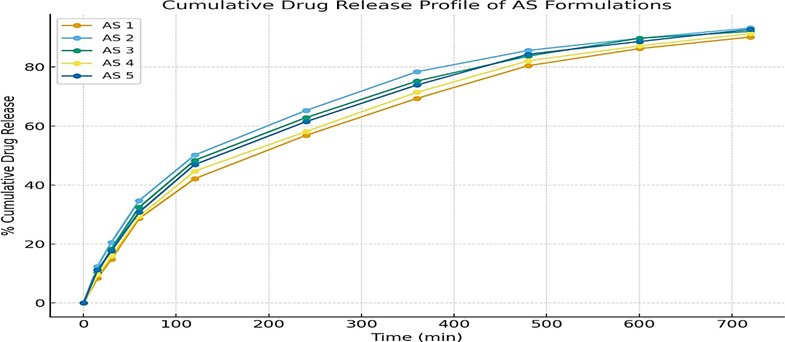
Figure 19: Cumulative Drug Release Profile
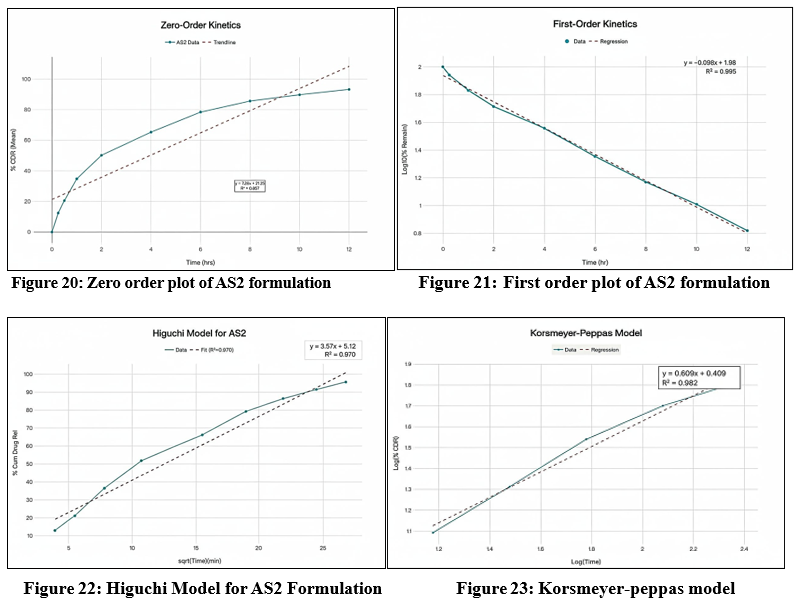
Drug Release Kinetics
The cumulative percentage of Astragaloside IV released from the AS2 formulation was analyzed by fitting the data into various mathematical kinetic models, including zero-order, first-order, Higuchi, and Korsmeyer–Peppas models, in order to elucidate the mechanism of drug release. The correlation coefficients (R²) obtained from these models were used to determine the best-fit model that most accurately described the release behaviour. The selection of the most appropriate kinetic model was based on the highest regression coefficient (R²) value, as an R² value approaching unity indicates a strong linear relationship and a better model fit. For the AS2 formulation, the first-order model exhibited the highest R² value (R² = 0.995), suggesting that the release of Astragaloside IV from the patch follows a concentration-dependent kinetic profile. This implies that the rate of drug release decreases exponentially with time, as the concentration of the drug in the matrix diminishes a typical behavior for diffusion-controlled systems where the driving force for release is the concentration gradient between the patch and the skin surface. In addition, the AS2 formulation also showed relatively high correlation values for the Higuchi model (R² = 0.977) and the Korsmeyer–Peppas model (R² = 0.973). The Higuchi model describes drug release from a homogenous matrix as a function of the square root of time, which is indicative of Fickian diffusion. The strong fit to this model further supports that the release mechanism is primarily diffusion-controlled, governed by the gradual penetration of the dissolution medium into the polymeric network and subsequent release of the drug molecules along the concentration gradient. Furthermore, the Korsmeyer–Peppas model was applied to evaluate the mechanism of drug release in more detail. The release exponent (n) obtained from this model helps to distinguish between Fickian diffusion, non-Fickian (anomalous) transport, or case-II transport. For the AS2 formulation, the n value (typically between 0.45 and 0.89 for polymeric films) indicated anomalous diffusion, suggesting that both diffusion and polymer relaxation (erosion/swelling) contribute to the overall release process. This hybrid mechanism is characteristic of hydrophilic polymeric systems containing HPMC and PVP, where water uptake induces swelling, creating additional pathways for the drug to diffuse through the matrix. Overall, these findings suggest that the in vitro release profile of Astragaloside IV from the AS2 transdermal patch follows first-order kinetics, with a predominant diffusion-controlled release mechanism influenced by the swelling behavior of the polymeric matrix. The high R² values across multiple models also indicate that the AS2 formulation provides a consistent and sustained release pattern, which is desirable for maintaining prolonged therapeutic levels of Astragaloside IV through transdermal administration. The corresponding graphical plots for each kinetic model — including cumulative % drug released vs. time (zero-order), log cumulative % drug remaining vs. time (first-order), cumulative % drug released vs. square root of time (Higuchi model), and log cumulative % drug released vs. log time (Korsmeyer–Peppas model) — are presented in Figures 20-23 , respectively, to visually demonstrate the goodness of fit for each kinetic model.
Stability studies
Formulation Astragaloside ? (F2) transdermal patch successfully passed the stability studies, showing no significant changes in physical appearance, thickness, weight uniformity, folding endurance, moisture content, moisture uptake, drug content, flatness, tensile strength, percentage elongation, or in vitro drug release profile. The detailed stability study data for formulation AS4 (AS2) are presented in Table number 8.
Table 8: Data of stability studies for F2 formulation
|
Formulation |
Time (Days) |
Physical Appearance |
Thickness (mm) |
Weight (mg) |
Folding Endurance |
Drug Content (%) |
In vitro Drug Release (%) |
|
AS2 |
Day 1 |
No phase separation |
0.19±0.007 |
400.77±0.30 |
220±6
|
97.6±0.3 |
93.25±0.52 |
|
After 90 days |
No phase separation |
0.20±0.009 |
400.30±0.35 |
215±8
|
97.0±0.4 |
92.80±0.60 |
CONCLUSION
The present research aimed to formulate and characterize a controlled-release transdermal patch of Astragaloside IV, a bioactive saponin with poor oral bioavailability due to extensive first-pass metabolism and low solubility. Transdermal delivery was selected to enhance systemic availability and provide sustained release of approximately 15 mg/day. Preformulation studies confirmed that Astragaloside IV is a white to off-white crystalline powder, freely soluble in methanol, ethanol, DMSO, and isopropyl myristate, but practically insoluble in water. FT-IR analysis confirmed compatibility between the drug and polymers (HPMC and PVP), indicating no significant interactions. A UV spectrophotometric method at 256 nm showed good linearity (R² ≈ 1.0) within 2–10 µg/ml and was used for all analytical estimations. Five formulations (AS1–AS5) were prepared by the solvent-casting method using HPMC and PVP in varying ratios, PEG 400 as plasticizer, and DMSO as permeation enhancer. The resulting patches were transparent, smooth, flexible, and uniform in thickness and weight, demonstrating good reproducibility. Folding endurance tests confirmed mechanical strength, while moisture studies showed that PVP-based films absorbed more moisture due to their hygroscopic nature. Drug content uniformity ranged between 95–104%, indicating consistent drug distribution. In-vitro release studies using Franz diffusion cells in phosphate buffer (pH 7.4) revealed sustained drug release for 12 hours, with formulation AS2 showing optimal performance (92.3% release in 12 h) and following first-order kinetics (R² = 0.994), suggesting an anomalous diffusion mechanism involving both diffusion and polymer relaxation. Stability studies conducted for 3 months at room temperature confirmed that AS2 maintained its physical integrity, drug content, and release characteristics within acceptable limits. Overall, the study successfully developed a stable, flexible, and uniform transdermal patch capable of delivering Astragaloside IV in a controlled manner, effectively overcoming its oral bioavailability challenges and offering a promising alternative route for sustained therapeutic delivery.
ACKNOWLEDGEMENT
I sincerely thank Sarada Vilas College of Pharmacy, Mysuru, for their invaluable support and providing excellent facilities throughout this research project. The conducive academic environment, continuous encouragement, and provision of necessary resources played a crucial role in the successful completion of this work.
REFERENCES

Suhas B. C., Nagendra R.*, Siddartha H. N., Venkatesh, Hanumanthachar Joshi, Formulation and Evaluation of Transdermal Patches Containing Astragaloside ?, Int. J. of Pharm. Sci., 2025, Vol 3, Issue 10, 2828-2847 https://doi.org/10.5281/zenodo.17452263
 10.5281/zenodo.17452263