
We use cookies to ensure our website works properly and to personalise your experience. Cookies policy
1,2 Department of Chemistry, Government Degree College Tekkali, Srikakulam(Dist), Andhra Pradesh, India
3 Department of Chemistry, Government Degree College Marripalem, A S R (dist), Andhra Pradesh, India
Plastics have become indispensable commodities in modern society, with global output topping 370 million tons per year. However, their persistence and mismanagement have resulted in serious environmental and health consequences. This paper provides a comprehensive overview of plastic manufacturing trends from 1950 to 2025, focusing on the exponential development in worldwide output and the associated increase in trash generation. The research addresses the ecological, biological, and human health effects of plastics and microplastics, using quantitative data. Various remediation options, including as mechanical and chemical recycling, biodegradation, and the development of bioplastics, are critically reviewed. Policy initiatives, circular economy models, and global sustainability frameworks are all considered. The research concludes that comprehensive global policies combining innovation, legislation, and education are critical for transitioning to a sustainable plastic economy.
Plastics are synthetic polymers that have transformed industries with their variety, durability, and cost-effectiveness. Since the 1950s, plastic manufacturing has increased from 2 million tonnes to over 370 million tonnes in 2020, with estimates of 420 million tonnes by 2025 [1, 2]. While plastics have facilitated significant technological and economic advancement, their environmental impact has become a worldwide issue [3]. Inadequate waste management, reliance on single-use plastics, and poor recycling techniques all lead to widespread contamination of soil, air, and water ecosystem [4]. This analysis will examine manufacturing trends, environmental and health implications, and the most recent remediation solutions for sustainable plastic management.
2. GLOBAL PLASTIC PRODUCTION TRENDS (1950–2025)
Plastics manufacturing has increased approximately 200-fold since the 1950s, thanks to the packaging, construction, and consumer goods industries [5]. Developing economies, particularly in Asia and the Pacific, now account for the vast majority of global output.
Table 1. Global Plastic Production Data (1950–2025)
|
Year |
Global Production (Million Tonnes) |
Major Producers |
Key Plastic Types |
Remarks |
|
1950 |
2 |
USA, UK |
PE, PVC |
Beginning of mass production |
|
1970 |
35 |
USA, Europe, Japan |
PE, PP, PVC, PS |
Packaging boom |
|
1990 |
100 |
USA, China, Germany |
PET, HDPE, LDPE |
Disposable culture rise |
|
2000 |
200 |
China, USA, EU |
PP, PET, PS |
Globalization of plastic markets |
|
2010 |
300 |
China, India, USA |
PP, PET, HDPE |
Growth of single-use plastics |
|
2020 |
370 |
China (32%), USA (17%) |
PE, PP, PET |
Packaging & consumer goods |
|
2025* |
420 (projected) |
China, India |
Bioplastics emerging |
Sustainable alternatives rise |
Source: UNEP (2024) [1]), OECD Plastic Outlook (2023) [5], Statista Reports (2024) [6].
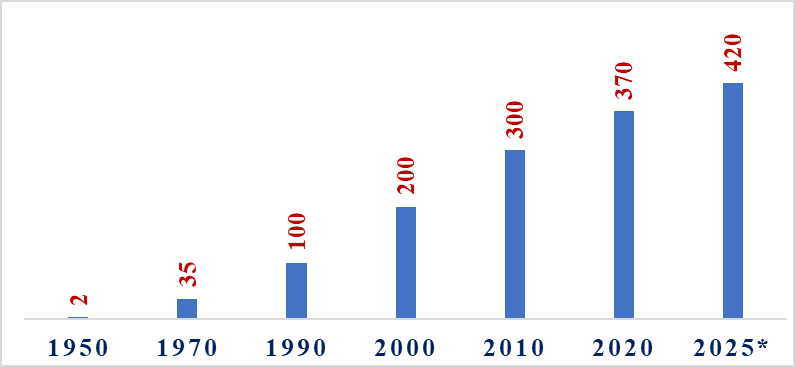
Figure 1. Global Plastic Production (Million Tonnes) Data from 1950-2025
The data show a large growth in production after 2000, owing to economic globalization and modernization. China accounts for over one-third of worldwide plastic output, followed by the United States and the European Union [5].
3. ENVIRONMENTAL AND HEALTH IMPACTS OF PLASTICS
3.1 Environmental Effects
Plastic contamination harms soil, river, and marine ecosystems. Mismanagement of plastic trash causes hazardous chemical leakage, microplastic production, and habitat destruction [7,8]. More than 11 million tonnes of plastic enter the ocean each year [9]. Microplastics (<5 mm) from these materials can accumulate in sediments and biota over centuries [10].
3.2 Biological and Human Health Effects
Microplastics and their associated chemicals, including bisphenol A (BPA) and phthalates, have been linked to endocrine disruption, reproductive difficulties, and carcinogenicity [4,11]. Marine creatures consume microplastics, resulting in bioaccumulation and trophic transmission via food webs [12].
Table 2. Environmental & Health Effects of Plastic Pollution
|
Category |
Type of Effect |
Description |
Example / Impact |
|
Environmental |
Soil Contamination |
Leaching of additives and microplastics into soil |
Affects soil fertility & microbes |
|
Environmental |
Water Pollution |
Accumulation in rivers and oceans |
11 million tons enter oceans annually |
|
Environmental |
Air Pollution |
Burning releases toxic gases |
Dioxins, furans, carbon monoxide |
|
Biological |
Marine Life Impact |
Ingestion by fish, turtles, birds |
Food chain contamination |
|
Human Health |
Endocrine Disruption |
BPA & phthalates mimic hormones |
Reproductive & developmental disorders |
|
Human Health |
Carcinogenicity |
Styrene, vinyl chloride compounds |
Linked to cancers |
|
Economic |
Waste Management Cost |
High cost of collection & recycling |
$13 billion annual ocean cleanup cost |
Source: WHO (2023) [11]; UNEP Plastic Report (2022) [9]; Rochman et al. (2019) [4].
4. PLASTIC WASTE GENERATION AND MANAGEMENT
Waste management is a significant global challenge. Recycling rates vary greatly between regions, with Europe recycling 32% compared to Asia-Pacific's 12% [13]. Landfilling and open dumping are still common activities in low-income areas.
Table 3. Plastic Waste Generation & Management (Region-wise, 2023)
|
Region |
Waste Generated (Mt/year) |
Recycling (%) |
Landfill (%) |
Ocean Leakage (%) |
|
Africa |
20 |
4 |
75 |
6 |
|
Latin America |
25 |
10 |
65 |
3 |
|
North America |
45 |
9 |
72 |
3 |
|
Europe |
60 |
32 |
45 |
1 |
|
Asia-Pacific |
170 |
12 |
60 |
4 |
Source: World Bank Plastic Waste Data (2024) [13].
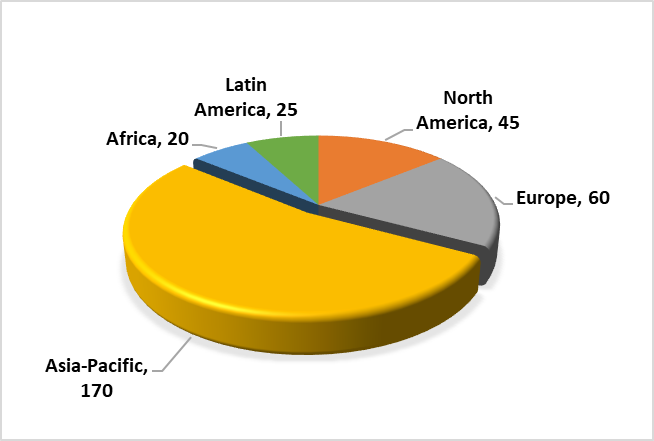
Figure 2: Region wise Plastic Waste Generation (Mt/Year)
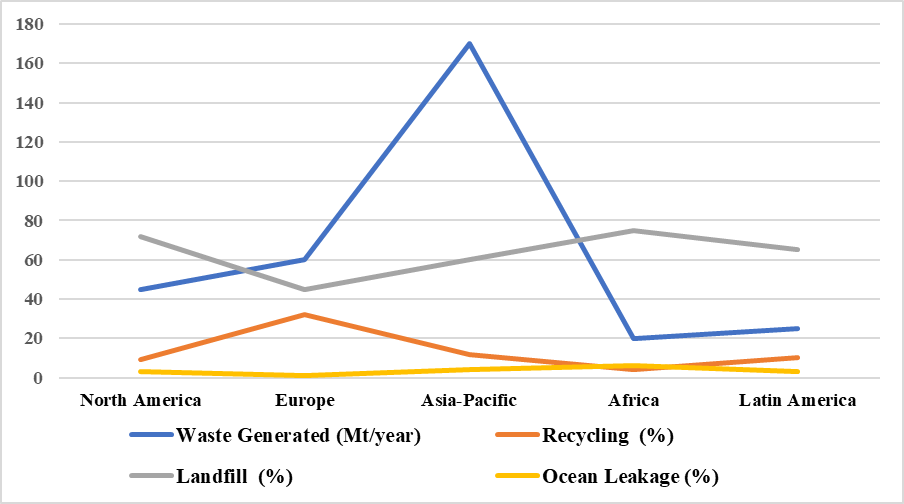
Figure 3: Plastic Waste Generation & Management (Region-wise, 2023)
Policies encouraging Extended Producer Responsibility (EPR) and circular economy initiatives are strengthening recycling systems in a number of countries [14,15], but enforcement is patchy.
5. SUSTAINABLE REMEDIATION AND RECYCLING TECHNOLOGIES
5.1 Mechanical and Chemical Recycling
Mechanical recycling is easy and inexpensive, but its effectiveness is restricted by polymer breakdown [16]. Chemical recycling has better potential for depolymerization into monomers, but it is still energy-intensive and cost restricted [17].
5.2 Biodegradation and Microbial Remediation
Recent discoveries of plastic-degrading bacteria, such as Ideonella sakaiensis, which can degrade PET, provide interesting biological treatment techniques [18,19].
5.3 Waste-to-Energy and Bioplastics
Thermal treatment and bioplastic synthesis using renewable resources like starch and cellulose are gaining popularity [20]. However, high costs and scalability concerns prevent widespread usage [21].
Table 4. Plastic Remediation & Management Techniques
|
Method |
Principle |
Advantages |
Limitations |
Example / Application |
|
Mechanical Recycling |
Sorting, shredding, melting |
Simple, low-cost |
Quality degradation |
PET bottles, HDPE containers |
|
Chemical Recycling |
Depolymerization to monomers |
Reusable feedstock |
Energy intensive |
Pyrolysis of PE & PP |
|
Biodegradation |
Microbial/ plastic-eating enzymes |
Eco-friendly |
Slow process |
Ideonella sakaiensis for PET |
|
Incineration with Energy Recovery |
Combustion to energy |
Reduces volume |
Air pollution risk |
Waste-to-energy plants |
|
Bioplastics |
Made from starch/cellulose |
Renewable, compostable |
Limited strength, costly |
PLA, PHA materials |
|
Waste Reduction Policy |
Bans, taxes, awareness |
Preventive |
Enforcement challenges |
India’s single-use ban 2022 |
Table 5. Sustainable Alternatives to Conventional Plastics
|
Type |
Source Material |
Degradation Time |
Applications |
Example |
|
PLA (Polylactic Acid) |
Corn, sugarcane |
6–24 months |
Packaging, cutlery |
NatureWorks PLA |
|
PHA (Polyhydroxyalkanoate) |
Bacterial fermentation |
6–12 months |
Medical, agriculture |
Danimer PHA |
|
Starch-based Plastics |
Potato, maize starch |
<1 year |
Bags, films |
Novamont Mater-Bi |
|
Cellulose-based |
Wood pulp |
<6 months |
Food wrapping |
Cellophane |
|
Recycled PET |
PET waste |
Long (recyclable) |
Bottles, textiles |
rPET fabrics |
6. POLICY, EDUCATION, AND CIRCULAR ECONOMY
Effective plastic management necessitates robust policy frameworks. The EU Directive (2019/904) and India's 2022 ban on single-use plastics are significant legislative achievements [14, 22]. Public participation, awareness campaigns, and education are critical for behavioural change [23]. Circular economy approaches, which emphasize reuse, recycling, and material innovation, serve as the cornerstone for sustainable plastic management [15].
7. FUTURE PERSPECTIVES
Future research should focus on cost-effective biodegradable polymers, scalable recycling systems, and enhanced microplastic detection [17]. Artificial intelligence in garbage sorting, blockchain for traceability, and worldwide recycling code standardization could all help to hasten the circularity shift [24].
8. CONCLUSION
ABBREVIATIONS:
ACKNOWLEDGEMENTS:
We thank our college principle and faculty members for give their support to write this wonderful article.
REFERENCES


Sateesh Kumar Beepala, V. Luke Paul, Srividhya Maripi, Global Plastic Production, Environmental Impacts, and Sustainable Remediation Strategies: A Comprehensive Review, Int. J. of Pharm. Sci., 2025, Vol 3, Issue 11, 1870-1876. https://doi.org/10.5281/zenodo.17590419
 10.5281/zenodo.17590419