1student, Department of quality assurance, vidyabharati college of pharmacy, amravati (mh) india 444-602
2assistant professor, vidyabharati college of pharmacy, amravati (mh) india 444-602
This paper presents a novel approach for the simultaneous determination of binary mixtures utilizing the H-Point Standard Addition Method (HPSAM). The study addresses the challenges associated with the quantification of components in complex mixtures, which are prevalent in various fields such as pharmaceuticals, environmental monitoring, and food safety. The HPSAM technique leverages the principle of standard addition to enhance the accuracy and precision of concentration measurements. Through rigorous experimentation, the method demonstrates its effectiveness in minimizing matrix effects and improving analytical reliability. The results indicate that HPSAM can successfully resolve overlapping signals in spectroscopic analyses, offering a robust solution for the simultaneous quantification of two analytes in a mixture. This work contributes to the ongoing development of analytical techniques and provides a framework for future research in multi-component analysis. H Point Standard Addition Method (HPSAM) in accurately quantifying binary mixtures, effectively addressing the complexities of overlapping signals in various analytical fields.
Spectroscopy is the estimation and elucidation of electromagnetic radiation absorbed or radiated when atom or particles or particles of a test move from one energy state to another. Electromagnetic radiation (EMR): Electromagnetic radiation comprises of waves or the of the electromagnetic field, engendering through space, carrying electromagnetic radiant energy.
Electromagnetic waves travel at the speed of light in a vacuum. Different sorts of EMR are: Gamma rays, X-rays, ultra violet, Visible light, Infra-red, Micro wave, Radio wave.
Type of Spectroscopy:
1) Atomic Spectroscopy
2) Molecular Spectroscopy
3) Absorption Spectroscopy
4) Emission Spectroscopy
5) Electronic Spectroscopy
Atomic Spectroscopy: Atomic Spectroscopy is characterized as estimation of electromagnetic radiation absorbed or radiated by atoms of a test move from one vitality state to another. It take put at atomic level.
Eg. AAS, Flame photometry Molecular Spectroscopy:
Molecular Spectroscopy is characterized as estimation of electromagnetic radiation absorbed or transmitted by molecule. The changes in vitality take put at molecule.
Eg. UV, IR, NMR, AAS
Absorption Spectroscopy: Spectroscopy that includes procedures that degree the absorption of electromagnetic radiation, as a work of recurrence or wavelength, due to its interaction with a test. The think about of absorption of radiation take place.
Eg. UV, IR, NMR, AAS
Emission Spectroscopy: A spectroscopic strategy which looks at the wavelengths of photons radiated by molecules or particles amid their move from an energized state to a lower vitality state. The consider of outflow of radiation take put.
Eg. Fire photometry, Fluorometry.
Electronic Spectroscopy: It is ponder of electronic structure of materials by analyzing the energies of radiated electrons or by checking how a test a test absorbs or transmits light. It is done utilizing electromagnetic radiation without the impact of magnetic field[1].
Absorption spectrophotometry in UV-Visible region is considered to be one of the most seasoned physical strategies utilized for quantitative investigation and basic elucidation.
Principle of UV-Visible Spectroscopy: It is based on the rule of absorption of UV light having run from 200 nm -400 nm as well as visible light having run from 400 nm – 800 nm.
A substance being inspected will absorb energy from UV or visible light, which will cause an electron to move from its ground state to its energized electronic state. During the prepare of absorption, a bigger number of photon molecule collisions are conceivable but as it were those collisions will cause absorption of energy in which energy of photon matches the energy distinction between ground and energized state of molecule.
The energy of absorption is quantized. In UV-Visible spectroscopy electronic moves take put. UV-visible spectroscopy takes after Beer-Lambert’s law.
1.1 (a) Beer-Lambert’s Law[3]
Lambert’s law: It state that as we increased the path length from which UV rays travel, the intensity of UV-Visible light decreases exponentially.
Beer’s law: As we increased the concentration of sample through which UV light passes, the intensity decreases exponentially.
Both these two statements are combined to form Beer-Lambert’s law.
Beer-Lambert’s law state that absorbance is directly proportional to concentration of sample and path length.
A α b.c
A = a.b.c
logIoIt=A=a.b.c
Were,
Io = is the intensity of incident radiation
It = is the intensity of transmitted radiation
A = Absorbance
a = proportionality constant called absorptivity
b = thickness of absorbing medium in cm.
c = concentration of absorbing substance.
1.1 (b) Instrumentation:
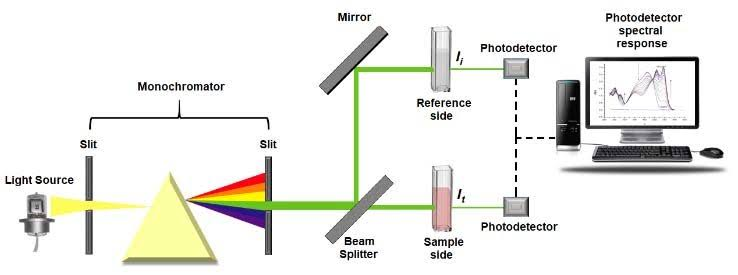
Fig.1 Double Beam Spectrophotometer [4]
1.1(C) Application of UV-Visible Spectroscopy:
The measure of an absorbing substance may be rapidly carried out by utilizing UV-Visible spectrophotometry by the estimation of absorbance of absorbing substance at a specific wavelength. One of the principals of assurance of concentration of absorbing substance is the utilize of calibration graph called as linear regression analysis.
It takes after Beer-Lambert’s law which appear connection between absorbance and concentration of absorbing analyte.
When there is an interaction between analyte and other materials (i.e. matrix impacts), they changed the watched reaction as a result calibration bend of immaculate arrangements are not valid. To examine these impacts are show in test, Standard Expansion Strategy is used.
• Standard addition method is a quantitative investigation method.
• In these method increases of one or more components to the standard arrangement of test is known as spiking.
• The extra components may either improve or decrease the analyte absorbance signal.
• Standard addition methods are commonly utilized to eliminate matrix impacts from a measurement.
• There are a few pharmaceutical combinations accessible in the showcase having medicate components with close overlapping UV spectra. These are having profoundly superimposing spectra, close λmax and no isobestic point. (Isobestic point – wavelength at which two absorbing species in balance have same absorbance value.) The issue is raised in the quantitative estimation in over mixture is that consistent mistake is delivered in analyte by the interferent of other component having overlapping
• spectra. To evacuate this issue, altered standard addition method is utilized ie H-Point Standard addition method is used.
In 1988 Bosch-Reig and P. Campins Falco proposed the adjusted shape of standard addition method known as H-Point Standard Addition Method (HPSAM)[7].
The H-point standard expansion strategy (HPSAM) is a method utilized to decide the concentration of an analyte in a test that moreover contains interferents. It's a alteration of the standard addition method and employments two wavelengths to get fair comes about.
The method is based on the taking after principles:
a) Dual-wavelength spectrophotometry: The method employments two wavelengths to decide the absorbance of the analyte and interferents.
b) Constant efficient error: The method changes over the blunder caused by interferents into a consistent mistake that can be assessed and removed. HPSAM grants the synchronous standard expansion of the two analytes in arrange to get their concentration in the test from a special calibration set was created [8] .
The taking after are the criteria for selecting suitable wavelengths [9] :
In HPSAM, the absorbance values of the interferent are the same at the two chosen wavelengths, meaning that the absorbance increases of the analyte depend as it were on the analyte concentration. Thus, the plot of the increase versus its included concentrations will be a straight line [10].
The analyte concentration can be calculated at the capture attempt point, known as the H Point. The esteem gotten after each expansion will be only connected to the analyte concentration since the absorbance of the interferent will be the same at the two wavelengths. In these strategy explanatory signals gotten at two wavelengths where the absorbance is the same for the interferent and diverse for the analyte; the application of the guideline of standard addition method, beneath these conditions hence leads to two straight lines at each wavelength which caught at a point called H-point, characterized by the arranges (-??, ??).
Were,
CH is the analyte concentration
?H is the analytical signal yielded by the interferent [11].
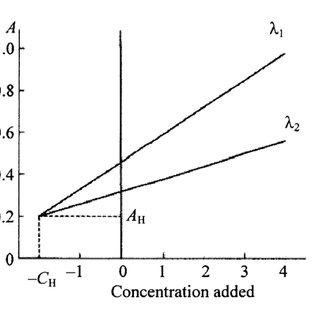
Fig.2 HPSAM plot at selected wavelengths λ1 and λ2[12]
The addition line obtained at the wavelengths λ1 and λ2 are given by[13]:
A(λ1) = A1 + M(λ1). Cx ……………. (1)
A(λ2) = A2 + M(λ2). Cx ……………. (2)
Were,
A1 and A2 ……Absorbances of the sample at λ1 and λ2 respectively
M(λ1) and M(λ2) ……...slopes of the addition lines
Cx…...Concentration of analyte added.
The addition lines intersect at the H-point, (-CH, AH), given by:
A1 +M(λ1). (-CH) = A2 + M(λ2). (-CH)
This can also be written as:
-CH = A2 – A1
Mλ1 – Mλ2
The absorbance at the H-point, AH, corresponds to the absorbance of the interferent since from Eq. (1):
A(λ1) = B + A1+ M(λ1). Cx
ADVANTAGES OF HPSAM [14]:
Corrects for Matrix Effects:
HPSAM directly addresses the issue of matrix interference, where the sample's composition affects the analyte signal. By adding standards directly to the sample, the method accounts for these effects, providing more accurate results.
Resolves Overlapping Spectra:
When multiple components in a sample have similar spectral characteristics, HPSAM can be used to separate and quantify each individual analyte, even without prior separation.
Simultaneous Determination:
HPSAM can be used to determine the concentration of multiple analytes in a mixture simultaneously.
Eliminates Systematic Errors:
The method helps to eliminate constant and proportional errors that can arise from variations in the sample matrix.
CONCLUSION
In conclusion, this exploration highlights the effectiveness of the H-Point Standard Addition Method (HPSAM) in accurately quantifying binary mixtures, effectively addressing the complexities of overlapping signals in various analytical fields. By enhancing measurement precision and minimizing matrix effects, HPSAM represents a significant advancement in multi-component analysis, paving the way for future innovations in analytical techniques.
REFERENCES


Radhika Vighe, Amol Sawale, Review On Simultaneous Determination of Binary Mixture Using Standard Addition Method, Int. J. of Pharm. Sci., 2025, Vol 3, Issue 5, 2592-2597. https://doi.org/10.5281/zenodo.15429629
 10.5281/zenodo.15429629
