

We use cookies to ensure our website works properly and to personalise your experience. Cookies policy
Shri Ramkrishna Paramhans College of Pharmacy, Hasnapur, Parbhani.
The present study was undertaken to develop and validate a simple, reliable, accurate, precise, rapid, and cost-effective Reverse Phase High-Performance Liquid Chromatography (RP-HPLC) method for the quantitative determination of Warfarin in bulk drug and tablet dosage forms. Warfarin is a widely prescribed oral anticoagulant used for the prevention and management of thromboembolic disorders. Owing to its narrow therapeutic index, the development of a sensitive and reliable analytical method is essential to ensure the quality, safety, and therapeutic effectiveness of the drug. Chromatographic separation was achieved using a Cosmosil C18 column (250 × 4.6 mm, 5 µm particle size) with a mobile phase comprising methanol and potassium phosphate buffer (80:20, v/v). Detection was performed using a UV detector at 275 nm, producing well-resolved and symmetrical chromatographic peaks with an acceptable retention time. The developed analytical method was validated in accordance with the International Council for Harmonisation (ICH) guidelines by evaluating parameters such as linearity, accuracy, precision, specificity, robustness, limit of detection (LOD), and limit of quantification (LOQ). The method demonstrated excellent linearity over the concentration range of 5–25 µg/mL, with a high correlation coefficient indicating a strong linear relationship between concentration and peak area. Precision studies showed low %RSD values, confirming the repeatability and reproducibility of the method. Accuracy was established through recovery studies, which yielded satisfactory recoveries within the prescribed acceptance limits. Furthermore, the method proved to be specific and robust, showing no interference from formulation excipients or minor variations in chromatographic conditions. The validated RP-HPLC method was successfully applied to the quantitative estimation of Warfarin in commercially available tablet formulations. The assay results complied with the labeled claim, demonstrating the suitability of the developed method for routine quality control and assay determination. Therefore, the proposed RP-HPLC method can be recommended for regular pharmaceutical analysis of Warfarin in quality control laboratories and research settings due to its simplicity, reliability, accuracy, and reproducibility.
Reverse Phase High-Performance Liquid Chromatography (RP-HPLC) is one of the most reliable and widely employed analytical techniques for the qualitative and quantitative determination of pharmaceutical compounds. In RP-HPLC, separation is achieved using a non-polar stationary phase, typically a C18 column, and a relatively polar mobile phase consisting of water or buffer mixed with organic solvents such as methanol or acetonitrile. The technique offers excellent sensitivity, specificity, precision, accuracy, and reproducibility, making it the preferred method for pharmaceutical analysis. RP-HPLC is extensively used for assay determination, impurity profiling, dissolution testing, stability studies, and method validation in accordance with ICH guidelines, ensuring the quality and consistency of drug productsWarfarin is a widely prescribed oral anticoagulant belonging to the coumarin class of drugs. It acts by inhibiting the vitamin K epoxide reductase complex (VKORC1), thereby reducing the synthesis of vitamin K-dependent clotting factors II, VII, IX, and X. Warfarin is extensively used for the prevention and treatment of deep vein thrombosis, pulmonary embolism, atrial fibrillation-associated stroke, and thromboembolic complications in patients with prosthetic heart valves. Due to its narrow therapeutic index and significant inter-patient variability, accurate quantification of warfarin in bulk drug substances and pharmaceutical dosage forms is essential to ensure product quality, efficacy, and patient safety.
MATERIALS AND INSTRUMENTS
Materials
Warfarin was obtained as a gift sample from Swapnroop Agency, Aurangabad, and was used as the reference standard for the development and validation of the analytical method. All chemicals and reagents employed during the study were of analytical reagent (AR) or HPLC grade to ensure high purity and reproducibility of the analytical results. HPLC-grade methanol, acetonitrile, ethanol, and acetone were procured from Merck Pvt. Ltd., Mumbai. HPLC-grade water was obtained from J.K. Labs, Thane, while potassium phosphate and orthophosphoric acid were purchased from Ozone International, Mumbai and MolyChem Pvt. Ltd., Mumbai, respectively. All solvents were filtered through a 0.45 µm membrane filter and degassed by sonication before use.
Instruments
The chromatographic analysis was performed using an HPLC 3000 Series Binary Gradient System (Analytical Technologies Ltd.) equipped with a UV-3000-M UV detector and a P-3000-M reciprocating pump capable of operating up to 40 MPa. Separation was achieved using a Cosmosil C18 column (250 × 4.6 mm i.d., 5 µm particle size), and data acquisition and processing were carried out using the HPLC Workstation software. Sample weighing was performed using a Wenser High Precision Balance (Model: PGB100) with a maximum capacity of 100 g and a readability of 0.001 g. Degassing of the mobile phase and sample solutions was carried out using a Wenser Ultra Sonicator (Model: WUC-4L) with a 4 L capacity to ensure the removal of dissolved gases and to obtain consistent chromatographic performance.
Evaluation of Analytical Method Validation as per ICH Guidelines
The developed RP-HPLC method for the quantitative estimation of Warfarin was validated according to ICH guidelines with respect to linearity, precision, accuracy, limit of detection (LOD), limit of quantification (LOQ), range, selectivity, robustness, and ruggedness.
Linearity:
Linearity was established by preparing standard solutions of Warfarin in the concentration range of 5–25 µg/mL. The peak area was plotted against concentration, and a calibration curve was constructed to demonstrate a direct proportional relationship.
Precision:
Precision was evaluated by analyzing replicate samples under identical conditions. Repeatability, intra-day precision, and inter-day precision were determined, and the results were expressed as %RSD, indicating good reproducibility of the method.
Accuracy:
Accuracy was determined by the standard addition (recovery) method at 80%, 100%, and 120% concentration levels. The percentage recovery confirmed the accuracy and reliability of the developed method.
Limit of Detection (LOD):
LOD represents the lowest concentration of Warfarin that can be detected but not necessarily quantified. It was calculated using the formula LOD = 3.3σ/S, where σ is the standard deviation of the response and S is the slope of the calibration curve. The LOD for Warfarin was found to be 0.02534 µg/mL.
Limit of Quantification (LOQ):
LOQ is the lowest concentration of Warfarin that can be quantified with acceptable precision and accuracy. It was calculated using the formula LOQ = 10σ/S. The LOQ for Warfarin was found to be 0.06680 µg/mL.
Range:
The validated analytical range of the developed RP-HPLC method was 5–25 µg/mL, over which acceptable linearity, precision, and accuracy were achieved.
Selectivity:
Selectivity was assessed by analyzing Warfarin in the presence of excipients. No interference from excipients or impurities was observed at the retention time of Warfarin, confirming the specificity of the method.
Robustness:
Robustness was evaluated by introducing small deliberate variations in chromatographic conditions, such as flow rate (±0.1 mL/min) and detection wavelength (±5 nm). These variations did not significantly affect the chromatographic performance, demonstrating the robustness of the method.
Ruggedness:
Ruggedness was evaluated by performing the analysis under different conditions, including different analysts and different days. The method produced consistent and reproducible results, confirming its suitability for routine quality control analysis.
METHODOLOGY
Solubility Study
The solubility of Warfarin was evaluated in various polar solvents, including water, methanol, acetonitrile, ethanol, and acetone. Warfarin was found to be highly soluble in methanol, freely soluble in water, acetonitrile, and ethanol, and insoluble in acetone. Based on the solubility profile, methanol was selected as the primary solvent for further studies.
Selection and Optimization of Mobile Phase
Different mobile phase combinations were investigated to obtain satisfactory chromatographic performance. Among the various solvent systems tested, Methanol: Potassium Phosphate Buffer (80:20, v/v) produced a sharp, symmetrical peak with good resolution and acceptable retention time. Therefore, it was selected as the optimized mobile phase for the RP-HPLC method.
Selection of Detection Wavelength
A standard solution of Warfarin (1000 µg/mL) was prepared and scanned in the UV range of 200–400 nm. The maximum absorbance (λmax) was observed at 258 nm, which was selected as the detection wavelength for all chromatographic analyses.
Selection of Retention Time
The HPLC system was equilibrated with the optimized mobile phase until a stable baseline was achieved. Standard Warfarin solution was injected repeatedly, and the retention time along with system suitability parameters such as theoretical plates and tailing factor were evaluated to ensure consistent chromatographic performance.
Optimization of Chromatographic Conditions
Chromatographic conditions were optimized by varying the mobile phase composition. The optimized method employed a Cosmosil C18 column with Methanol: Potassium Phosphate Buffer (80:20, v/v) as the mobile phase, providing well-resolved peaks with satisfactory peak symmetry and reproducibility.
Preparation of Buffer Solution
Potassium phosphate buffer was prepared by dissolving the required quantity of potassium phosphate in HPLC-grade water, and the pH was adjusted to 6.8 using orthophosphoric acid.
Preparation of Mobile Phase
The optimized mobile phase consisting of Methanol: Potassium Phosphate Buffer (80:20, v/v) was prepared, filtered through a 0.45 µm membrane filter, and degassed by ultrasonication before use.
Preparation of Standard Stock Solution
A standard stock solution of Warfarin was prepared by accurately weighing 100 mg of the drug, dissolving it in the mobile phase, and making up the volume to 100 mL. Appropriate dilutions were prepared from the stock solution for analysis.
System Equilibration and Sample Injection
The filtered mobile phase was loaded into the HPLC system, and the instrument was equilibrated until a stable baseline was obtained. Standard and sample solutions were filtered and injected into the HPLC system for chromatographic analysis.
Optimization of RP-HPLC Method
The developed chromatographic conditions were optimized based on peak symmetry, resolution, sensitivity, and reproducibility. The optimized method demonstrated satisfactory chromatographic performance and was selected for method validation.
Assay of Tablet Formulation
Commercial Coumadin tablets (Label claim: 5 mg Warfarin) were analyzed using the developed RP-HPLC method. Twenty tablets were accurately weighed, powdered, and an amount equivalent to 100 mg of Warfarin was transferred to a volumetric flask. The powder was dissolved in the mobile phase, sonicated, filtered, and suitably diluted. The prepared sample solution was injected into the HPLC system, and the drug content was calculated from the calibration curve. The assay results were found to be within the acceptable limits of the labeled claim
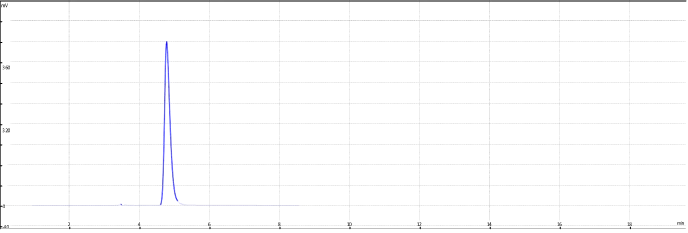
Fig: Trial 1: Methanol+potassium phosphate buffer (70:20)
Satisfactory and better results M.P. selected for further analysis so method is accepted
Determination of wavelength of Warfarin:-
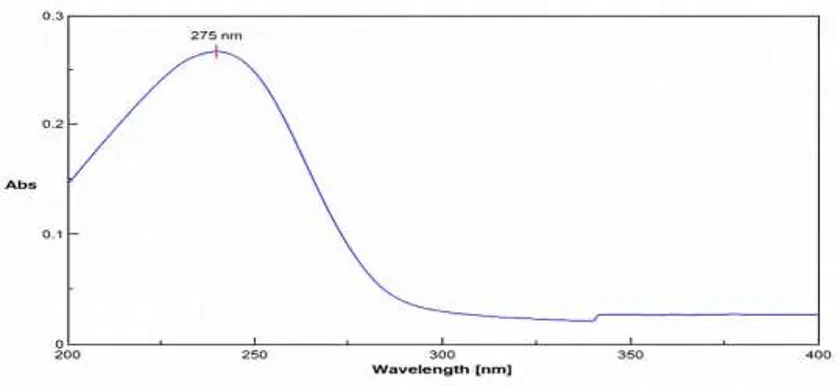
The standard solution of Warfarin was scanned at different concentrations in the range of 200-400nm and the wavelength was found to be 275 against reagent blank.[41]
Analysis of Tablet Formulation
Table 1. Analysis of tablet formulation.
|
Sr. no |
Wt. of stand. (mg) |
Peak area of (µv.sec) |
Mean |
Label claim (%) |
SD |
%RSD |
|
|
WARF
160 mg |
WARF |
WARF |
WARF |
0.01456 |
0.01455 |
|
1 |
269734 |
100.02 |
99.77 |
|||
|
2 |
269745 |
100 |
||||
|
3 |
269756 |
99.97 |
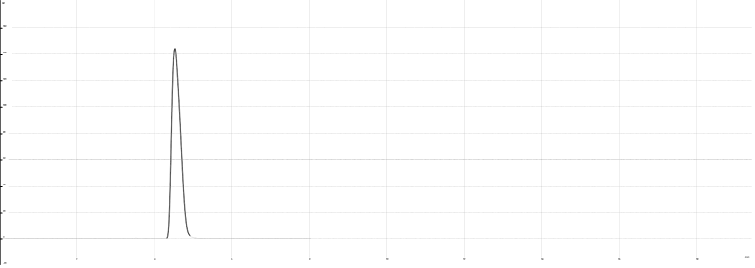
Figure 2. Chromatogram of tablet solutions of Warfarin
|
Sr. No |
Name |
Retention time (Min) |
Peak area (µv.sec) |
NTP |
Asymmetry |
|
1. |
Warfarin |
4.477 |
2697346 |
7079 |
1.17 |
Evaluation of Analytical Method Validation as Per ICH Guidelines:-
Linearity:
Table 2 .Linearity data for Warfarin
|
Standard conc. |
5ug/ml |
10ug/ml |
15ug/ml |
20ug/ml |
25ug/ml |
|
Replicates |
Peak Area (µV.sec) |
||||
|
1. |
169639 |
259579 |
365290 |
469754 |
574536 |
|
2 |
169745 |
225697 |
355345 |
469756 |
575446 |
|
3 |
169797 |
225706 |
355377 |
469767 |
575777 |
|
4 |
169701 |
225776 |
355392 |
469923 |
575679 |
|
5 |
169745 |
225791 |
355491 |
469977 |
575972 |
|
Mean |
169765 |
225732 |
355371 |
469797 |
575506 |
|
SD |
70.9577 |
71.126 |
47.644 |
91.164 |
675.041 |
|
%RSD |
0.04769 |
0.03151 |
0.01367 |
0.03940 |
0.1190 |

Figure 3.calibration curve for Warfarin
Precision:
Table 3: Inter-day variability of Warfarin
|
Conc. (µg/ml) |
Peak area (µV.sec) |
Mean area (µV/sec) |
± SD |
%RSD |
||
|
Day 1 |
Day 2 |
Day 3 |
||||
|
5 |
151179 |
153392 |
153397 |
152656.33 |
1279.41 |
0.7370 |
|
15 |
152691 |
152757 |
152767 |
152705 |
9775.34 |
0.06469 |
|
25 |
150679 |
150972 |
150997 |
150776.33 |
17973.40 |
0.1191 |
Table 4: Intra-day variability of Warfarin
|
Conc. (µg/ml) |
Peak area(µV.sec) |
Mean area (µV/sec) |
± SD |
% RSD |
||
|
Day 1 |
Day 2 |
Day 3 |
||||
|
5 |
151177 |
151177 |
151209 |
151174.66 |
21.7191 |
0.0144 |
|
15 |
152567 |
152679 |
152701 |
152652.33 |
74.144 |
0.04757 |
|
25 |
150946 |
151094 |
150956 |
150997.66 |
72.7123 |
0.05477 |
Accuracy:
Table 5: Recovery study of Warfarin
|
Recovery Level |
Warfarin |
|||||
|
Area (µV.sec) |
Amt. added (mg) |
Amt. recovered (mg) |
% Recovery |
Average recovery % |
% RSD |
|
|
70% |
49346 |
7 |
7.50 |
97.79 |
99.57 |
0.0724 |
|
49349 |
7 |
7.77 |
99.77 |
|||
|
49417 |
7 |
7.97 |
99.97 |
|||
|
100% |
151179 |
10 |
10 |
100 |
99.97 |
0.6777 |
|
152691 |
10 |
9.95 |
99.94 |
|||
|
150679 |
10 |
10 |
100 |
|||
|
120% |
259164 |
12 |
11.99 |
99.97 |
99.9 |
0.1166 |
|
257636 |
12 |
11.97 |
99.96 |
|||
|
257646 |
12 |
11.97 |
99.97 |
|||
Limit of detection(LOD):
Table no.6: Limit of detection
|
Parameters |
Warfarin µg/ml |
|
LOD |
0.02534 |
Limit of Quantitation(LOQ):
Table no.7 : Limit of Quantification
|
Parameters |
Warfarin µg/ml |
|
LOQ |
0.07670 |
Robustness:
Table 8: Robustness study of system suitability parameter change in flow rate (ml/min)
|
System suitability parameter |
Drug |
Change in flow rate (ml/min) |
RSD |
||
|
0.7ml/min |
1 min/ml |
0.7min/ml |
1 min/ml |
||
|
Peak area |
Warfarin |
102776 |
102117 |
0.17 |
0.15 |
|
Theoretical plates. |
Warfarin |
7323 |
7120 |
0.62 |
0.25 |
|
Tailing Factor |
Warfarin |
0.99 |
1.07 |
0.51 |
0.79 |
|
Retention Time (Min) |
Warfarin |
4.79 |
5.55 |
0.56 |
0.55 |
Table 9: Robustness study of system suitability parameter change in wavelength (nm)
|
System suitability parameter |
Drug |
Change in Wavelength |
RSD |
||
|
270 |
270 |
270 |
270 |
||
|
Peak area |
Warfarin |
102575 |
102671 |
0.17 |
0.15 |
|
Theoretical plates. |
Warfarin |
9021 |
7525 |
0.62 |
0.25 |
|
Tailing Factor |
Warfarin |
1.03 |
0.99 |
0.51 |
0.79 |
|
Retention Time (Min) |
Warfarin |
4.35 |
4.46 |
0.56 |
0.55 |
Ruggedness
|
Injection No. |
Analyst 1 Peak Area |
Analyst 2 Peak Area |
|
1 |
245621 |
244970 |
|
2 |
245790 |
245310 |
|
3 |
246110 |
245745 |
|
4 |
245775 |
245420 |
|
5 |
245970 |
245690 |
|
6 |
245760 |
245510 |
|
Parameter |
Analyst 1 |
Analyst 2 |
|
Mean Peak Area |
245773 |
245459 |
|
SD |
163.5 |
296.2 |
|
%RSD |
0.066% |
0.12% |
SUMMARY AND CONCLUSION
The present research work was successfully carried out for the development and validation of a simple, accurate, precise, economical, and reproducible RP-HPLC method for the quantitative estimation of Warfarin in bulk drug and pharmaceutical dosage form. The developed analytical method proved to be suitable for routine quality control analysis of Warfarin according to ICH guideline requirements.
In the present study, different chromatographic conditions were evaluated in order to obtain an optimized and satisfactory chromatographic separation. Various mobile phase combinations such as Methanol:Water, Acetonitrile:Water, Methanol:Acetonitrile, and Methanol:Potassium phosphate buffer were investigated during method optimization. Among all the trials, the mobile phase consisting of Methanol:Potassium phosphate buffer (80:20 v/v) provided sharp, symmetrical, and well-resolved peaks with acceptable retention time and good chromatographic performance. Therefore, this mobile phase was selected as the optimized mobile phase for further analysis.
The developed RP-HPLC method employed Cosmosil C18 column (250 × 4.6 mm ID, 5 µm particle size) using Methanol and Potassium phosphate buffer as mobile phase with UV detection. The method showed satisfactory chromatographic behavior with excellent peak symmetry and reproducibility. The optimized chromatographic conditions resulted in a retention time of approximately 4–5 minutes for Warfarin, indicating rapid analysis and reduced solvent consumption.
The wavelength selected for analysis was found to be 275 nm after scanning the standard solution in the UV region between 200–400 nm. The selected wavelength showed good sensitivity and adequate response for quantitative estimation of Warfarin. The method demonstrated good specificity without interference from excipients, impurities, or solvent peaks, indicating the suitability of the developed method for routine pharmaceutical analysis.
The developed method was validated according to ICH guidelines for various analytical validation parameters such as linearity, precision, accuracy, specificity, robustness, limit of detection (LOD), and limit of quantification (LOQ). The linearity study showed a good correlation coefficient over the concentration range of 5–25 µg/ml, indicating a direct proportional relationship between concentration and peak area. The calibration curve demonstrated excellent linearity with correlation coefficient close to unity, confirming the reliability of the method for quantitative analysis
The precision study including intra-day and inter-day precision demonstrated low %RSD values, which indicated that the developed method possesses good repeatability and reproducibility. The low standard deviation values confirmed that the method is precise and reliable for routine analysis. Accuracy studies performed by recovery method at 80%, 100%, and 120% levels showed excellent recovery values within acceptable limits, confirming the accuracy of the developed method. The percentage recovery values were found near 100%, indicating that the method is free from interference and capable of accurate estimation of Warfarin in dosage forms
The limit of detection (LOD) and limit of quantification (LOQ) values indicated that the developed method is highly sensitive for the estimation of Warfarin even at lower concentrations. The robustness study revealed that small deliberate variations in chromatographic conditions such as flow rate and wavelength did not significantly affect the analytical performance of the method. Hence, the method was found to be robust and reliable during normal laboratory conditions
The developed RP-HPLC method was successfully applied for the analysis of marketed tablet formulation of Warfarin. The assay results were found within acceptable pharmacopoeial limits and close to the labeled claim, demonstrating the applicability of the method for pharmaceutical dosage forms. The chromatograms obtained during tablet analysis showed well-defined and resolved peaks without any interference from formulation excipients.
Overall, the developed RP-HPLC method was found to be simple, rapid, accurate, precise, selective, economical, and reproducible for quantitative estimation of Warfarin in bulk and pharmaceutical dosage forms. The method can be effectively utilized for routine quality control analysis, assay determination, and stability studies in pharmaceutical industries and research
REFERENCES

Kulkarni Amol, Parve K S, Kakde Tanuja, Analytical Method Development and Validation of Warfarin by Quantitative Estimation Method in Bulk and Dosage Form, Int. J. of Pharm. Sci., 2026, Vol 4, Issue 9, 337-346. https://doi.org/10.5281/zenodo.22243777
 10.5281/zenodo.22243777