

We use cookies to ensure our website works properly and to personalise your experience. Cookies policy
Department of Pharmaceutics, Shree Santkrupa College of Pharmacy, SUK- Ghogaon - Karad, Maharashtra, India-41511
This study aimed to develop a hydrocortisone-loaded microemulsion-based hydrogel for improved topical treatment of inflammatory skin disorders. Oleic acid, Tween 80, propylene glycol, and Carbopol 934 were used as formulation components. Preformulation studies confirmed drug purity and compatibility with the excipients. The prepared formulations showed acceptable pH, viscosity, spreadability, drug content, stability, and controlled drug release. The optimized formulation also showed significant anti-inflammatory activity through inhibition of protein denaturation. Overall, the microemulsion-based hydrogel improved hydrocortisone delivery, skin retention, and sustained therapeutic action.
Hydrocortisone is a corticosteroid drug widely used for the treatment of inflammatory skin disorders. However, its topical delivery may be limited due to poor aqueous solubility and inadequate skin permeation. Microemulsion is a promising drug delivery system consisting of oil, surfactant, co-surfactant and aqueous phase, which can improve drug solubility and permeation. Hydrogel is a semisolid formulation that provides good spreadability and prolonged contact with the skin. The combination of microemulsion with hydrogel can enhance drug delivery and provide sustained and controlled release. In the present study, hydrocortisone was incorporated into a microemulsion-based hydrogel. Oleic acid was used as the oil phase, Tween 80 as surfactant and propylene glycol as co-surfactant. Carbopol 934 was used as the gelling agent for preparation of the hydrogel. The prepared formulation was evaluated for its physicochemical properties. 1, 2
2.1 Materials:
The Hydrocortisone used in the present study was procured from SM Pharma and Chemicals, Mumbai. Other formulation ingredients, including Oleic acid, Tween 80, Propylene glycol, Carbopol 934, and Triethanolamine, were procured from Loba Chemicals, Mumbai. These materials were used for the preparation and evaluation of the hydrocortisone-loaded microemulsion-based hydrogel.3
2.2.1 Preformulation Studies and Characterization of Drugs
Preformulation studies represent the foundation of pharmaceutical formulation development. These investigations are carried out to understand the physicochemical characteristics of drug substances and excipients that can influence the quality, stability, safety, and therapeutic effectiveness of the final formulation. Through preformulation evaluation, important information regarding the selection of excipients, formulation techniques, manufacturing process, storage requirements, and packaging systems is obtained. Different parameters including solubility, melting point, particle size distribution, drug–excipient compatibility, dissolution properties, and stability behavior are commonly assessed during these studies. The findings obtained from preformulation investigations help researchers overcome formulation-related challenges, enhance product performance, improve bioavailability, and maintain uniformity and quality throughout production.Drug characterization is a major component of preformulation research and plays a vital role in the successful design of pharmaceutical dosage forms. It includes the systematic analysis of the physical and chemical properties of active pharmaceutical ingredients (APIs), which directly affect drug stability, absorption, efficacy, and overall formulation performance. 4
2.2.1.1 Organoleptic characteristics:
The organoleptic properties of the drug substances were examined through visual and sensory inspection. Parameters such as appearance, colour, odour, and texture were evaluated to assess the basic physical characteristics of the drugs. These observations are useful for the initial identification of the material and provide preliminary information regarding its purity and quality. 5
2.2.1.2 Solubility:
The solubility of hydrocortisone was determined in different solvents to identify suitable components for the preparation of microemulsion-based hydrogel. An excess amount of hydrocortisone was added separately into selected solvents such as distilled water, ethanol, methanol, propylene glycol, PEG 400, Tween 80, oleic acid. The mixtures were shaken continuously using a vortex mixer or water bath shaker until equilibrium was achieved. The solubility behavior was then visually observed.Hydrocortisone was found to be slightly soluble in water and showed good solubility in ethanol, methanol, propylene glycol, PEG 400. 6, 7
2.2.1.3 Melting point:
The melting point of hydrocortisone was determined by using a melting point apparatus. A small quantity of hydrocortisone powder was filled into a capillary tube sealed at one end. The capillary tube was placed in the melting point apparatus and the temperature was increased gradually. The temperature at which hydrocortisone started melting and changed into a clear liquid was noted as the melting point. The observed melting point of hydrocortisone was found to be in the range of 215°C–225°C, which confirms the purity and identity of the drug sample.
7.1.4. Analytical studies by UV-Spectrophotometry
7.1.4.1. Preparation of Standard Stock Solutions Hycdrocortisone
The standard stock solution of hydrocortisone was prepared by accurately weighing 10 mg of hydrocortisone and dissolving it in a small quantity of methanol. The volume was then made up to 100 mL with methanol in a volumetric flask to obtain a stock solution containing 100 µg/mL of hydrocortisone. The solution was sonicated to ensure complete dissolution of the drug.8
2.2.1.4 Preparation of Calibration Curve Solutions of Hydrocortisone
From the prepared stock solution, different concentrations of Hydrocortisone were obtained by appropriate dilution using methanol as the solvent. The absorbance of each diluted solution was recorded at the selected λmax using a UV–Visible spectrophotometer. A calibration curve was then plotted between concentration and absorbance values to determine the linearity and analytical performance of the method.9-13
2.2.1.5 Determination of λmax of Hydrocotisone
The wavelength of maximum absorption (λmax) of hydrocortisone was determined using a UV–Visible spectrophotometer. Accurately measured stock solution of hydrocortisone was suitably diluted with methanol to obtain the working solution. The prepared solution was scanned over the UV range of 200–400 nm using methanol as blank. The absorption spectrum was recorded and the λmax of hydrocortisone was found at:λmax=223 nmThe scanning was carried out under controlled instrumental conditions to obtain accurate and reproducible results.14
2.2.1.6 Identification by FTIR spectroscopy
Infrared Spectroscopy is used for formulation analysis to evaluate any possible chemical interactions between Hydrocortisone and the selected excipients. This technique provides information regarding the molecular structure by analyzing infrared absorption spectra, thereby helping to identify possible physicochemical incompatibilities between the drug and formulation components. The infrared spectra were recorded using an FTIR spectrophotometer.The samples, including pure Hydrocortisone, Hydrocortisone with oleic acid, and Hydrocortisone with Tween 80, were analyzed separately. Samples were prepared by using the KBr pellet technique. Uniform pellets were prepared by compressing the mixture using a hydraulic press under suitable pressure conditions. The prepared pellets were scanned over a wavenumber range of 4000 to 400 cm⁻¹.15
2.2.1.7 Differential Scanning Calorimetry (DSC)[6]
Differential Scanning Calorimetry (DSC) study was carried out to evaluate the thermal behavior and melting characteristics of Hydrocortisone. DSC analysis of the pure drug was performed using a Differential Scanning Calorimeter. Accurately weighed sample of Hydrocortisone (2–5 mg) was placed in a sealed aluminum pan, while an empty aluminum pan was used as a reference.The sample was heated over a temperature range of 30°C to 300°C at a heating rate of 10°C/min under a nitrogen atmosphere. The obtained thermogram was observed for the characteristic endothermic peak corresponding to the melting .16
point of Hydrocortisone.
2.2.1.8Drug-Excipient Compatability
Drug–excipient compatibility study was carried out to evaluate the possible interactions between Hydrocortisone and the excipients.The study was performed to ensure the stability and compatibility of the drug with formulation components during the development process.Compatibility analysis was performed using Fourier Transform Infrared Spectroscopy (FTIR). The FTIR spectra of pure Hydrocortisone, individual excipients, and physical mixtures of Hydrocortisone with selected excipients were recorded using an FTIR spectrophotometer over a scanning range of 4000–400 cm⁻¹.
Pseudo Ternary Phase Diagram
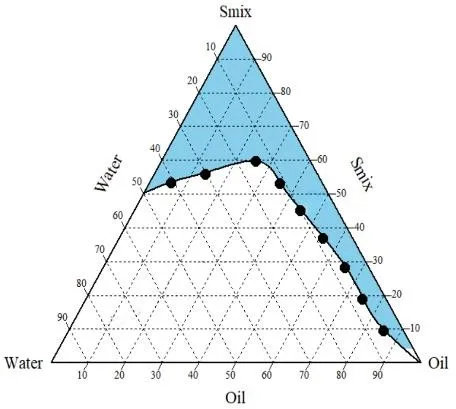
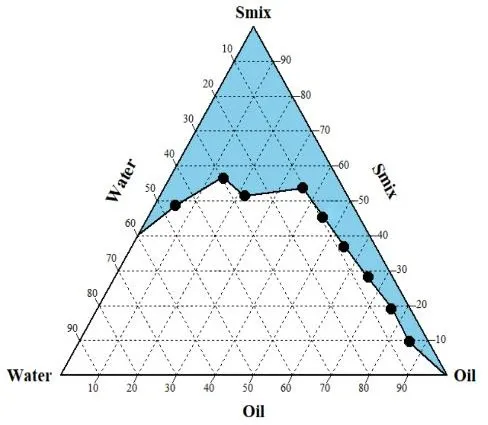
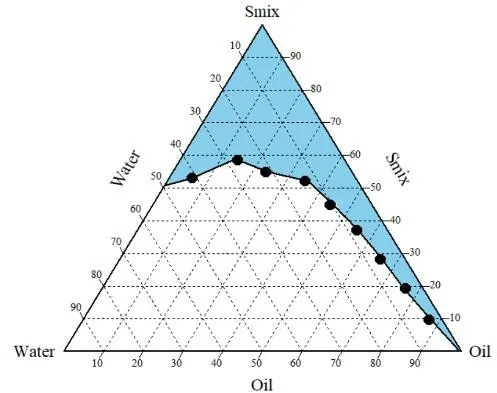
The pseudo-ternary phase diagrams were constructed to identify the suitable microemulsion region and to optimize the concentration of oil, surfactant, and co-surfactant required for formulation development. Oleic acid was selected as the oil phase, Tween 80 was used as the surfactant, and propylene glycol was selected as the co-surfactant based on their excellent solubilizing ability for hydrocortisone observed during solubility studies. Different Smix ratios of surfactant and co-surfactant such as 1:1, 2:1, and 3:1 were prepared for the investigation.
For the preparation of phase diagrams, the oil phase and Smix were mixed in different proportions ranging from 1:9 to 9:1. Distilled water was then added slowly to each mixture under continuous magnetic stirring at room temperature using the water titration method. The prepared systems were visually examined for transparency, clarity, homogeneity, phase separation, and flow characteristics to identify the formation of microemulsion regions. The observations obtained from the study were used to construct pseudo-ternary phase diagrams with the help of Chemix Classroom software. The diagrams assisted in selecting the optimized composition for preparation of a stable and transparent microemulsion formulation.
|
|
|
Figure no 1: Ratio at 1:1 Figure no 2: Ratio at 2:1
|
|
Figure no 3 Ratio at 3:1
2.2.2 Preparation of Microemulsion based Hydrogel:
Table No. 1Preparation of Microemulsion based hydrogel
|
Formulation code |
Hydrocortisone(mg) |
Oleic acid(ml) |
Smix(Tween 80+PG) |
Water(Aqueous phase) |
|
1 |
100 |
0.34 |
2.85 |
6.1 |
|
2 |
100 |
0.34 |
4.27 |
4.6 |
|
3 |
100 |
0.34 |
5.69 |
3.4 |
|
4 |
100 |
0.51 |
2.85 |
6.1 |
|
5 |
100 |
0.51 |
4.27 |
4.6 |
|
6 |
100 |
0.51 |
5.69 |
3.4 |
|
7 |
100 |
0.69 |
2.85 |
6.1 |
|
8 |
100 |
0.69 |
4.27 |
4.6 |
|
9 |
100 |
0.69 |
5.69 |
3.4 |
Hydrocortisone was dissolved in the selected oil phase. The surfactant and co-surfactant were mixed separately to prepare Smix and added to the oil phase with continuous stirring. Distilled water was added dropwise under constant stirring until a clear and transparent microemulsion was formed.Carbopol 934 was dispersed in distilled water and allowed to swell completely. Propylene glycol and preservatives were added, followed by adjustment of pH using triethanolamine to obtain a smooth gel base. microemulsion was slowly incorporated into the prepared gel base with gentle stirring until a homogeneous microemulsion-based hydrogel was obtained. The final formulation was stored in airtight containers for further evaluation.18
2.2.3 Characterization of Microemulsion
2.2.3.1 Appearance:
The appearance of the prepared microemulsion was evaluated by visual inspection under normal light conditions. The formulation was observed for color, clarity, homogeneity, phase separation, and consistency. A good microemulsion should appear transparent or slightly translucent with a uniform texture and should not show any signs of precipitation or phase separation.19-24
2.2.3.2 pH Measurement:
The pH of the prepared hydrocortisone microemulsion was determined using a calibrated digital pH meter at room temperature. Before measurement, the instrument was standardized using buffer solutions of pH 4.0 and 7.0. The electrode was immersed into the formulation and the pH value was recorded after stabilization.The pH of the formulation was maintained within the skin-compatible range to avoid irritation and ensure suitability for topical application. Appropriate pH also plays an important role in maintaining drug stability and formulation performance.
2.2.3.3Viscosity:
The viscosity of the hydrocortisone microemulsion was measured using a Brookfield viscometer at room temperature. An adequate quantity of formulation was placed in the sample container and analyzed using a suitable spindle at a fixed rotational speed.Viscosity is an important parameter that affects the spreadability, consistency, stability, and drug release behavior of the formulation. The prepared microemulsion showed suitable viscosity for topical application with smooth flow characteristics. 25-30
2.2.3.4Particle Size Analysis:
Particle size determination is an essential parameter in the evaluation. as it influences the stability, drug release pattern, and overall therapeutic performance of the system. The particle size distribution of the prepared Formulation was analyzed by using the Dynamic Light Scattering (DLS) technique.This method measures the average diameter of particles suspended in a dispersion medium and also provides information about particle uniformity. Formulation with smaller and uniformly distributed particle size are generally considered more stable and effective for drug delivery applications. Hence, particle size analysis is important for assessing the quality and performance of the developed formulation.31
2.2.3.5Polydispersity index(PDI):
The PDI value is commonly determined using Dynamic Light Scattering (DLS) analysis. In this technique, the scattering behavior of light caused by suspended particles is measured to evaluate particle size distribution. PDI serves as an important indicator for assessing the quality, consistency, and stability of colloidal systems.PDI value below 0.1 indicates excellent homogeneity of particles.
7.4.6. Surface Charge Potential:
The surface charge potential of the hydrocortisone microemulsion was measured using a zeta sizer. This study was carried out to determine the electrical charge present on the surface of the droplets and to evaluate the physical stability of the formulation.A sufficient zeta potential value helps in preventing droplet aggregation by providing electrostatic repulsion between particles. The obtained results indicated good stability of the prepared microemulsion formulation.
2.2.3.6 Stability study:
The stability study of the prepared microemulsion was carried out to evaluate the physical and chemical stability of the formulation during storage. The optimized formulation was stored in tightly closed containers under different storage conditions such as room temperature and accelerated temperature conditions for a specified period.During the study, the formulation was periodically examined for changes in appearance, color, homogeneity, phase separation, pH, viscosity, and drug content. 31-34
2.2.3.6 Drug content:
The drug content of the prepared microemulsion was determined to evaluate the amount of drug present in the formulation. Accurately weighed quantity of Microemlsion was dissolved in phosphate buffer pH 7.4 and mixed properly using a magnetic stirrer or shaker to obtain a uniform solution. The prepared solution was then filtered to remove any undissolved particles.A suitable quantity of the filtrate was withdrawn and further diluted with phosphate buffer pH 7.4. The absorbance of the diluted solution was measured using a UV–Visible spectrophotometer at the selected wavelength against phosphate buffer as blank. The drug content of the formulation was calculated using the standard calibration curve of the drug.
2.2.4 Characterization of Microemulsion based hydrogel
2.2.4.1 pH
The pH of the prepared microemulsion-based hydrogel was determined using a calibrated digital pH meter at room temperature. The pH of topical formulations should be compatible with the skin to avoid irritation and discomfort during application. The prepared formulation showed pH within the acceptable skin-friendly range, indicating its suitability for topical administration and good formulation stability.35
2.2.4.2Spreadability
The spreadability of the developed gel formulation was assessed by employing the slip and drag method using two glass slides. A known quantity of gel was carefully placed between the slides, and a uniform film was formed by applying a fixed weight on the upper slide. Care was taken to ensure even distribution of the gel without trapping air bubbles.After removing the excess formulation, an additional weight was applied to the upper slide, and the time taken for the slide to move a certain distance over the lower slide was measured with the help of a stopwatch. This method is commonly preferred for semisolid formulations because it is simple, accurate, and easy to perform. The spreadability of the gel was then calculated by using the standard formula.
7.5.3 Viscosity
The viscosity of the hydrocortisone microemulsion-based hydrogel was measured using a Brookfield viscometer at room temperature. The viscosity of the formulation influences its consistency, stability, drug release, and ease of application.The prepared hydrogel showed appropriate viscosity with smooth and homogeneous consistency. Suitable viscosity helps the formulation remain at the site of application for a longer duration and provides better topical performance.
7.5.4 Scanning Electron Microscopy (SEM)
Scanning Electron Microscopy (SEM) analysis was performed to study the surface morphology and structural properties of the prepared hydrocortisone microemulsion-based hydrogel. SEM helps in examining the surface appearance, texture, and internal structure of the formulation at high resolution.For the analysis, a small quantity of dried hydrogel sample was fixed on an aluminum stub using adhesive tape and coated with a thin gold layer to improve conductivity. The prepared sample was then observed under a Scanning Electron Microscope at suitable magnification.36
2.2.4.2 In vitro anti-inflammatory activity by Protein denaturation method
The reaction mixture (10 mL) consisted of 0.4 mL of egg albumin, 5.6 mL of phosphate buffered saline (PBS, pH 6.4) and 100 µL of different concentration sample. Similar volume of double-distilled water served as control. Then the mixtures were incubated at (370c ±2) in a incubator for 15 min and then heated at 70oc for 5 min. After cooling, their absorbance was measured at 660 nm by using vehicle as blank. Diclofenac sodium at the concentration was used as reference drug and treated similarly for determination of absorbance. The percentage inhibition of protein denaturation was calculated by using the following formula,
% Inhibition = C –T/ C
Where,
T = absorbance of test sample
2.2.4.3 In vitro drug relase study
The in vitro drug release study of the hydrocortisone-loaded microemulsion based hydrogel was carried out using the dialysis membrane diffusion technique. Phosphate buffer solution of suitable pH was used as the dissolution medium to maintain sink conditions and ensure proper diffusion of the drug throughout the study. A measured quantity of the prepared microemulsion based hydrogel was placed carefully inside a pre-soaked dialysis membrane, and both ends of the membrane were tied securely to prevent leakage of the formulation.The prepared dialysis bag was then suspended in the receptor compartment containing the dissolution medium and maintained at a temperature of 37±2°C under continuous stirring at 50 rpm to simulate physiological conditions. At predetermined time intervals, a specific volume of sample was withdrawn from the receptor medium and immediately replaced with an equal quantity of fresh dissolution medium in order to maintain constant volume and sink conditions during the experiment.The withdrawn samples were suitably diluted and analyzed using a UV-visible spectrophotometer at the selected wavelength of hydrocortisone. The cumulative percentage drug release from the microemulsion based hydrogel formulation was calculated and recorded for evaluation of the drug release behavior.38-40
3.RESULTS AND DISCUSSION:
3.1 Preformulation Studies and Characterization of Drugs
3.1.1. Organoleptic Properties
Hydrocortisone was observed as a white to slightly creamy crystalline powder with no characteristic odour. The appearance and texture confirmed the purity and identity of the drug sample.
Table .2 Identification tests for Hydrocortisone
|
Sr.no |
Parameters |
Description of Hydrocortisone |
|
1. |
Physical Appearance |
White or almost white crystalline powder |
|
2. |
Colour |
White to off-white |
|
3. |
Odour |
Odourless or nearly odourless |
|
4. |
Texture. |
Fine, smooth crystalline powder |
3.1.2Solubility:
The solubility behaviour of Hydrocortisone was evaluated in different solvents used for Microemulsion preparation. The drug showed varying degrees of solubility depending on the solvent system.
Table 8.2: Solubility profile of Hydrocortisone in different solvents
|
Sr.no |
Solvent |
Solubility |
|
1. |
Water |
Slightly Soluble
|
|
2. |
Ethanol |
Soluble
|
|
3. |
Methanol |
Soluble
|
|
4. |
DMSO |
Freely Soluble
|
3.1.3 Melting point:
The melting point of Hydrocortisone was determined and found to be approximately 215°C–220°C, which is in agreement with the reported standard values. The obtained result indicates good purity and stability of the drug.
Table .3 Melting point of Hydrocortisone
|
Drug Name |
Observed melting point (°C) |
|
Hydrocortisone |
218°C |
3.1.4Analytical studies by UV-Spectrophotometry:
Determination of λmax of Hydrocortisone:
The maximum wavelength was found to be 242nm from the Hydrocortisone spectra which was chosen for the study.
Standard calibration curve Hydrocortisone:
The graph of absorbance versus concentration for pure Hydrocortisone was obtained at 223 nm using UV–Visible spectroscopy. The calibration curve was plotted by using the values of concentration and corresponding absorbance data.
Table No.4 Absorbance value at various concentration of Hydrocortisone in methanol
|
Sr. No |
Concentration (μg/ml) |
Absorbance |
|
1 |
2 |
0.118 |
|
2 |
4 |
0.236 |
|
3 |
6 |
0.351 |
|
5 |
8 |
0.469 |
|
5 |
10 |
0.585 |
|
6 |
12 |
0.704 |
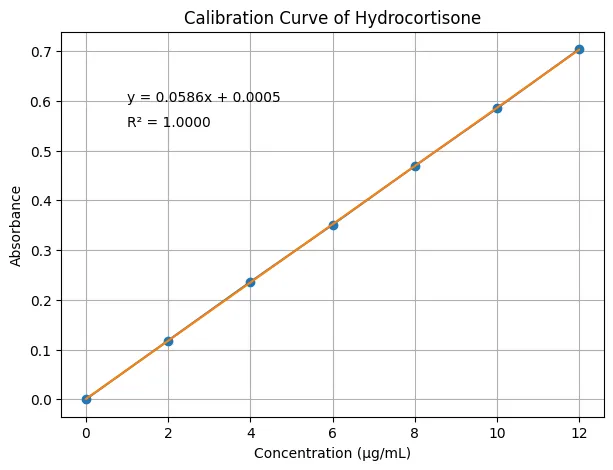
Fig. No. 4Calibration curve of Hydrocortisone in methanol
3.1.5 Identification by FTIR spectroscopy:
FTIR of Hydrocortisone:
The FTIR spectrum of Hydrocortisone was recorded using an FTIR spectrophotometer. The spectrum was obtained in the range of 4000 to 400 cm⁻¹. The IR spectrum showed the characteristic peaks corresponding to the functional groups present in hydrocortisone. From the observed characteristic peaks, it was concluded that hydrocortisone was present in pure form and exhibited all the characteristic functional groups of the drug.
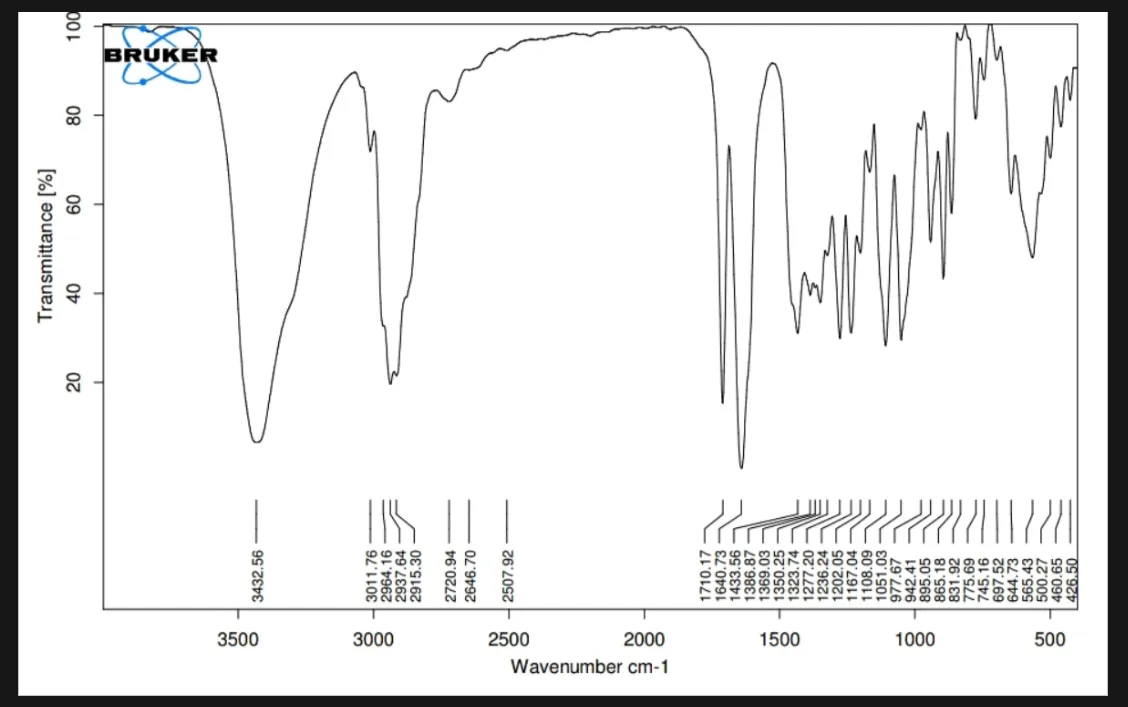
Fig. No. 5 FTIR Spectrum of Hydrocortisone Drug
The FTIR spectrum of Hydrocortisone was recorded using an FTIR spectrophotometer (Alpha II Bruker). The spectrum was obtained in the range of 4000 to 400 cm⁻¹ and is shown in Figure. The observed peaks at 3432.56 cm⁻¹ indicated O–H stretching of the hydroxyl group, while the peaks at 3011.76 cm⁻¹ and 2967.16 cm⁻¹ corresponded to C–H stretching vibrations. A strong characteristic peak observed at 1719.17 cm⁻¹ confirmed the presence of the carbonyl (C=O) functional group. The spectrum also showed characteristic peaks for alkane, alcohol, and aromatic groups. From the obtained FTIR spectrum, it was concluded that hydrocortisone was present in pure form and showed all characteristic functional groups of the drug.
3.1.6 Drug-excipient compatibility studies by IR spectroscopy:
FTIR of Hydrocortisone with oleic acid
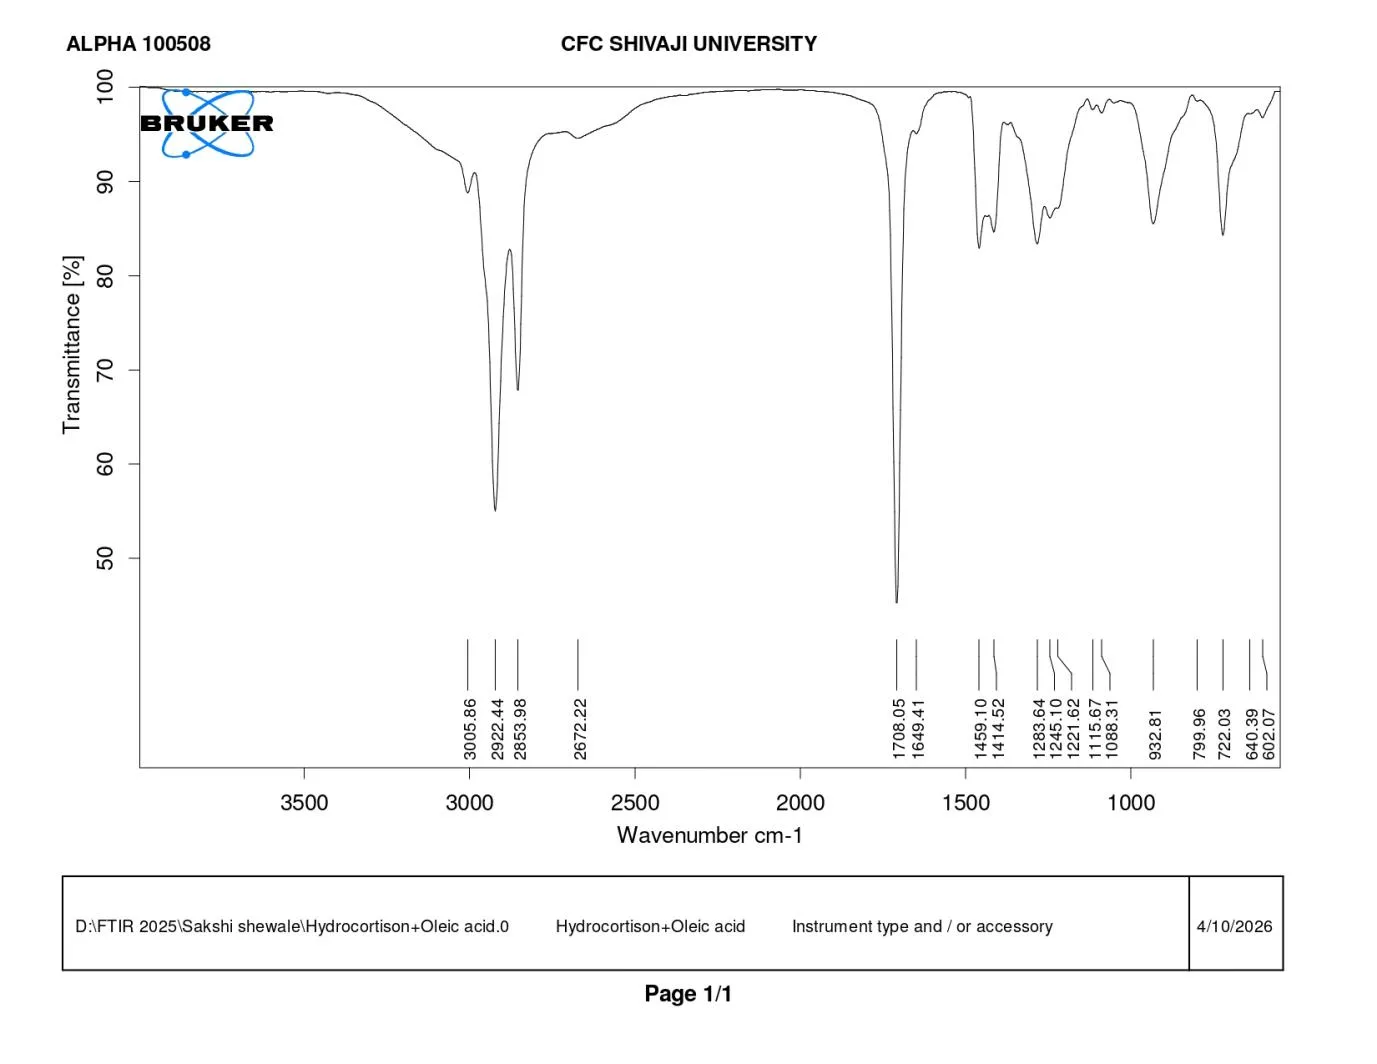
Fig. No. 6 FTIR Spectra of Hydrocortisone and Oleic acid
The FTIR spectrum of the physical mixture of Hydrocortisone and oleic acid was recorded using an FTIR spectrophotometer (Alpha II Bruker). The spectrum was obtained in the range of 4000 to 400 cm⁻¹ and is shown in Figure. The characteristic peaks observed at 3005.86 cm⁻¹, 2929.44 cm⁻¹, and 2853.98 cm⁻¹ indicated C–H stretching vibrations of alkane and aliphatic chains. A strong peak observed at 1708.05 cm⁻¹ confirmed the presence of the carbonyl (C=O) functional group. Peaks at 1459.10 cm⁻¹ and 1283.64 cm⁻¹ corresponded to C–H bending and C–O stretching vibrations respectively. The characteristic peaks of hydrocortisone and oleic acid were retained without significant shifting, indicating the compatibility of the drug with the excipient and absence of chemical interaction.
FTIR of Hydrocortisone with Tween 80
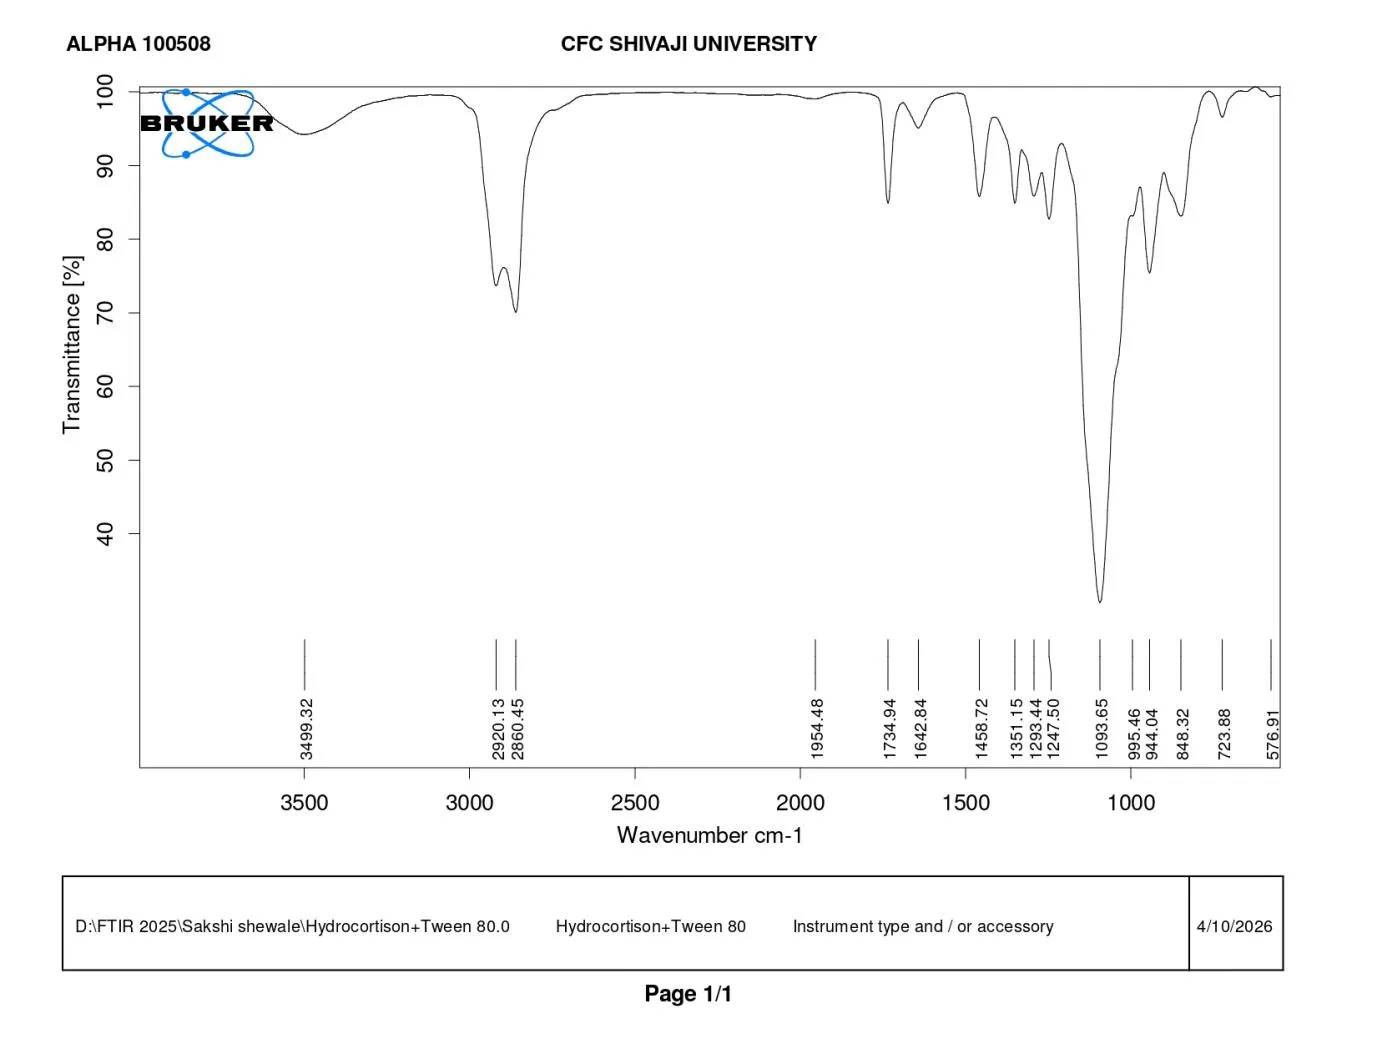
Fig. No.7 FTIR Spectra of Hydrocortisone and Tween 80
The FTIR spectrum of the physical mixture of Hydrocortisone and Tween 80 was recorded using an FTIR spectrophotometer (Alpha II Bruker). The spectrum was obtained in the range of 4000 to 400 cm⁻¹ and is shown in Figure. The broad peak observed at 3499.32 cm⁻¹ indicated O–H stretching vibration of the hydroxyl group. The peaks at 2920.13 cm⁻¹ and 2860.45 cm⁻¹ corresponded to C–H stretching vibrations of aliphatic chains. A characteristic peak at 1734.94 cm⁻¹ confirmed the presence of the carbonyl (C=O) functional group. The peaks observed at 1247.50 cm⁻¹ and 1093.65 cm⁻¹ indicated C–O stretching vibrations. The characteristic peaks of hydrocortisone and Tween 80 were retained without major shifting, indicating good compatibility and absence of chemical interaction between the drug and excipient.
FTIR of prepared Microemulsion
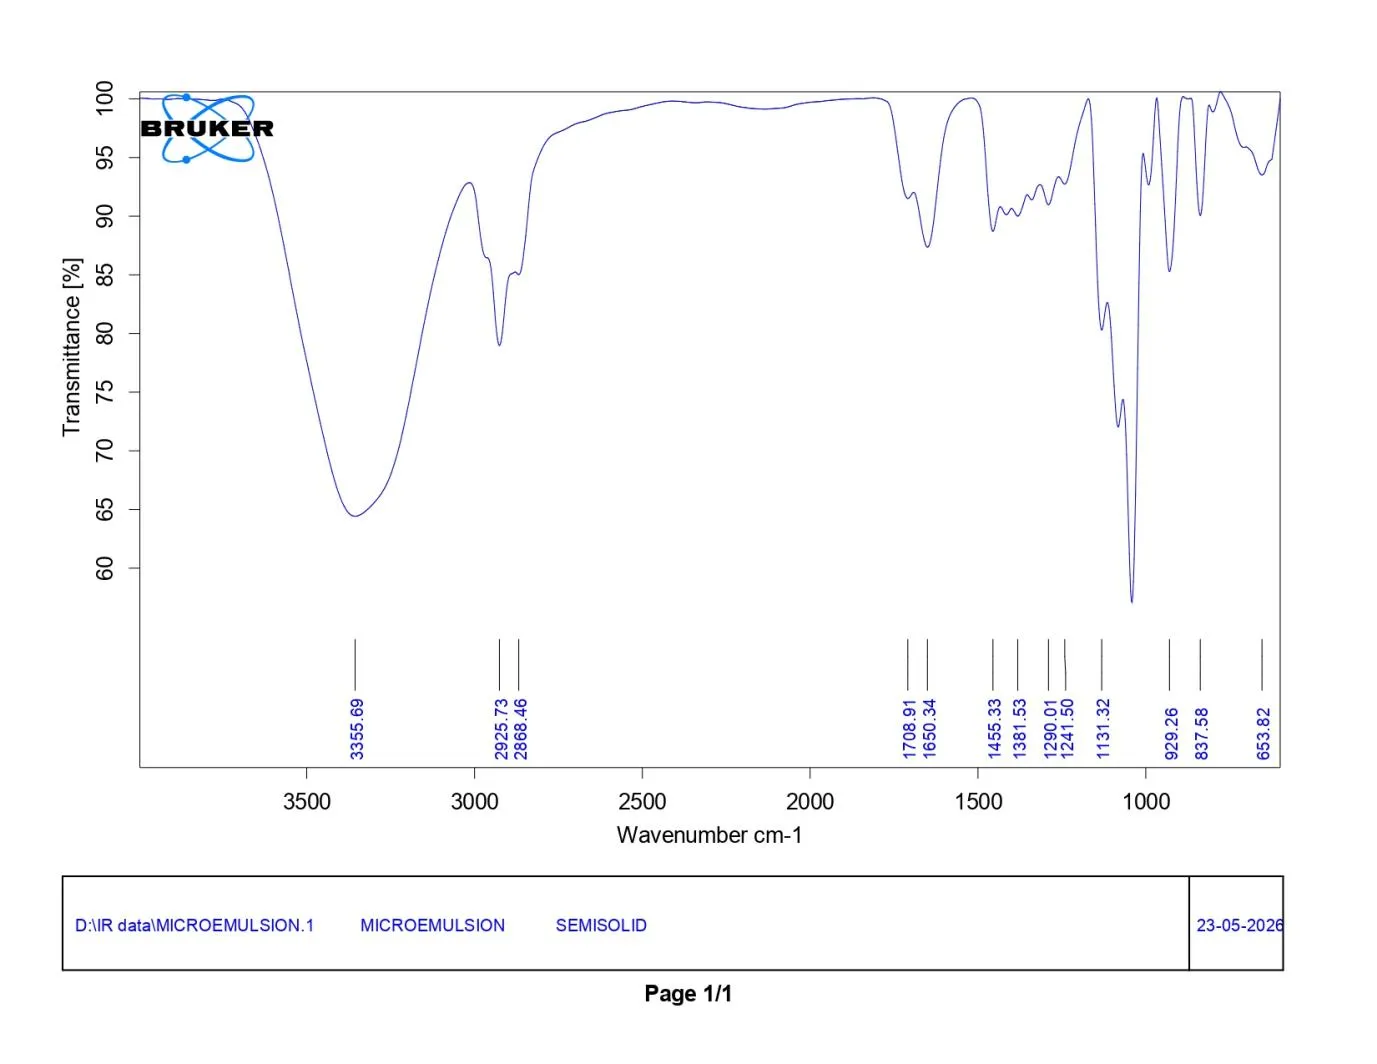
Fig. No. 8 FTIR of Microemulsion
The FTIR spectrum of the prepared microemulsion containing Hydrocortisone was recorded using an FTIR spectrophotometer. The spectrum was obtained in the range of 4000 to 400 cm⁻¹ and is shown in Figure. The broad peak observed at 3355.69 cm⁻¹ indicated O–H stretching vibration of the hydroxyl group. The peaks at 2925.73 cm⁻¹ and 2868.46 cm⁻¹ corresponded to C–H stretching vibrations of aliphatic chains. A characteristic peak observed at 1708.91 cm⁻¹ confirmed the presence of the carbonyl (C=O) functional group. The peaks at 1290.01 cm⁻¹ and 1131.32 cm⁻¹ indicated C–O stretching vibrations. The characteristic peaks of hydrocortisone and excipients were retained without significant shifting, indicating compatibility of the drug with excipients and successful formulation of the microemulsion without any chemical interaction.
3.1.7 Differential Scanning Calorimetry (DSC):
DSC study Hydrocortisone
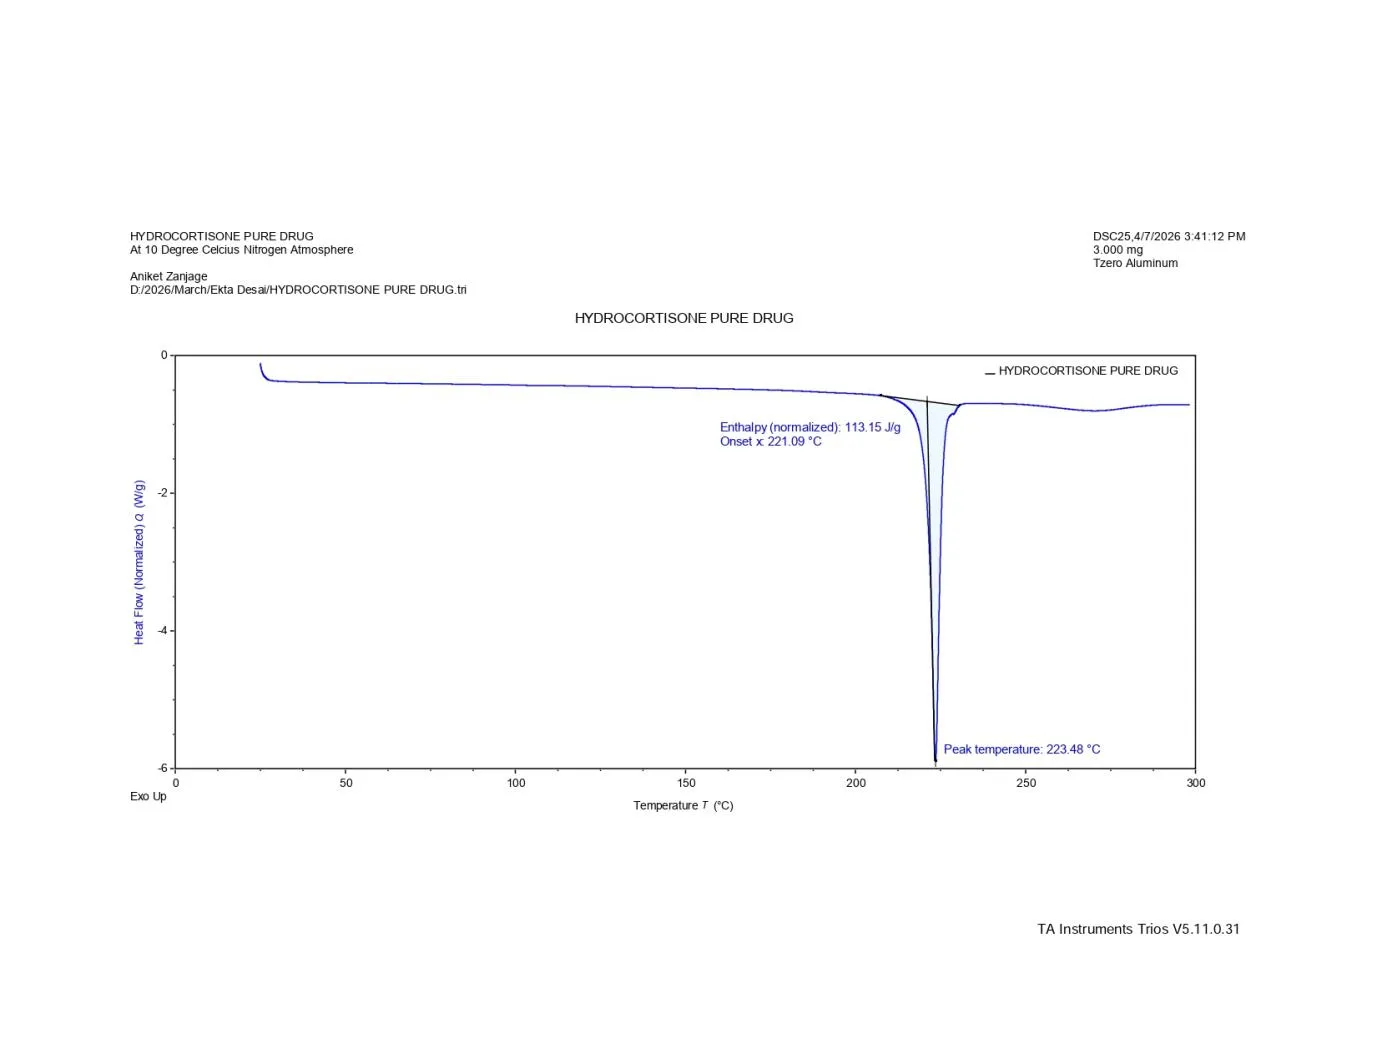
Fig. No.9DSC of Liranaftate Drug:
The DSC thermogram of Hydrocortisone was recorded using a Differential Scanning Calorimeter under nitrogen atmosphere at a heating rate of 10 °C/min. The DSC curve showed a sharp endothermic peak at 223.48 °C, which corresponds to the melting point of hydrocortisone. The onset temperature was observed at 221.09 °C with an enthalpy value of 113.15 J/g. The sharp and well-defined endothermic peak indicated the crystalline nature and purity of the drug. The obtained DSC thermogram confirmed that hydrocortisone was present in stable crystalline form without any sign of decomposition or impurity.
3.2 Experimental Design
ANOVA for Quadratic model
Response 1: Particle Size
Table No.5 Response Table of Particle Size
|
Source |
Sum of Squares |
df |
Mean Square |
F-value |
p-value |
|
|
Model |
410.37 |
5 |
82.07 |
1820.14 |
< 0.0001 |
significant |
|
A-Oleic acid |
368.17 |
1 |
368.17 |
8164.68 |
< 0.0001 |
|
|
B-Smix |
36.51 |
1 |
36.51 |
809.59 |
< 0.0001 |
|
|
AB |
0.2025 |
1 |
0.2025 |
4.49 |
0.1243 |
|
|
A² |
1.39 |
1 |
1.39 |
30.80 |
0.0115 |
|
|
B² |
4.11 |
1 |
4.11 |
91.12 |
0.0024 |
|
|
Residual |
0.1353 |
3 |
0.0451 |
|
|
|
|
Cor Total |
410.51 |
8 |
|
|
|
|
The Model F-value of 1820.14 implies the model is significant. P-values less than 0.0500 indicate model terms are significant. In this case A, B, A², B² are significant model terms.
Fit Statistics
Table No. 6 Fit Statistics of Particle size
|
Std. Dev. |
0.2124 |
R² |
0.9997 |
|
Mean |
144.91 |
Adjusted R² |
0.9991 |
|
C.V. % |
0.1465 |
Predicted R² |
0.9961 |
|
|
|
Adeq Precision |
118.8120 |
The Predicted R² of 0.9961 is in reasonable agreement with the Adjusted R² of 0.9991; i.e. the difference is less than 0.2.
Adeq Precision measures the signal to noise ratio. A ratio greater than 4 is desirable. Your ratio of 118.812 indicates an adequate signal. This model can be used to naviFinal Equation in Terms of Coded Factors
Response 1: Particle Size, Y1
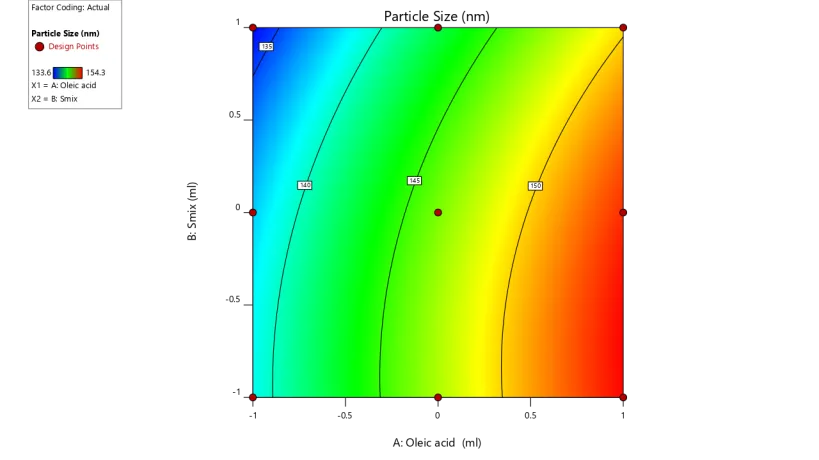
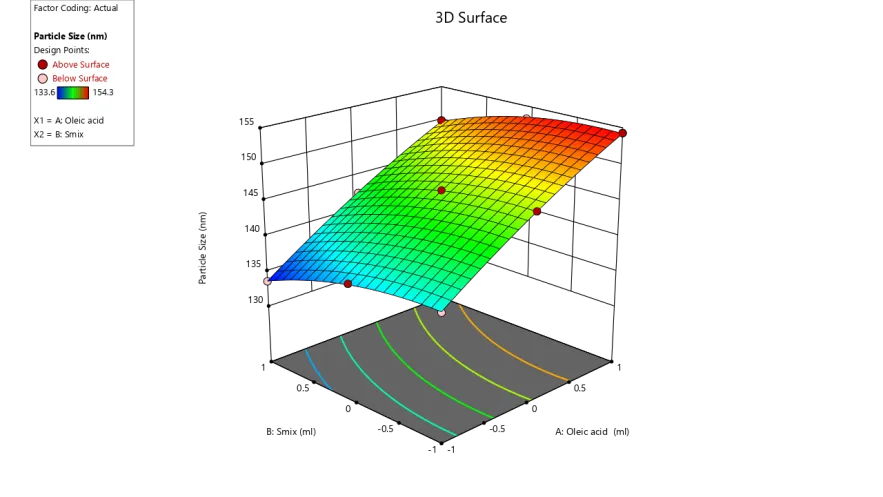
Y1 = 146.42+7.83X1-2.47X2+0.2250X1X2-0.8333X12-1.43X22 …. Eq (1)gate the design space.
|
|
|
Fig no 10 2D Contour plots and 3D Response surface plots for evaluating influence of Oleic acid (X1) and Smix (X2) on Particle size (Y1)
Effect of Independent Variables on Particle Size
The particle size of the prepared microemulsion-based hydrogel was strongly affected by the concentration of oleic acid (X1) and Smix (X2). It was observed that increasing the amount of oleic acid led to an increase in particle size because a higher oil content produced larger dispersed droplets within the system. On the other hand, increasing the concentration of Smix decreased the particle size due to effective reduction of interfacial tension and improved stabilization of droplets. The obtained contour and response surface plots cleay demonstrated that both formulation variables significantly influenced particle size and overall formulation stability.
ANOVA for Quadratic model
Response 2: Viscosity
Table No. 7 Response of Viscosity
|
Source |
Sum of Squares |
df |
Mean Square |
F-value |
p-value |
|
|
Model |
3.152E+06 |
5 |
6.304E+05 |
14100.68 |
< 0.0001 |
significant |
|
A-Oleic acid |
2.937E+06 |
1 |
2.937E+06 |
65703.74 |
< 0.0001 |
|
|
B-Smix |
2.121E+05 |
1 |
2.121E+05 |
4743.77 |
< 0.0001 |
|
|
AB |
1.0000 |
1 |
1.0000 |
0.0224 |
0.8906 |
|
|
A² |
0.2222 |
1 |
0.2222 |
0.0050 |
0.9482 |
|
|
B² |
2496.89 |
1 |
2496.89 |
55.85 |
0.0050 |
|
|
Residual |
134.11 |
3 |
44.70 |
|
|
|
|
Cor Total |
3.152E+06 |
8 |
|
|
|
|
The Model F-value of 14100.68 implies the model is significant. P-values less than 0.0500 indicate model terms are significant. In this case A, B, B² are significant model terms.
Fit Statistics
Table -8
|
Std. Dev. |
6.69 |
R² |
1.0000 |
|
Mean |
6086.89 |
Adjusted R² |
0.9999 |
|
C.V. % |
0.1098 |
Predicted R² |
0.9996 |
|
|
|
Adeq Precision |
325.2024 |
The Predicted R² of 0.9996 is in reasonable agreement with the Adjusted R² of 0.9999; i.e. the difference is less than 0.2.
Adeq Precision measures the signal to noise ratio. A ratio greater than 4 is desirable. Your ratio of 325.202 indicates an adequate signal. This model can be used to navigate the design space
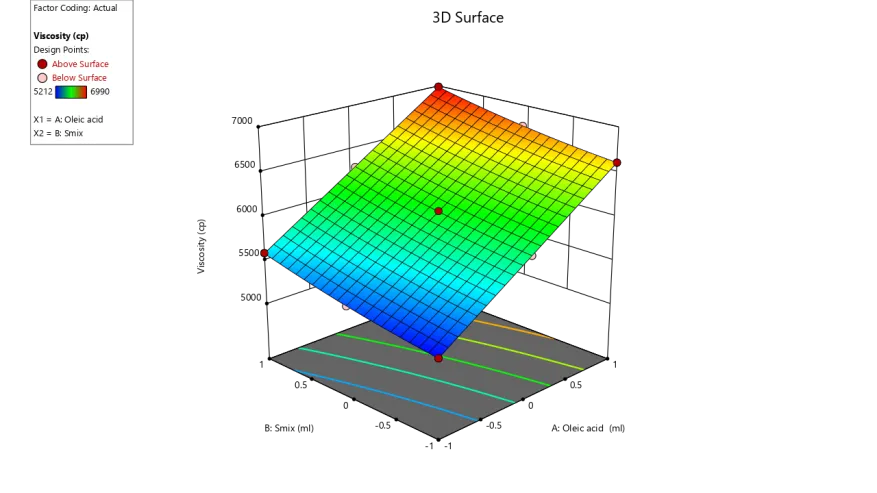
Response 2: Viscosity, Y2
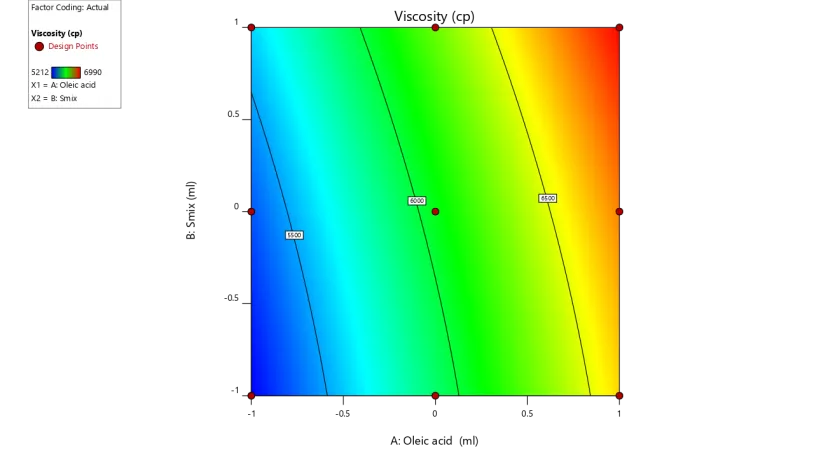
Y2 = 6063.11+699.67X1+188.00X2+0.5000X1X2+0.3333X12+35.33X22 ……. Eq (2)
|
|
|
Figure .11 2D Contour plots and3D Response surface plots for evaluating influence of Oleic acid (X1) and Smix (X2) on Viscosity (Y2)
Effect of Independent Variables on Viscosity
The viscosity of the developed formulation was significantly influenced by both oleic acid (X1) and Smix (X2). An increase in oleic acid concentration resulted in higher viscosity because of the increase in internal phase volume and thicker consistency of the formulation. Similarly, higher concentration of Smix also contributed to improved viscosity by enhancing the structural arrangement and uniformity of the microemulsion system. The response surface analysis confirmed that both variables showed a positive effect iscosity and helped in obtaining a stable formulation with suitable consistency for topical application.
3.3 Characterization of Microemulsion
3.3.1 Appearance:The microemulsion appeared translucent to slightly opalescent with no phase sepration or creaming,indicating stable dispersion and successful emulsification.
3.3.2 Viscosity
The viscosity of the prepared microemulsion formulations ranged from 52 cP to 98 cP, indicating low to moderate viscosity suitable for topical microemulsion application.
3.3.3 Particle size
The particle size of the prepared microemulsion formulations ranged from 133.6 nm to 148.0 nm, indicating the successful formation of nano-sized globules. Among all formulations, batch F3 showed the smallest particle size of 133.6 nm, which suggested better emulsification efficiency and uniform droplet distribution.
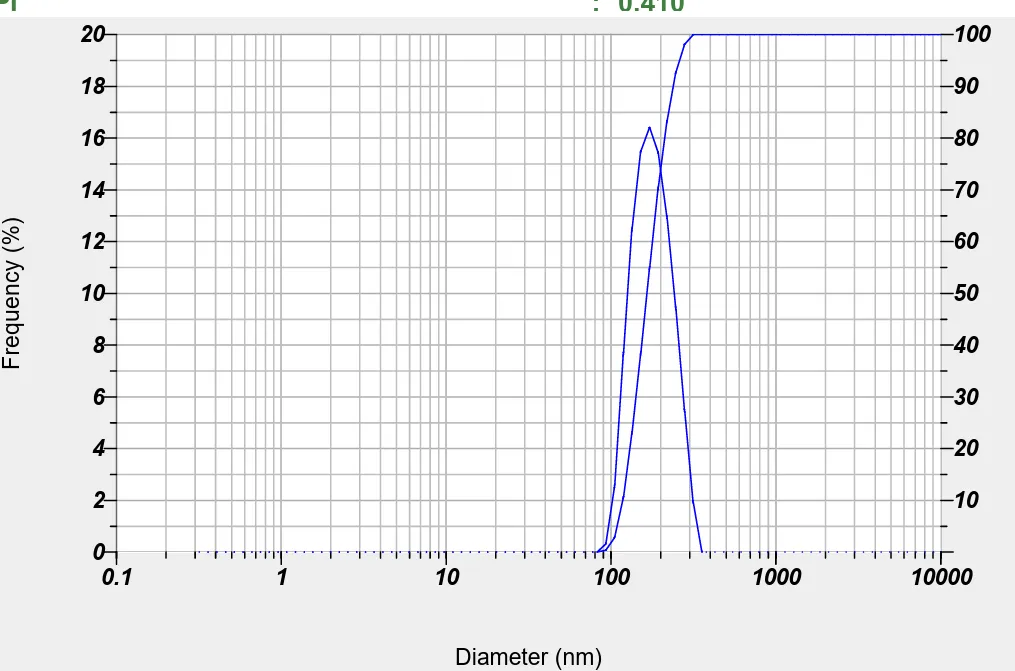
Fig .12 Particle size Analysis
8.3.4 Polydispersity Index
The polydispersity index (PDI) values of the prepared nanoemulgel formulations were found to be in the range of 0.286 to 0.417, indicating satisfactory uniformity in particle size distribution. Lower PDI values represent better homogeneity and stability of the formulation. Among all the batches, formulation F4 exhibited the lowest PDI value (0.286), suggesting a more uniform particle distribution and improved formulation stability.
3.4.4 Zeta potential
Zeta potential analysis was performed to evaluate the stability of the prepared microemulsion system under stress and storage conditions according to ICH stability guidelines. The optimized formulation having nanosized globules showed a zeta potential value of –23.4 mV, which indicated good stability of the colloidal system due to sufficient electrostatic repulsion between the particles. The negative zeta potential value suggested lower chances of particle aggregation and confirmed uniform dispersion of the formulation.
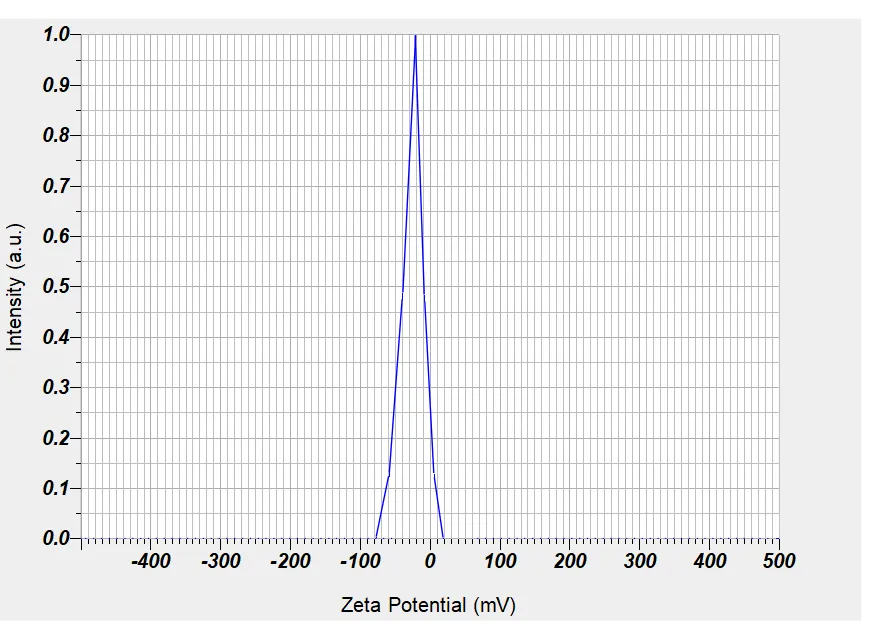
Fig 8.9:Zeta Potential
3.4.5 Stability study:
The formulation was also observed no any signs of creaming, cracking, or microbial growth. The obtained results indicated that the prepared microemulsion-based hydrogel remained stable throughout the study period without showing any significant changes in its physicochemical properties.The stability study confirmed that the developed formulation possessed good stability and was suitable for topical application.
3.4.6 Drug content:
The drug content of the prepared microemulsion formulations was found to be in the range is 91.24% indicating uniform distribution of drug within the formulation. showed satisfactory drug content, which confirms proper mixing and good incorporation of the drug into the Microemulsion. the highest drug content of 98.63%, suggesting better drug entrapment and formulation uniformity. The obtained results indicate that the prepared microemulsion formulations possessed acceptable drug content suitable for topical application.
3.5 Characterization of Microemulsion based hydrogel:
3.5.1 Visual Inspection
The prepared Hydrocortisone loaded of microemulsion based hydrogel was found to be transperent,smooth,uniform in apperance there is no sign of phase sepration
3.5.2 pH Determination
The pH of the prepared microemulsion-based hydrogel formulations was measured using a digital pH meter. About 1 g of hydrogel was dispersed in distilled water and stirred properly to obtain a uniform solution before measurement. The pH values of all formulations were found to be in the range of 5.4 to 6.4, which is considered suitable for topical application and compatible with normal skin pH. The obtained pH values indicated that the formulations may minimize the possibility of skin irritation and are appropriate for dermal drug delivery.
3.5.3 Spredability
The spreadability of the prepared nanoemulgel formulations was evaluated to determine the ease of application on the skin surface. The obtained spreadability values were found in the range of 13.58 to 18.14, indicating satisfactory consistency and smooth spreading characteristics of the formulations. Good spreadability ensures uniform distribution of the gel over the affected area and enhances patient acceptability. Among all the formulations, batch F3 exhibited the highest spreadability value of 18.14, suggesting better applicability and suitability for topical administration.
3.5.4Viscosity:
The viscosity of the prepared microemulsion-based hydrogel formulations was determined using a Brookfield viscometer at controlled shear rate conditions. It was observed that the viscosity of the formulations increased gradually with an increase in polymer concentration. The obtained viscosity values indicated good consistency, satisfactory spreadability, and suitable rheological behavior for topical application. The results suggested that the polymer concentration significantly influenced the viscosity and stability of the hydrogel formulations.
3.5.5 SEM of microemulsion based hydrogel:
Fig 8.10:Scanning electron microscopy
The scanning electron microscopy (SEM) image of the Microemulsion based hydrogel is presented in the figure. The SEM analysis showed that the droplets were nearly spherical or globular in shape and present within the micrometer size range. The micrograph also indicated slight aggregation of particles, which may have occurred due to the removal or evaporation of water during the sample preparation process before SEM examination.
3.5.7 Ant inflammatory activity:
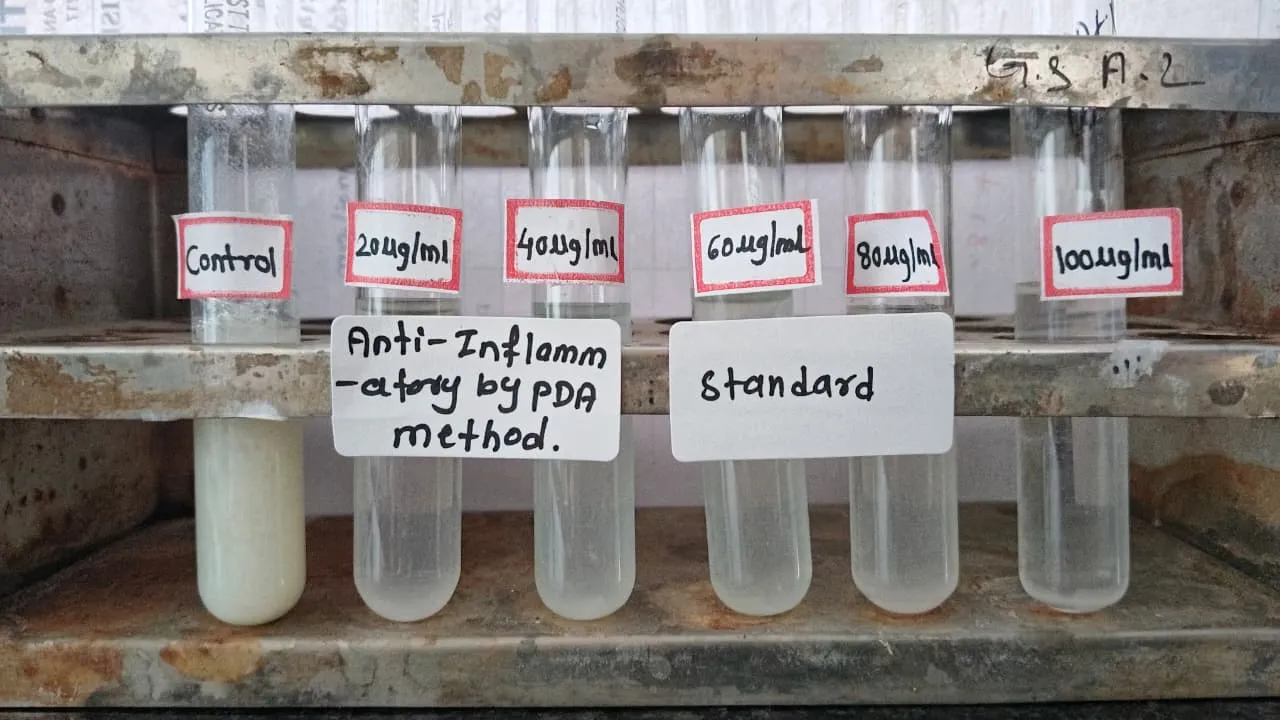
Fig 8.11:Anti inflammatory activity by PDA method
Table No.9 Anti-inflammatory activity
|
|
|
|
Protein Denaturation Assay |
|||||
|
SR.NO |
Sample code |
Concentration (µg/mL) |
Absorbance at 660 nm |
|
|
|||
|
|
|
|
Test 1 |
Test 2 |
Test 3 |
Mean |
% of Inhibition |
IC50 (µg/mL) |
|
1 |
Control |
|
1.54 |
1.54 |
1.54 |
1.54 |
- |
52.21 |
|
2 |
Standard (Diclofenac Sodium) |
20 |
1.20 |
1.20 |
1.22 |
1.20 |
22.08% |
|
|
|
|
40 |
0.91 |
0.89 |
0.93 |
0.91 |
40.91% |
|
|
|
|
60 |
0.67 |
0.65 |
0.63 |
0.65 |
57.79% |
|
|
|
|
80 |
0.40 |
0.37 |
0.44 |
0.40 |
74.03% |
|
|
|
|
100 |
0.21 |
0.18 |
0.23 |
0.20 |
87.01% |
|
|
|
|
|
|
|
|
|
|
|
|
3 |
Microemulsion based hydrogel |
20 |
1.43 |
1.39 |
1.46 |
1.43 |
7.36% |
96.10 |
|
|
|
40 |
1.28 |
1.24 |
1.32 |
1.28 |
16.88% |
|
|
|
|
60 |
1.16 |
1.11 |
1.19 |
1.15 |
25.11% |
|
|
|
|
80 |
0.95 |
0.9 |
0.98 |
0.94 |
38.74% |
|
|
|
|
100 |
0.71 |
0.69 |
0.73 |
0.71 |
53.90% |
|
anti-inflammatory activity of the microemulsion-based hydrogel was evaluated using the Protein Denaturation Assay (PDA) method and compared with the standard drug at different concentrations (20–100 µg/ml). The results revealed a concentration-dependent increase in the percentage inhibition of protein denaturation for both the standard and the formulated hydrogel. The standard drug exhibited strong anti-inflammatory activity with inhibition values of approximately 22%, 41%, 58%, 75%, and 88% at increasing concentrations. The microemulsion-based hydrogel also demonstrated appreciable inhibition, showing around 8%, 17%, 25%, 39%, and 54% inhibition at the respective concentrations. Although the activity of the hydrogel formulation was lower than that of the standard, the steady increase in inhibition with concentration indicates significant anti-inflammatory potential. The ability of the formulation to inhibit protein denaturation suggests that the microemulsion-based hydrogel may be effective in reducing inflammatory responses and could serve as a promising topical anti-inflammatory delivery system
3.5.7 in vitro drug release study:
Table No. 10. in vitro Drug release study
|
Time |
F1 |
F2 |
F3 |
F4 |
F5 |
F6 |
F7 |
F8 |
F9 |
|
0 |
0 |
0 |
0 |
0 |
0 |
0 |
0 |
0 |
0 |
|
1 |
7.8 |
9.1 |
8.9 |
7 |
6.8 |
7.9 |
8.7 |
9.5 |
7.5 |
|
2 |
14.2 |
17 |
13.2 |
12.8 |
11.2 |
13.8 |
15.8 |
15 |
14 |
|
3 |
16.5 |
24.2 |
22.8 |
20.2 |
18.2 |
18.5 |
23 |
25 |
19.2 |
|
4 |
28.5 |
37.5 |
32 |
26 |
24.5 |
27.5 |
26.5 |
34.5 |
26 |
|
5 |
35.2 |
43.8 |
40.2 |
33.5 |
31.2 |
34 |
37 |
46 |
36.2 |
|
6 |
42 |
49 |
46.8 |
39.8 |
40 |
40.8 |
45 |
51 |
40 |
|
7 |
49.5 |
53.5 |
54.2 |
43.5 |
44 |
48 |
51 |
58.2 |
46 |
|
8 |
57 |
64 |
62.8 |
53 |
50.5 |
56.2 |
59.2 |
65.5 |
51.5 |
|
9 |
63.8 |
76 |
68.4 |
59.5 |
57 |
61.5 |
67.5 |
69.5 |
60 |
|
10 |
71.2 |
79.5 |
74.2 |
66.2 |
63.5 |
68.8 |
74 |
81 |
67.2 |
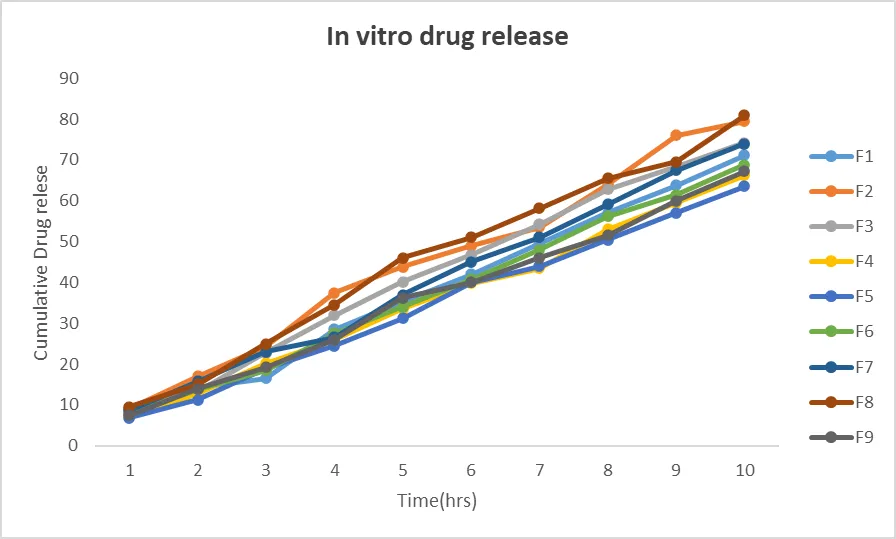
Fig. No. 12 in vitro Drug Release
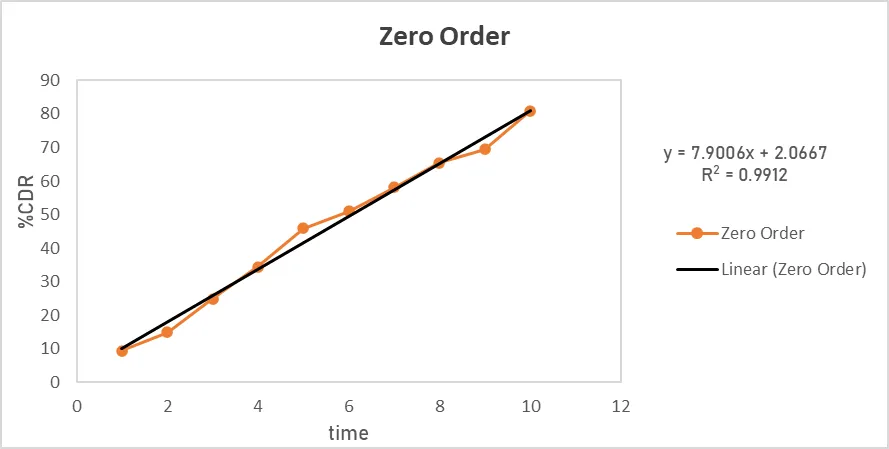
Fig. No. 13 Zero-Order Kinetics
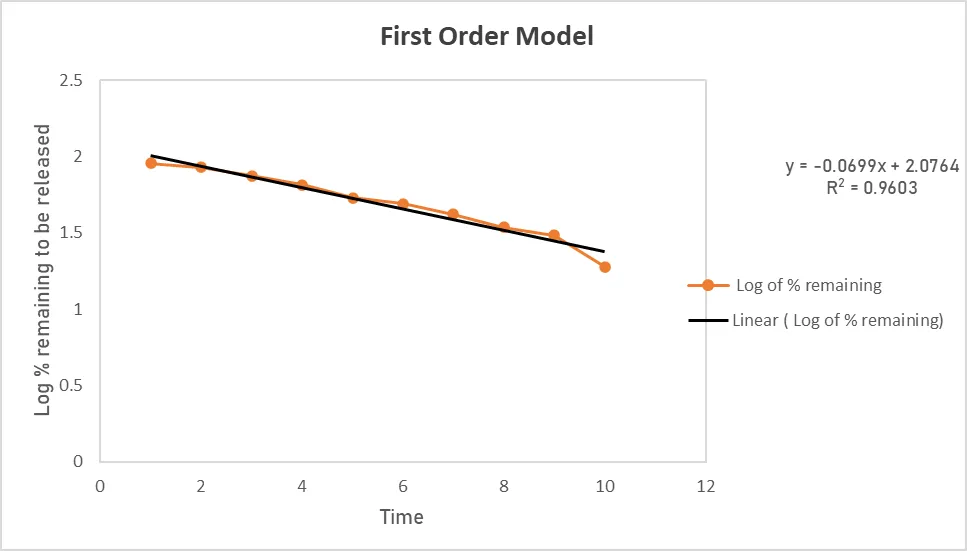
Fig. No. 14 First-Order Kinetics
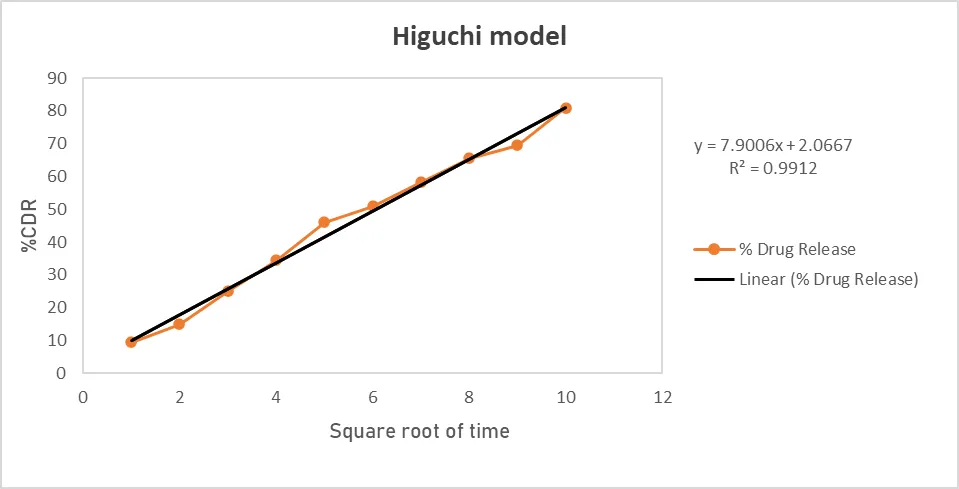
Fig. No. 15 Higuchi model
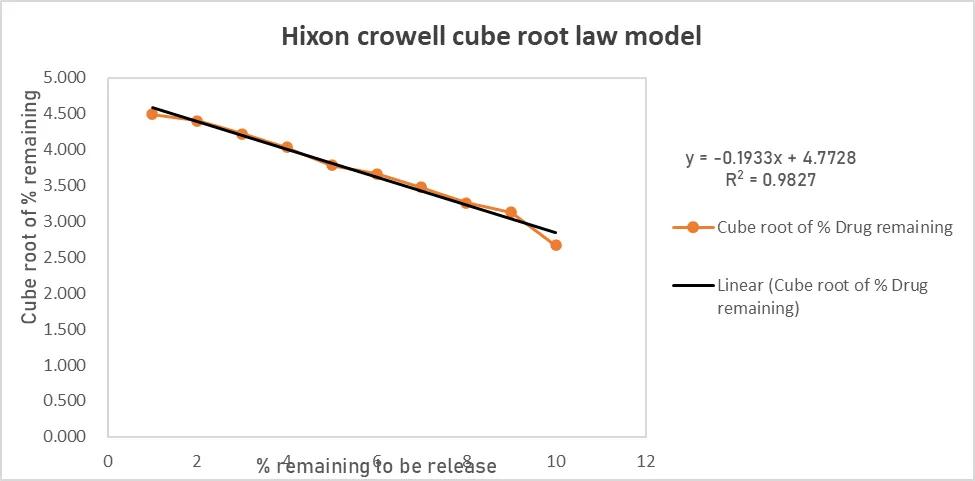
Fig no.16:Hixcon crowell model
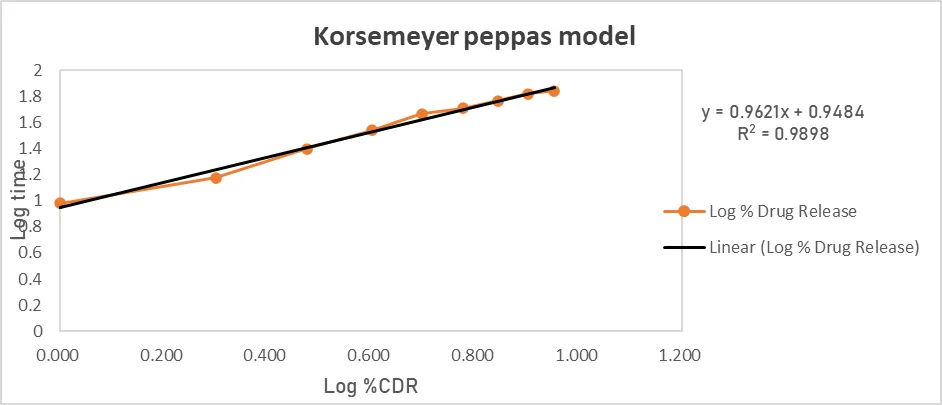
Fig no .17:Korsemeyer peppas model
Table 8.21:Release kinetic Models
|
Zero order model |
First order model |
Higuchi model
|
Hixcon crowell cube root Model |
Korsemeyer peppas model |
|
0.9912 |
0.9603 |
0.9912 |
0.9817 |
0.9898 |
The in vitro drug release study of the hydrocortisone-loaded microemulsion-based hydrogel formulations was carried out to evaluate the release pattern of the drug from different formulations (F1–F9). The study results demonstrated gradual and controlled release of hydrocortisone over a period of 10 hours. Among all formulations, formulation F8 exhibited the highest cumulative drug release of 81% at the end of 10 hours, indicating better drug diffusion and release characteristics compared to other formulations. The enhanced drug release observed in formulation F8 may be attributed to the optimized concentration of oil phase and Smix, which improved drug solubilization and diffusion through the dialysis membrane. Formulations containing lower concentrations of surfactant mixture showed comparatively slower release profiles due to reduced drug diffusion and lower permeability. Overall, all formulations showed sustained release behavior, which is desirable for topical drug delivery systems as it helps maintain prolonged therapeutic activity at the site of application.
The drug release data were further analyzed using different kinetic models such as Zero-order, First-order, Higuchi, Hixson–Crowell, and Korsmeyer–Peppas models to understand the mechanism of drug release from the hydrogel system. The release pattern indicated that the formulation followed controlled and diffusion-mediated drug release behavior. The Higuchi and Korsmeyer–Peppas models suggested that drug release occurred mainly through diffusion of hydrocortisone from the polymeric hydrogel matrix. These findings confirmed that the developed microemulsion-based hydrogel system is capable of providing sustained and effective topical delivery of hydrocortisone for anti-inflammatory therapy.
of the drug with formulation excipients. The results indicated that hydrocortisone was compatible with the
4.CONCLUSION
The present study successfully developed a hydrocortisone-loaded microemulsion-based hydrogel for topical anti-inflammatory therapy. The optimized formulation showed satisfactory physicochemical properties, nanosized droplets, good spreadability, controlled drug release, stability, and significant anti-inflammatory activity. The optimized system improved drug solubility and skin permeation while providing sustained drug release and prolonged contact at the application site. Therefore, the developed microemulsion-based hydrogel can be considered a promising topical drug delivery system for the management of inflammatory skin disorders.
REFERENCES

Sakshi Shewale, Priyanka Thorat, Formulation And Evaluation Of Micro-Emulsion Based Hydrogel Of Hydrocortisone For Anti-Inflammatory Acticity, Int. J. of Pharm. Sci., 2026, Vol 4, Issue 10, 1472-1499. https://doi.org/10.5281/zenodo.23312966
 10.5281/zenodo.23312966