

We use cookies to ensure our website works properly and to personalise your experience. Cookies policy
Department of Pharmaceutics, Spurthy College of Pharmacy, Rajiv Gandhi University of Health Sciences, Bengaluru, India – 560002.
Acne vulgaris is a prevalent inflammatory skin condition that commonly affects adolescents and young adults. The limitations associated with conventional topical preparations have encouraged the exploration of natural bioactive compounds and advanced drug delivery systems for topical application. The present study focused on the development of a polyherbal niosomal gel containing Curcumin and Tea Tree Oil enriched with Aloe vera as a potential topical approach for acne management. Preformulation investigations were performed for Curcumin and Tea Tree Oil to establish their physicochemical characteristics and suitability for formulation development. Niosomal formulations were prepared and subjected to evaluation for appearance, homogeneity, pH, particle size, zeta potential, entrapment efficiency, and drug content. Based on the obtained evaluation parameters, F3 was selected as the optimized niosomal formulation. The optimized niosomal dispersion was subsequently incorporated into a Carbopol 934 gel base enriched with Aloe vera. The resulting gel formulations were assessed for appearance, homogeneity, pH, viscosity, spreadability, extrudability, and drug content. Among the prepared formulations, G3 was identified as the optimized niosomal gel. F3 exhibited a particle size of 286.0 nm with a PDI of 0.287, while G3 demonstrated suitable physicochemical characteristics for topical application. Overall, the study indicates that the developed Curcumin and Tea Tree Oil-loaded niosomal gel enriched with Aloe vera has potential as a polyherbal topical formulation for the management of acne.
1.1 Acne Vulgaris
Acne vulgaris is a common chronic inflammatory disorder of the pilosebaceous unit that predominantly affects adolescents and young adults. It is mainly observed on the face, chest, shoulders, and back, where sebaceous glands are abundant. The development of acne is associated with multiple factors that act together during disease progression.1
The major factors involved in acne development include:
Depending on its severity, acne may present as comedones, papules, pustules, nodules, or cystic lesions. Persistent or severe acne may result in post-inflammatory pigmentation, permanent scarring, and psychological distress.2
1.2 Limitations of Conventional Acne Therapy
Topical therapy is an important approach for acne management because the formulation can be applied directly to the affected skin. Common topical agents include retinoids, benzoyl peroxide, antibiotics, salicylic acid, and azelaic acid.3
Despite their therapeutic usefulness, conventional topical treatments may have certain limitations:3
These limitations have encouraged the investigation of naturally derived bioactive compounds and advanced topical delivery systems for acne management.4
1.3 Curcumin
Curcumin is a naturally occurring polyphenolic compound obtained from Curcuma longa. It possesses several biological activities, including anti-inflammatory, antioxidant, and antimicrobial properties, which make it a promising candidate for dermatological applications.5
The potential relevance of curcumin in acne management is associated with:
However, the topical application of curcumin is challenged by its poor aqueous solubility and limited delivery through conventional formulations. Therefore, an appropriate drug delivery system may be beneficial for improving its incorporation and topical application.6
1.4 Tea Tree Oil
Tea Tree Oil is a natural essential oil obtained from Melaleuca alternifolia and is widely investigated for its dermatological applications. It possesses antimicrobial and anti-inflammatory properties that make it a promising natural ingredient for topical acne preparations.7
Its potential usefulness in acne therapy can be attributed to:
However, the development of a suitable formulation is important to ensure uniform distribution, convenient application, and acceptable physicochemical properties of Tea Tree Oil. 8
1.5 Aloe Vera
Aloe vera is a commonly used botanical ingredient in topical and dermatological preparations. It is associated with soothing, moisturizing, skin-conditioning, and anti-inflammatory properties. 9
In the present formulation, Aloe vera serves as a supportive botanical component of the gel base. Its incorporation may contribute to:
Thus, Aloe vera provides an additional botanical component to the proposed polyherbal topical system.9
1.6 Niosomal Drug Delivery System
Niosomes are vesicular drug delivery systems formed primarily using non-ionic surfactants along with suitable stabilizing components. Their vesicular structure provides an opportunity to incorporate different types of active pharmaceutical ingredients and natural bioactive compounds.10
Niosomes are considered useful for topical delivery because they may:
These characteristics make niosomes a promising carrier system for the topical delivery of natural compounds such as curcumin and Tea Tree Oil.
1.7 Niosomal Gel
Although niosomes can provide advantages as a vesicular delivery system, incorporation of the optimized niosomal dispersion into a gel base can improve its practical application as a topical dosage form.12
A niosomal gel can provide:
In the present study, the optimized Curcumin and Tea Tree Oil-loaded niosomal dispersion was incorporated into a Carbopol 934 gel base enriched with Aloe vera to obtain a suitable topical formulation.
1.8 Rationale of the Study
Curcumin, Tea Tree Oil, and Aloe vera possess different but complementary properties that may be beneficial for topical acne management. However, the formulation of natural bioactive compounds can be challenging because of limitations such as poor solubility, stability, and effective topical delivery. 13
The proposed formulation combines these components through a single delivery approach:
Curcumin + Tea Tree Oil
↓
Niosomal encapsulation
↓
Optimized niosomal dispersion
↓
Incorporation into Carbopol 934 gel
↓
Enrichment with Aloe vera
↓
Curcumin and Tea Tree Oil-loaded Aloe vera niosomal gel
This approach is intended to combine the biological properties of the selected natural ingredients with the potential delivery advantages of a niosomal system and the practical benefits of a topical gel. 14
1.9 Aim of the Study
The present study was undertaken to develop and characterize a Curcumin and Tea Tree Oil-loaded niosomal gel enriched with Aloe vera as a potential topical formulation for acne management. The prepared niosomal formulations were evaluated for their physicochemical characteristics, and the optimized formulation was subsequently incorporated into a Carbopol 934 gel base enriched with Aloe vera and evaluated for its suitability as a topical niosomal gel.
1.10 Methods of Preparation of Niosomes
Niosomes can be prepared using several techniques depending on the nature of the drug, desired vesicle size, and intended application. The choice of preparation method influences the vesicle morphology, particle size, entrapment efficiency, and stability of the formulation.15 The commonly used methods for the preparation of niosomes are:
Ether Injection Method
Principle
The Ether Injection Method is a simple technique used for the preparation of niosomes based on the rapid evaporation of an organic solvent. In this method, non-ionic surfactants and stearic acid dissolved in diethyl ether are slowly injected into a warm aqueous phase containing the drug. As the ether comes into contact with the heated aqueous medium, it evaporates immediately due to its low boiling point, leading to the self-assembly of surfactant molecules into bilayer vesicles and the formation of niosomes. This method is generally employed to prepare unilamellar vesicles with relatively uniform particle size.17
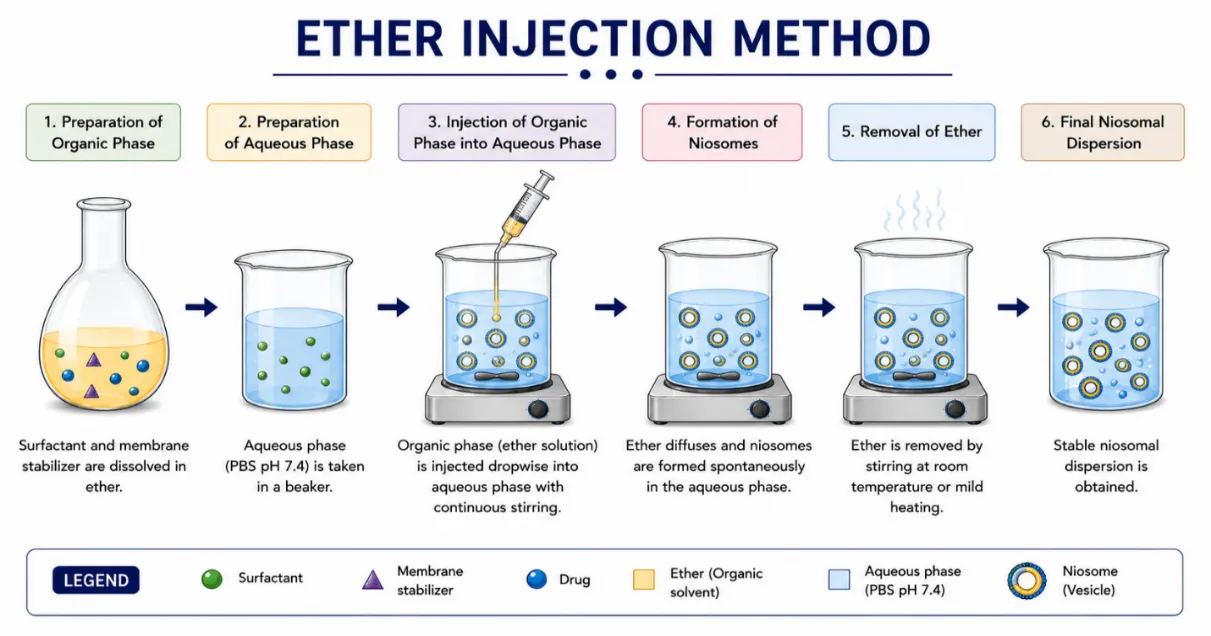
Fig 3: Ether Injection Method
2. MATERIALS AND METHODS
The chemicals that were used are AR/LR grade or the best possible grade available were used as supplied by manufacturer without further purification or investigation.
Chemical’s List
Table 1. List of Chemicals
|
SI.NO |
MATERIAL |
SOURCE |
|
1. |
Curcumin |
Otto Chemie Pvt. Ltd |
|
2. |
Aloe Vera |
Fresh Aloe vera leaves – Local source |
|
3. |
Tea tree oil |
Raasa Oils,102, Gayatri Vatika, Noida |
|
4. |
Span 20 |
Molychem, Mumbai. |
|
5. |
Stearic acid |
COBA Chemi Pvt. Ltd |
|
6. |
Phosphate Buffer (pH:7.4) |
Prepared in laboratory using Analytical Grade chemicals |
|
7. |
Diethyl Ether |
SDFCL – SD Fine Chemi Ltd, Mumbai |
|
8. |
TEA |
Thomas Baker Pvt. Ltd, Maharashtra. |
|
9. |
Methyl Paraben |
Thomas Baker Pvt. Ltd, Maharashtra. |
|
10. |
Carbopol 934 |
Molychem, Mumbai. |
|
11. |
Propylene Glycol |
Thomas Baker Pvt. Ltd, Maharashtra. |
|
12. |
Glycerin |
Thomas Baker Pvt. Ltd, Maharashtra. |
|
13. |
Distilled Water |
Spurthy college of Pharmacy |
Equipment’s List
Table 2: List of Equipments
|
S.No |
Equipment |
Model/ Company |
|
1. |
Electronic balance |
Systronics, Gujarat |
|
2. |
UV spectrophotometer |
Jasco Int.co.Ltd, Japan |
|
3. |
Centrifuge |
Jasco Int.co.Ltd, Japan |
|
4. |
Magnetic stirrer |
REMI Electrotecnics Ltd, Mumbai, India |
|
5. |
Digital pH meter |
Aczet Pvt, Ltd |
|
6. |
Viscometer |
Brookfield DV-II + Pro |
|
7. |
Zeta potential analyzer |
zetaatrac |
|
8. |
Melting point apparatus |
S A Instruments & Systems, Thane, Maharashtra |
|
9. |
Hot air oven |
Balaji Machinery, Faridabad, Haryana |
|
10. |
Laboratory Stirrer |
REMI Electrotecnics Ltd, Mumbai, India |
|
11. |
Desicator |
Glassco Laboratory Equipments Pvt. Ltd., Ambala, Haryana |
|
12. |
Water Bath |
REMI Electrotecnics Ltd, Mumbai, India |
2.1 PRE-FORMULATION STUDIES OF CURCUMIN
Pre-formulation studies are the investigations carried out on an active pharmaceutical ingredient (API) before formulation development to determine its physical, chemical, physicochemical, and mechanical properties. These studies help in selecting suitable excipients, manufacturing methods, dosage forms, packaging materials, and storage conditions to ensure the development of a safe, effective, and stable pharmaceutical product.
The objective of pre-formulation studies is to evaluate the physical and chemical properties of a drug before formulation. These studies help in selecting suitable excipients, developing a stable dosage form, and ensuring the quality, safety, and efficacy of the final product.
A. Curcumin
1.Authentication of curcumin
Curcumin was authenticated using the Certificate of Analysis (COA) provided by Otto Chemie Pvt. Ltd. The supplied curcumin was identified as Curcumine, 99%, with CAS No. 458-37-7 and molecular weight 368.38 g/mol. The certificate reported an assay of 99.05%, with the sample appearing as an orange solid. The reported melting point was 183–188°C, which complied with the specified standard. The product was supplied under Batch No. 0048 and the certificate stated that the product complied with the prescribed quality standards.
2. Organoleptic Evaluation
Curcumin was examined visually for its colour, appearance, and odour. A small quantity of the sample was placed in a clean, dry glass Petri dish and observed under suitable lighting. The odour was assessed carefully by gently wafting the sample towards the nose without direct inhalation.
3. Solubility Study of Curcumin
The solubility of curcumin was determined qualitatively in different solvents. A known amount of curcumin, such as 10 mg, was transferred separately into test tubes containing 1 mL of different solvents, such as distilled water, chloroform, Di-ethyl ether and phosphate buffer pH 7.4. The samples were shaken thoroughly and observed for dissolution. If necessary, the mixtures were allowed to stand and then examined for undissolved particles.
4. Melting Point Determination
The melting point of curcumin was determined using the capillary tube method. A small quantity of finely powdered curcumin was packed into a clean, dry capillary tube. The capillary was attached to a thermometer and placed in a melting point apparatus containing a suitable heating medium. The sample was heated gradually, and the temperature at which the powder began to melt and the temperature at which it completely melted were recorded.
5. Moisture Content (Loss on Drying)
The moisture content of curcumin was determined by the loss-on-drying method. A clean, dry Petri dish was accurately weighed, and the weight was recorded as W₁. Approximately 1 g of curcumin was accurately transferred into the Petri dish, and the combined weight was recorded as W₂. The Petri dish containing the sample was placed in a hot-air oven and dried under the specified conditions until a constant weight was obtained. The dish was then removed from the oven, cooled to room temperature in a desiccator, and weighed accurately. The final weight was recorded as W₃.
The percentage moisture content was calculated using the following equation:
% Moisture content =W2-W3 W2-W1

Where:
W₁ = Weight of empty, dry Petri dish
W₂ = Weight of Petri dish + curcumin before drying
W₃ = Weight of Petri dish + curcumin after drying
6. UV Spectrophotometric Analysis
The maximum absorption wavelength (λmax) of curcumin was determined using a UV–Visible spectrophotometer. An accurately weighed quantity of curcumin was dissolved in a suitable solvent based on its solubility, and a stock solution of known concentration was prepared. The stock solution was suitably diluted to obtain an appropriate working concentration for spectrophotometric analysis.
The prepared solution was transferred to a quartz cuvette, and the corresponding solvent was used as the blank. The solution was scanned over a wavelength range of 200–600 nm using a UV–Visible spectrophotometer. The wavelength at which curcumin exhibited maximum absorbance was recorded as its λmax.
The experimentally obtained λmax was compared with the reported value and was subsequently used for the quantitative estimation of curcumin in the developed niosomal formulation.
7. Ash value
A known quantity of curcumin sample (approximately 2 g) was accurately weighed and transferred into a previously ignited, cooled and weighed silica crucible. The sample was initially heated gently to remove moisture and volatile matter. It was then incinerated in a muffle furnace at about 600°C until a constant weight of ash was obtained. The crucible was allowed to cool in a desiccator and weighed.
The percentage of total ash was calculated using the following formula:
Total Ash(%)=Weight of AshWeight of Sample×100

8. Extractive Value Determination of Curcumin
A known quantity (5 g) of curcumin sample was accurately weighed and macerated with 100 mL of the selected solvent in a closed flask for 24 hours, with frequent shaking during the first 6 hours. The mixture was then filtered. A measured quantity of the filtrate was transferred to a previously weighed evaporating dish and evaporated to dryness. The residue was dried to constant weight and weighed.
The percentage of extractive value was calculated as:
Extractive Value (%)=Weight of sample×Volume of filtrateWeight of dried extract ×Volume of solvent ×100

9. Preliminary Phytochemical Screening of Curcumin
Preliminary phytochemical screening of the curcumin sample was carried out to detect the presence of different classes of phytoconstituents. The following qualitative tests were performed:
a. Test for Phenolic Compounds (Ferric chloride test):
A small quantity of Curcumin was dissolved in a suitable solvent and a few drops of ferric chloride solution were added. The development of a brown colour indicated the presence of phenolic compounds.
b. Test for Flavonoids (Shinoda test):
Curcumin was dissolved in a suitable solvent, followed by the addition of a small amount of magnesium turnings and concentrated hydrochloric acid. The development of pink, red, or orange colour indicated the presence of flavonoids.
c. Test for Tannins (Gelatin test):
A solution of Curcumin was treated with 1% gelatin solution containing sodium chloride. Observation of white precipitate indicated the presence of tannins.
d. Test for Alkaloids (Dragendorff's test):
Curcumin was suitably dissolved and treated with Dragendorff's reagent. Development of orange or reddish-brown precipitate indicated the presence of alkaloids.
e. Test for Saponins (Foam test):
Curcumin was mixed with distilled water and shaken vigorously for several minutes. Observation of persistent froth indicated the presence of saponins.
f. Test for Terpenoids (Salkowski test):
Curcumin was dissolved in chloroform, and concentrated sulfuric acid was carefully added along the side of the test tube. Characteristic reddish-brown colour at the interface indicated the presence of terpenoids.
B. Tea Tree Oil
1. Authentication report of Tea Tree Oil
Tea Tree Oil used in the formulation was procured from Raasa Oils and authenticated based on the supplier-provided Certificate of Analysis (CoA). The CoA identified the material as Melaleuca alternifolia essential oil and reported its physical appearance, colour, odour, solubility, specific gravity, refractive index, optical rotation and flash point, with the tested parameters reported as complying with the specified ranges.
2. Organoleptic Evaluation
Tea Tree Oil was examined visually for its colour, appearance, and odour. A small quantity of the sample was placed in a clean, dry glass Petri dish and observed under suitable lighting. The odour was assessed carefully by gently wafting the sample towards the nose without direct inhalation.
3. Solubility Study
The solubility of Tea Tree Oil was determined qualitatively in selective solvents. Approximately 0.1 mL of tea tree oil was added separately to 1 mL of distilled water, phosphate buffer pH 7.4, and diethyl ether. Each mixture was shaken thoroughly and observed for complete mixing, dispersion, or phase separation.
4. Specific Gravity
The specific gravity of tea tree oil was determined using a calibrated specific gravity bottle (pycnometer). The clean, dry, and empty bottle was accurately weighed, and the weight was recorded as W₁. The bottle was then filled completely with distilled water, ensuring the absence of air bubbles, and fitted with its stopper. The external surface of the bottle was dried carefully, and the bottle was weighed accurately. The weight was recorded as W₂.
The bottle was subsequently emptied, cleaned, and dried thoroughly. It was then filled completely with tea tree oil under the same experimental conditions and fitted with the stopper. The outside of the bottle was wiped dry, and the bottle containing tea tree oil was accurately weighed. The weight was recorded as W₃.
The specific gravity of tea tree oil was calculated using the following equation:
Specific Gravity=W3-W1W2-W1

Where:
W₁ = Weight of the empty specific gravity bottle
W₂ = Weight of the bottle filled with distilled water
W₃ = Weight of the bottle filled with tea tree oil
5. UV-Spectrometric Analysis
Tea Tree Oil was diluted with ethanol to prepare a suitable sample solution. The UV–Visible spectrophotometer was calibrated using ethanol as the blank. The prepared Tea Tree Oil solution was transferred into a quartz cuvette and scanned over the wavelength range of 200–400 nm. The absorbance spectrum was recorded, and the wavelength corresponding to maximum absorbance (λmax) was determined from the obtained spectrum.
6. Partition Coefficient Determination of Tea Tree Oil
The apparent partition coefficient of tea tree oil was determined by the shake-flask method using a gravimetric approach, with ethyl acetate as the organic phase and phosphate buffer pH 7.4 as the aqueous phase. About 1 mL of tea tree oil was accurately measured and transferred into a separating funnel containing 10 mL of ethyl acetate and 10 mL of phosphate buffer pH 7.4. The mixture was shaken gently for 10–15 minutes and allowed to stand until complete separation of the two phases. The upper ethyl acetate layer and lower aqueous layer were separated carefully.
A clean, dry evaporating dish was accurately weighed and recorded as W₁. The separated ethyl acetate phase was transferred into the dish and the solvent was allowed to evaporate completely. After cooling in a desiccator, the dish was weighed and recorded as W₂. The amount of tea tree oil recovered in the organic phase was calculated as W2-W1

The aqueous phase was extracted with fresh ethyl acetate in three successive portions. The combined extracts were transferred to another pre-weighed evaporating dish, and the solvent was evaporated completely. The dish was cooled and weighed as W₄, while the empty dish weight was recorded as W₃. The amount of tea tree oil recovered from the aqueous phase was calculated as W4-W3

Calculate the partition coefficient using:
P=CaCo

Where:
7. Preliminary phytochemical screening
Preliminary phytochemical screening of the Tea Tree Oil sample was carried out to detect the presence of different classes of phytoconstituents. The following qualitative tests were performed:
a. Test for Terpenoids (Salkowski test):
Tea Tree Oil was mixed with chloroform and concentrated sulfuric acid was carefully added along the side of the test tube. The formation of a reddish-brown colour at the interface indicated the presence of terpenoids.
b. Test for Steroids (Liebermann–Burchard test):
Tea Tree Oil was dissolved in chloroform, followed by the addition of acetic anhydride. Concentrated sulfuric acid was then added carefully along the side of the test tube. The development of a green or bluish-green colour indicated the presence of steroids.
c. Test for Phenolic Compounds (Ferric chloride test):
A small quantity of Tea Tree Oil was diluted with a suitable solvent and a few drops of ferric chloride solution were added. The development of a blue, green, or violet colour indicated the presence of phenolic compounds.
d. Test for Flavonoids (Shinoda test):
Tea Tree Oil was diluted with a suitable solvent, followed by the addition of a small amount of magnesium turnings and concentrated hydrochloric acid. The development of a pink, red, or orange colour indicated the presence of flavonoids.
e. Test for Tannins (Ferric chloride test):
A diluted Tea Tree Oil sample was treated with a few drops of ferric chloride solution. The development of a blue-black or green colour indicated the presence of tannins.
f. Test for Saponins (Foam test):
Tea Tree Oil was mixed with distilled water and shaken vigorously for several minutes. The formation of persistent froth indicated the presence of saponins.
h. Test for Alkaloids (Dragendorff's test):
Tea Tree Oil was suitably diluted and treated with Dragendorff's reagent. The formation of an orange or reddish-brown precipitate indicated the presence of alkaloids.
2.2 Preparation of Curcumin, Tea Tree Oil - Loaded Niosome [CTT-N]
Formulation Code for Curcumin, Tea Tree Oil loaded Niosome
Table 3: Formulation Chart for Curcumin, Tea Tree Oil loaded Niosome
|
INGREDIENTS |
F1 |
F2 |
F3 |
F4 |
|
Curcumin |
0.025 g |
0.025 g |
0.025 g |
0.025 g |
|
Tea Tree Oil |
0.5 mL |
0.5 mL |
0.5 mL |
0.5 mL |
|
Span 20 |
0.1 g |
0.15 g |
0.2 g |
0.25 g |
|
Stearic Acid |
0.05 g |
0.075 g |
0.1 g |
0.125 g |
|
Phosphate Buffer pH: 7.4 |
10 mL |
10 mL |
10 mL |
10 mL |
|
Diethyl Ether |
10 mL |
10 mL |
10 mL |
10 mL |
1. Preparation of phosphate Buffer pH: 7.4
Sodium dihydrogen phosphate - 0.31 g
↓
Dissolve in a suitable quantity of distilled water
↓
Add Disodium hydrogen phosphate - 1.09 g
↓
Mix thoroughly until completely dissolved
↓
Make up the volume to 100 mL with distilled water
↓
Calibrate the pH meter
↓
Measure the pH of the prepared buffer
↓
Adjust to pH 7.4 if required
(NaOH to increase pH, HCl to decrease pH)
↓
Phosphate Buffer pH 7.4
2. Preparation of Turmeric – Tea Tree Oil loaded Niosome
Materials:
Procedure:
Preparation of CTT-N for F3 by Ether injection Method
1. Preparation of organic phase
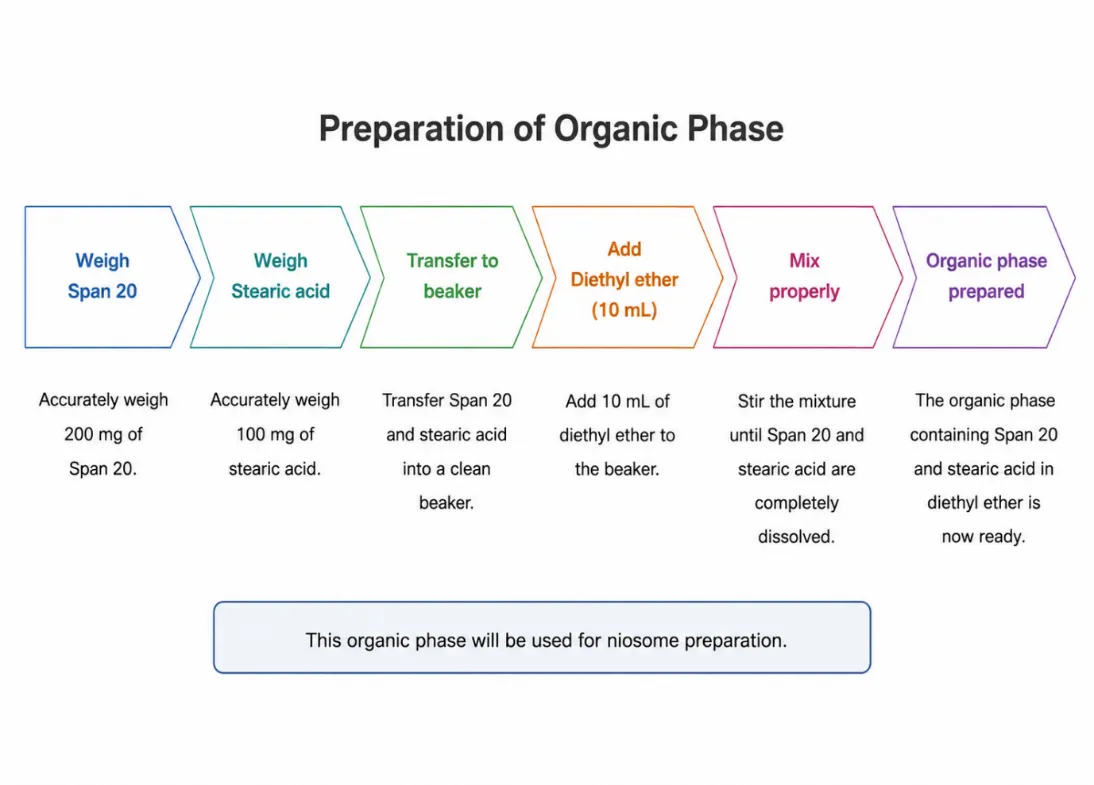
Fig 4: Preparation of Organic Phase
Span 20 (0.2 g) + Stearic acid (0.1 g)
↓
Accurately weigh and transfer into a clean container
↓
Add Diethyl ether (10 mL)
↓
Mix continuously until a uniform solution is obtained
↓
Add Curcumin (0.025 g)
↓
Add Tea tree oil (0.5 mL)
↓
Mix thoroughly for uniform distribution
↓
Organic phase obtained
↓
Ready for Ether Injection Method
2. Preparation of Aqueous Phase
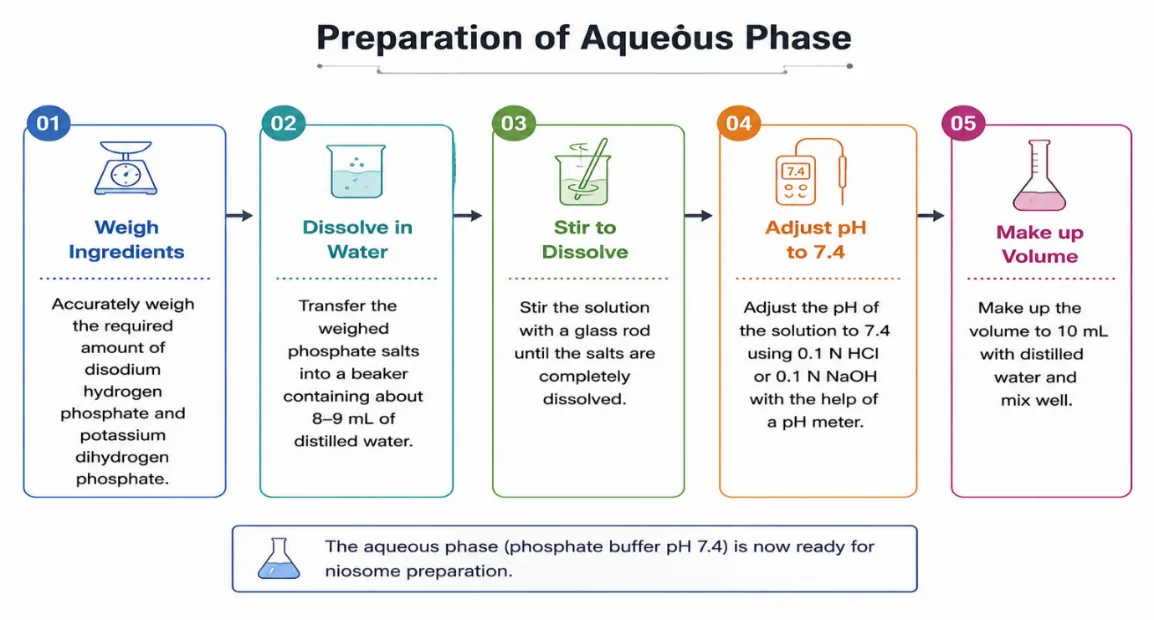
Fig 5: Preparation of aqueous Phase
Phosphate buffer pH 7.4 (10 mL)
↓
Transfer into a suitable vessel
↓
Heat the buffer to 55–65°C
↓
Maintain at 55–65°C with continuous stirring
↓
Slowly add the prepared organic phase
↓
Diethyl ether evaporates rapidly due to elevated temperature
↓
Continuous stirring promotes vesicle formation
↓
Curcumin–Tea Tree Oil-loaded niosomal dispersion obtained
3. Ether Injection
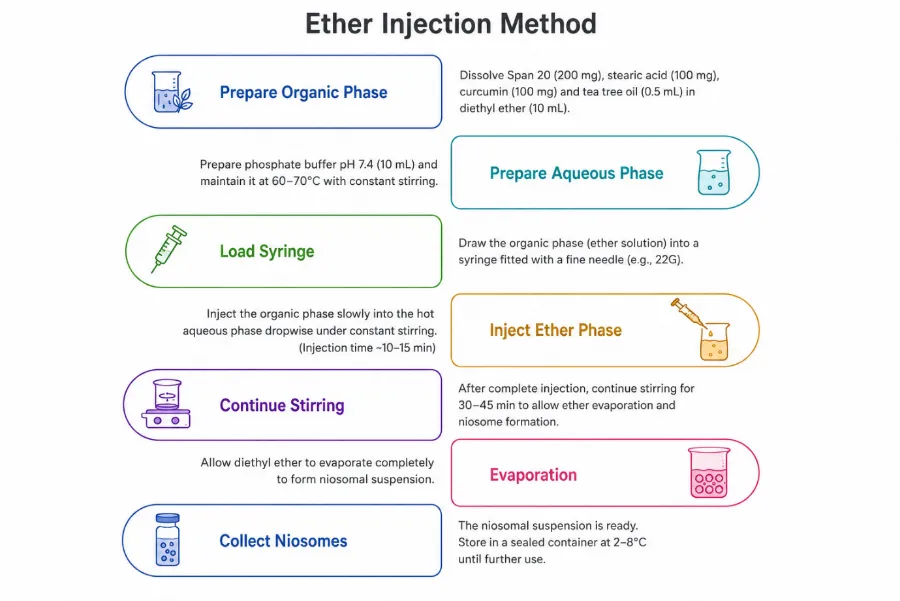
Fig 6: Ether Injection Method
Prepared organic phase
(Span 20 + Stearic acid + Curcumin + Tea tree oil + Diethyl ether)
↓
Transfer the organic phase into a suitable syringe
↓
Heat phosphate buffer pH 7.4 to 55–65°C
↓
Slowly inject the organic phase through a syringe and needle
↓
Maintain continuous stirring during injection
↓
Ensure gradual and uniform dispersion of the organic phase
↓
Rapid evaporation of diethyl ether due to elevated temperature
↓
Continued stirring promotes vesicle formation
↓
Curcumin–Tea Tree Oil-loaded niosomal vesicles obtained
4. Formation of Curcumin–Tea Tree Oil-Loaded Niosomes
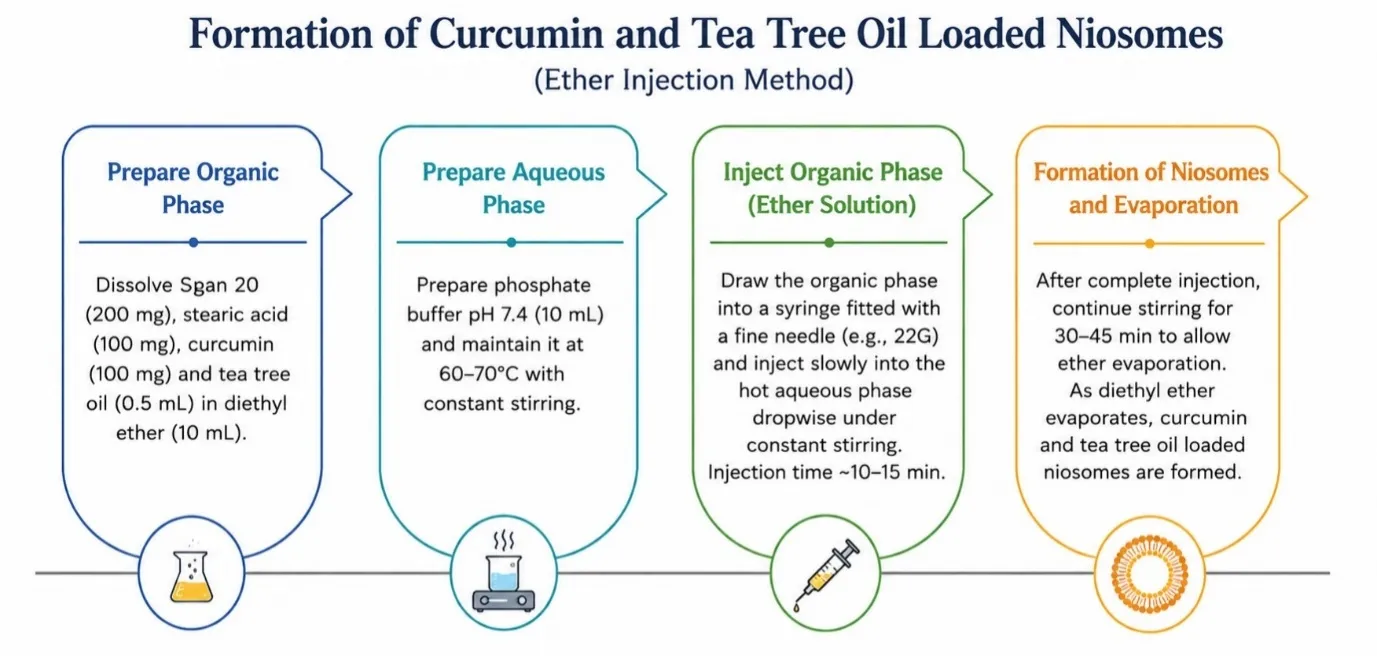
Fig 7: Formation of CTT-N
Diethyl ether evaporates rapidly during injection
↓
Span 20 and stearic acid arrange at the interface
↓
Formation of vesicular structures
↓
Curcumin–Tea Tree Oil-loaded niosomes formed
↓
Continue stirring for 30–45 minutes
↓
Removal of residual diethyl ether and completion of vesicle formation
↓
Cool the niosomal dispersion to room temperature
↓
Collect the prepared niosomal dispersion
↓
Store appropriately for further evaluation
2.3 Evaluation of niosome
1. Appearance
The prepared niosomal formulation was visually examined for its colour, odour, texture, clarity, and physical appearance. The formulation was also checked for the presence of any lumps, aggregates, precipitation, or phase separation. A uniform appearance indicates proper distribution of the formulation components.
2. Homogeneity
The homogeneity of the prepared formulation was evaluated by taking a small quantity of the formulation and examining it visually and by gently spreading it on a glass slide. The formulation was checked for uniform distribution of ingredients, absence of lumps, aggregates, and foreign particles. A homogeneous formulation indicates good uniformity and consistency.
3. pH
The pH of the prepared formulation was determined using a previously calibrated digital pH meter. A suitable quantity of the formulation was placed in a clean beaker, and the electrode was immersed into the sample. The pH was recorded after obtaining a stable reading. The pH was maintained within a range suitable for topical application and skin compatibility.
4. Particle Size
The particle size of the prepared niosomes was determined to evaluate the size and uniformity of the vesicles. The niosomal dispersion was suitably diluted and analyzed using dynamic light scattering (DLS). The average particle size and particle-size distribution were recorded. Smaller and relatively uniform vesicles may provide better distribution and interaction with the skin.
5. Zeta Potential
The zeta potential of the prepared niosomes was determined using a zeta potential analyzer. The sample was suitably diluted and introduced into the instrument for measurement. Zeta potential indicates the surface charge of the vesicles and provides information regarding the physical stability of the niosomal dispersion. A higher absolute zeta-potential value generally indicates better electrostatic repulsion between vesicles and reduced aggregation.
6. Drug Entrapment Efficiency
The entrapment efficiency was determined to evaluate the percentage of curcumin successfully incorporated into the niosomal vesicles. A known quantity of niosomal dispersion was centrifuged to separate the niosomal vesicles from the free or unentrapped drug. The supernatant containing the free drug was separated carefully, and the amount of free curcumin was quantified using a suitable analytical method.
The percentage entrapment efficiency was calculated using:
Entrapment Efficacy=Total Drug-Free (unentrapped drug)Total Drug×100

7. Drug Content
Drug content analysis was performed to determine the amount of curcumin present in the prepared niosomal formulation. A known quantity of formulation was accurately weighed and treated with a suitable solvent to extract the drug. The extract was filtered and analyzed using an appropriate quantitative analytical technique. The obtained drug concentration was compared with the theoretical drug concentration, and the percentage drug content was calculated.
Drug Content (%)=Actual amount of drug presentTheorital amount of drug×100

2.4 Preparation of niosomal gel
Materials:
Formulation Code for log batch of Niosomal Gel
Table 4: Formulation Chart for Curcumin, Tea Tree Oil loaded Niosomal gel
|
FORMULATION CODE |
G1 |
G2 |
G3 |
|
Niosomal Suspension |
2 mL of CTT-N |
2 mL of CTT-N |
2 mL of CTT-N |
|
Carbopol 934 |
0.5 g |
0.75 g |
1 g |
|
Triethanol Amine |
q.s |
q.s |
q.s |
|
Glycerin |
2 mL |
2 mL |
2 mL |
|
Aloe vera gel |
5 g |
5 g |
5 g |
|
Propylene Glycol |
2 mL |
2 mL |
2 mL |
|
Methyl Paraben |
0.01 g |
0.01 g |
0.01 g |
|
Distilled Water |
q.s |
q.s |
q.s |
1. Hydrate Carbopol for Gel Base
Carbopol 934 – 1 g
↓
Accurately weigh Carbopol 934
↓
Slowly disperse in the required quantity of distilled water
↓
Continuous gentle stirring
↓
Allow to stand for 12–24 hours at room temperature
↓
Complete hydration and swelling of Carbopol particles
↓
Smooth and uniform Carbopol dispersion is obtained
↓
Gel Base
2. Addition of Formulation Ingredients
Hydrated Carbopol 934 gel base
↓
Add Aloe vera gel extract – 5 g
↓
Mix gently until uniformly distributed
↓
Add Propylene glycol – 2 mL
↓
Add Glycerin – 2 mL
↓
Add Methyl paraben – 0.01 g
(dissolved in a small quantity of propylene glycol before addition)
↓
Mix thoroughly to obtain a uniform gel base
↓
Add Triethanolamine (TEA) dropwise
↓
Adjust pH to approximately 5.5–6.0
↓
Smooth and uniform aloe vera gel base obtained
3. Incorporation of Niosomal Dispersion
Prepared curcumin–tea tree oil-loaded niosomal dispersion
↓
Slowly add the niosomal dispersion to the hydrated Carbopol gel base
↓
Add gradually with gentle and continuous stirring
↓
Ensure uniform distribution of niosomes throughout the gel base
↓
Avoid vigorous stirring to minimize vesicle aggregation or damage
↓
Continue gentle stirring until uniformly mixed
↓
Smooth and homogeneous niosomal gel obtained
2.5 Evaluation of niosomal gel
1. Appearance
The prepared niosomal gel was visually examined for colour, odour, texture, clarity, and consistency. The formulation was also checked for the presence of lumps, aggregates, air bubbles, precipitation, or phase separation. A smooth and uniform appearance indicates good physical characteristics of the formulation.
2. Homogeneity
The homogeneity of the prepared gel was evaluated by placing a small quantity of formulation on a clean glass slide and examining it visually. The gel was checked for uniform distribution of ingredients, absence of lumps, aggregates, and foreign particles. The formulation should show a smooth and uniform texture without any visible separation.
3. pH
The pH of the prepared niosomal gel was determined using a calibrated digital pH meter. A suitable quantity of gel was dispersed in distilled water and the electrode was immersed into the sample. The pH was recorded after obtaining a stable reading.
The pH of a topical formulation should preferably be maintained around 5.5–6.5 for better skin compatibility.
4. Viscosity
The viscosity of the prepared niosomal gel was determined using a Brookfield viscometer. An appropriate spindle, such as L4, was selected according to the consistency of the formulation. The viscosity was measured at a predetermined rotational speed and at room temperature. The reading was recorded in centipoise (cP).
5. Spreadability
Spreadability was determined to evaluate the ease with which the niosomal gel spreads over the skin. A known quantity of gel was placed between two clean glass slides. A specified weight was placed on the upper slide, and the time required for the gel to spread over a specified distance was recorded.
The spreadability can be calculated using:
S=M×LT

Where:
S = Spreadability (g·cm/sec)
M = Weight applied to the upper slide (g)
L = Length travelled by the gel (cm)
T = Time taken (sec)
6. Extrudability
Extrudability was evaluated to determine the ease with which the niosomal gel can be removed from a collapsible tube. A known quantity of gel was filled into the tube and the tube was properly closed. A specified weight was applied to the tube, and the amount of gel extruded through the nozzle was measured.
Extrudability can be expressed as:
E=WL

Where:
E = Extrudability (g/cm)
W = Weight of gel extruded (g)
L = Length of gel extruded (cm)
7. Drug Content
Drug content was determined to evaluate the amount of curcumin present in the prepared niosomal gel. A known quantity of gel was accurately weighed and treated with a suitable solvent to extract the curcumin. The mixture was properly mixed and filtered to remove the gel components. The drug concentration was then determined using a suitable quantitative analytical method such as UV-Visible spectroscopy or HPLC.
The percentage drug content was calculated using:
Drug Content %=Actual amount of drug presentTheroretical amount of drug×100

3. RESULT
3.1 Pre formulation studies
A. Pre formulation studies of Curcumin
1. Authentication of curcumin
The procured Curcumin was authenticated by the supplier/manufacturer and the authentication Certificate of Analysis was obtained. The report confirmed the identity and quality of Curcumin used for the formulation studies. The sample was reported to have 99% purity and was considered suitable for further preformulation and formulation studies.
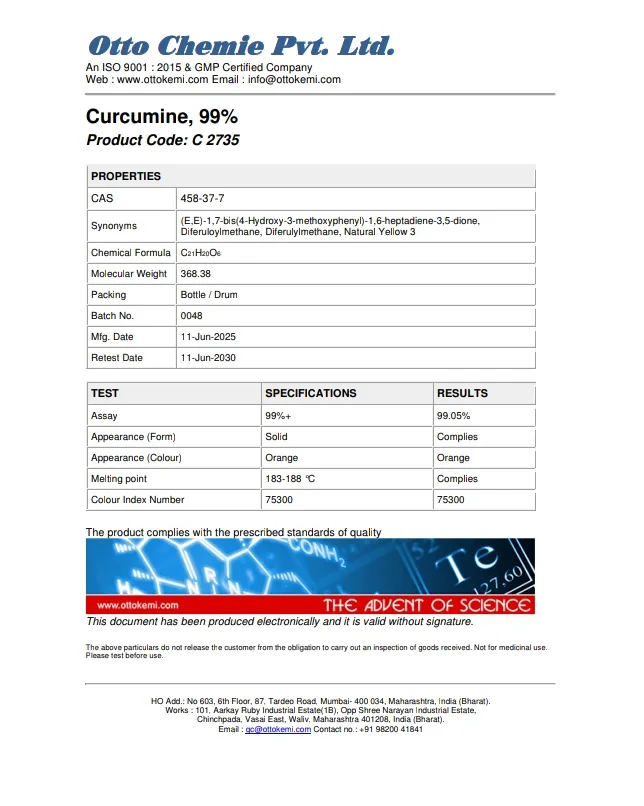
Fig 8: Authentication Certificate of Analysis of Curcumin
2. Determination of Organoleptic characters
The Organoleptic characters like colour, Odour and state for the given drug sample was studied.
Table 5: Organoleptic test of Curcumin
|
Colour |
Orange |
|
Appearance |
Solid (powder) |
|
Odour |
Visually odourless |
|
Texture |
Fine Powder |
3. Determination of Solubility
Table 6: Solubility profile of Curcumin
|
Medium |
Solubility |
|
Water |
Insoluble |
|
Diethyl Ether |
Soluble |
|
Phosphate buffer Ph:7.4 |
Partially Insolube |
4. Determination of Melting point
Table 7: Melting point of Curcumin
|
Drug Name |
Observed Melting point |
Standard Melting point |
|
Curcumin |
185°C |
183–188 °C |
5. Moisture Content (Loss on Drying)
Table 8: Determination of Moisture Content of Curcumin
|
Parameter |
Observation |
|
W₁ = Weight of empty Petri Dish |
28.65 g |
|
W₂ = Empty Petri Dish + curcumin before drying |
29.15 g |
|
W₃ = Weight of Petri Dish + curcumin after drying |
29.14 g |
|
Moisture Content |
2.0 % |
6. UV Spectrophotometric Analysis
Table 9: λmax of Curcumin
|
Drug Name |
Observed λmax (nm) |
Standard λmax (nm) |
|
Curcumin |
425 nm |
421 nm-425 nm |
7. Ash Value
Table 10: Determination of Ash Value of Curcumin
|
Parameter |
Observation |
|
Weight of empty crucible |
30.000 g |
|
Weight of curcumin sample |
2.000 g |
|
Weight of crucible + ash |
30.020 g |
|
Weight of ash |
0.020 g |
|
Ash value |
1.0% w/w |
|
Ash value=1.0% |
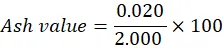
Weight of ash = 30.020 − 30.000 = 0.020g
Ash value=0.0202.000 ×100
8. Extractive Value Determination of Curcumin
Extractive Value %=4.25×100

|
Extractive value =84% w/w |
|
Parameter |
Observation |
|
Weight of sample |
5.0 g |
|
Weight of dried extract |
4.2 g |
|
Extractive value |
84% w/w |
9. Preliminary phytochemical screening
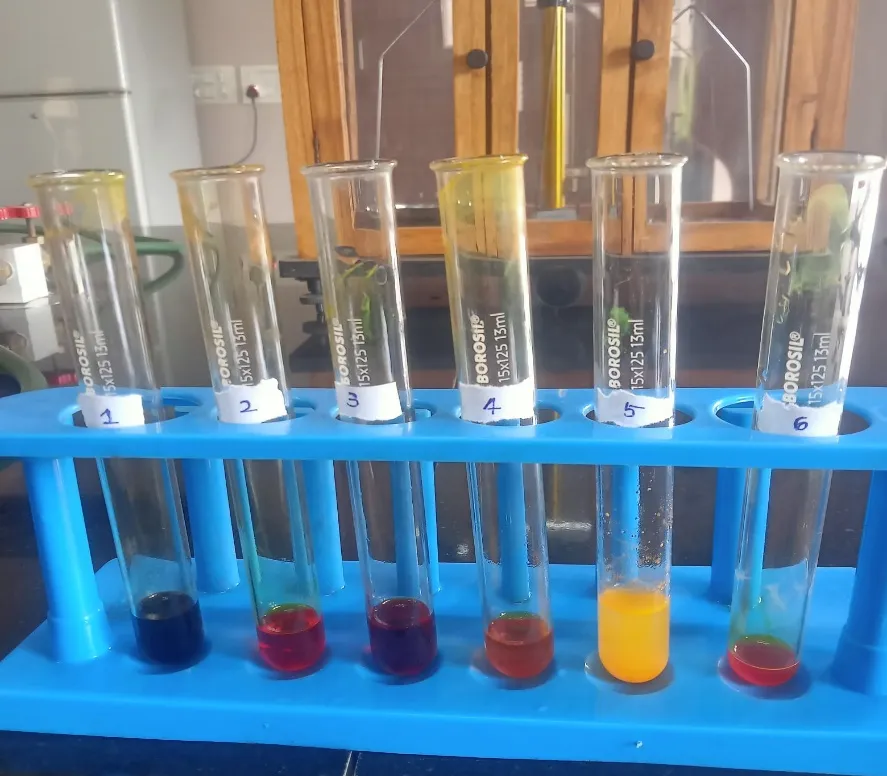
Fig 9: Preliminary Phytochemical Screening of Curcumin
Table 12: Results of Preliminary Phytochemical Screening of Curcumin
|
S.No |
Phytochemical |
Test |
Observation |
Inference |
|
1. |
Phenols |
Ferric Chloride Test |
Blue/Green/violet/brown colour develops |
Phenols Present |
|
2. |
Flavonoids |
Shinoda Test |
No characteristic pink/ Red/Orange Colour |
Flavonoids Absent |
|
3. |
Tannins |
Gelatin Test |
No White precipitate |
Tannins Absent |
|
4. |
Alkaloids |
Dragendorff’s Test |
No orange/reddish brown precipitate |
Alkaloids Absent |
|
5. |
Saponins |
Foam Test |
No persistant foam |
Saponins Absent |
|
6. |
Terpenoids |
Salkowski Test |
No reddish – brown colour at interface |
Terpenoid Absent |
B. Tea Tree Oil
1. Authentication report of Tea Tree Oil
The procured Tea Tree Oil was authenticated using the Certificate of Analysis (COA) provided by the supplier. The certificate confirmed the identity and quality of the Tea Tree Oil. The major constituents were reported to be terpinen-4-ol (35–48%), γ-terpinene (14–28%) and α-terpinene (6–12%), confirming the characteristic composition of Tea Tree Oil. The sample was considered suitable for further formulation studies.
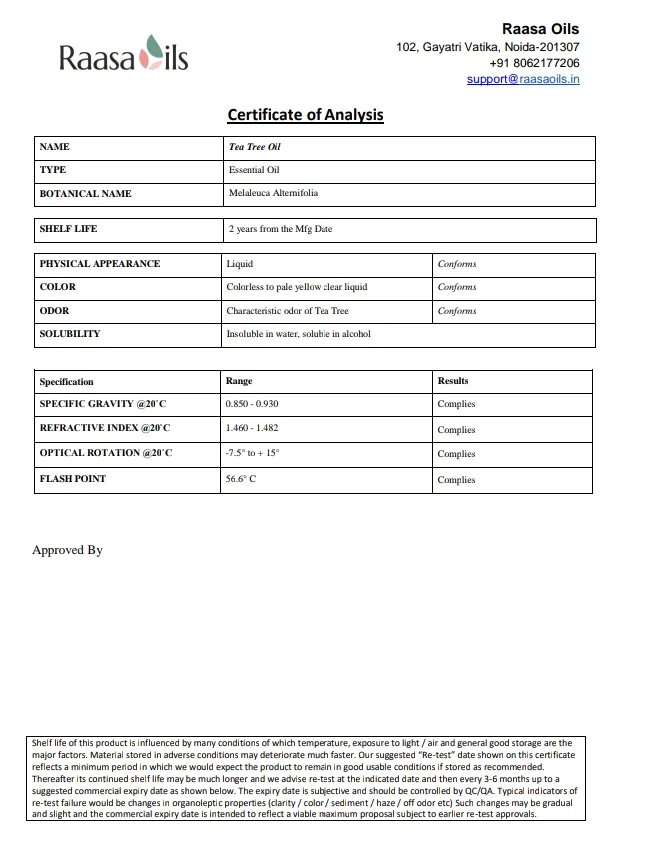
Fig 10: Authentication Certificate of Analysis of Tea Tree Oil
2. Organoleptic Evaluation
Table 13: Organoleptic test of Tea Tree Oil
|
Colour |
Colourless |
|
Appearance |
Clear Liquid |
|
Odour |
Strong Characteristic Odour |
3. Solubility Study
Table 14: Solubility profile of Tea Tree Oil
|
Medium |
Solubility |
|
Water |
Insoluble forms a sperate layer |
|
Diethyl Ether |
Soluble |
|
Phosphate buffer Ph:7.4 |
Partially Insolube |
4. Specific Gravity
Table 15: Determination of Specific Gravity of Tea Tree Oil
|
Parameter |
Observation |
|
W1 - Weight of empty bottle |
25.63 g |
|
W2 - Weight of bottle + Water |
52.32 g |
|
W3 – Weight of bottle + Tea Tree Oil |
49.30 g |
|
W2 – W1 |
26.69 g |
|
W3 – W1 |
23.67 g |
|
Specific Gravity |
0.8868 |
5. UV-Spectrometric Analysis
Table 16: λmax of Tea Tree Oil
|
Drug Name |
Observed λmax (nm) |
|
Tea Tree Oil |
267 nm |
Table 17: Determination of Partition Coefficient of Tea Tree Oil
|
Parameter |
Observation |
|
W1 – Weight of empty evaporating dish (organic phase) |
96.57 g |
|
W2 – Weight of dish + recovered oil (organic phase) |
97.18 g |
|
W₃ – Weight of empty evaporating dish (aqueous phase) |
79.05 g |
|
W₄ – Weight of dish + recovered oil (aqueous phase) |
79.15 g |
|
Cₐ – Amount of Tea Tree Oil in organic phase |
0.61 g |
|
Cₒ – Amount of Tea Tree Oil in aqueous phase |
0.10 g |
|
Partition coefficient of Tea Tree Oil between the organic phase and aqueous phase |
6.1 |
7. Preliminary phytochemical screening
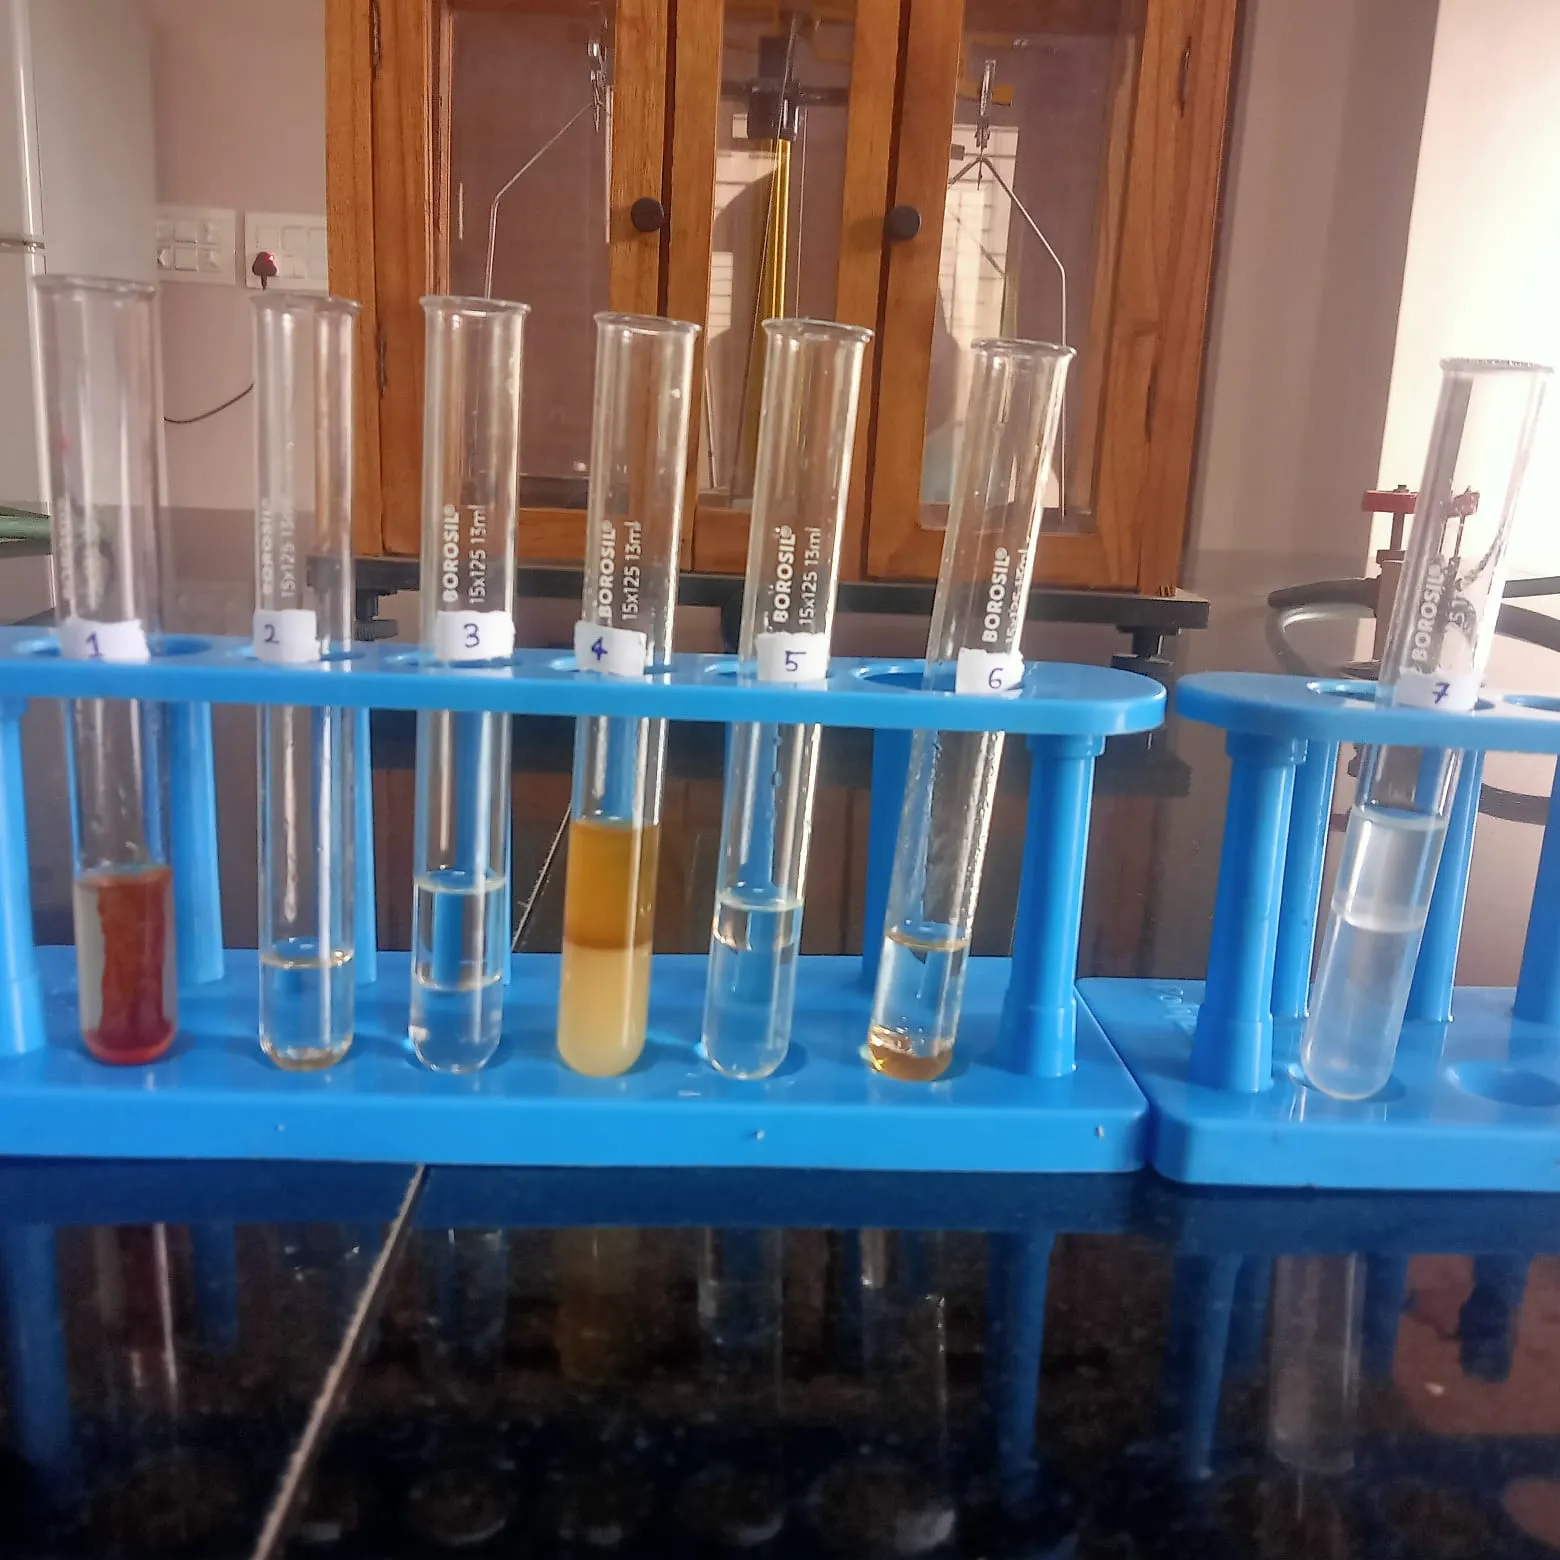
Fig 11: Preliminary Phytochemical Screening of Tea Tree Oil
Table 18: Results of Preliminary Phytochemical Screening of Tea Tree Oil
|
S.No |
Phytochemical |
Test |
Observation |
Inference |
|
1. |
Terpenoids |
Salkowski test |
Reddish-brown colour develops at the interface |
Terpenoids Present |
|
2. |
Steroids |
Liebermann–Burchard test |
No green/bluish-green colour develops |
Steroids Absent |
|
3. |
Phenols |
Ferric chloride test
|
No blue/green/violet colour develops |
Phenols Absent |
|
4. |
Flavonoids |
Shinoda test |
No characteristic pink/red/orange colour develops. |
Flavonoids Absent |
|
5. |
Tannins |
Ferric chloride test
|
No blue-black/green colour develops |
Tannins Absent |
|
6. |
Saponins
|
Foam test
|
No persistent foam develops |
Saponins Absent
|
|
7. |
Alkaloids |
Dragendorff's test |
No orange/reddish-brown precipitate. |
Alkaloids Absent |
3.2 Evaluation of niosomes
1. Appearance
Table 19: Appearance of the Prepared Niosomal Formulations (F1–F4)
|
Parameter |
F1 |
F2 |
F3 |
F4 |
|
Colour |
Yellowish-green |
Yellowish-green |
Yellowish-green |
Yellowish-green |
|
Odour |
Characteristic odour of tea tree oil |
Characteristic odour of tea tree oil |
Characteristic odour of tea tree oil |
Characteristic odour of tea tree oil |
|
Texture |
Smooth |
Smooth |
Smooth and uniform |
Smooth |
|
Clarity |
Uniform |
Uniform |
Uniform |
Uniform |
|
Homogeneity |
Homogeneous |
Homogeneous |
Homogeneous |
Homogeneous |
|
Lumps/Aggregates |
Absent |
Absent |
Absent |
Absent |
|
Precipitation |
Absent |
Absent |
Absent |
Absent |
|
Phase separation |
Absent |
Absent |
Absent |
Absent |
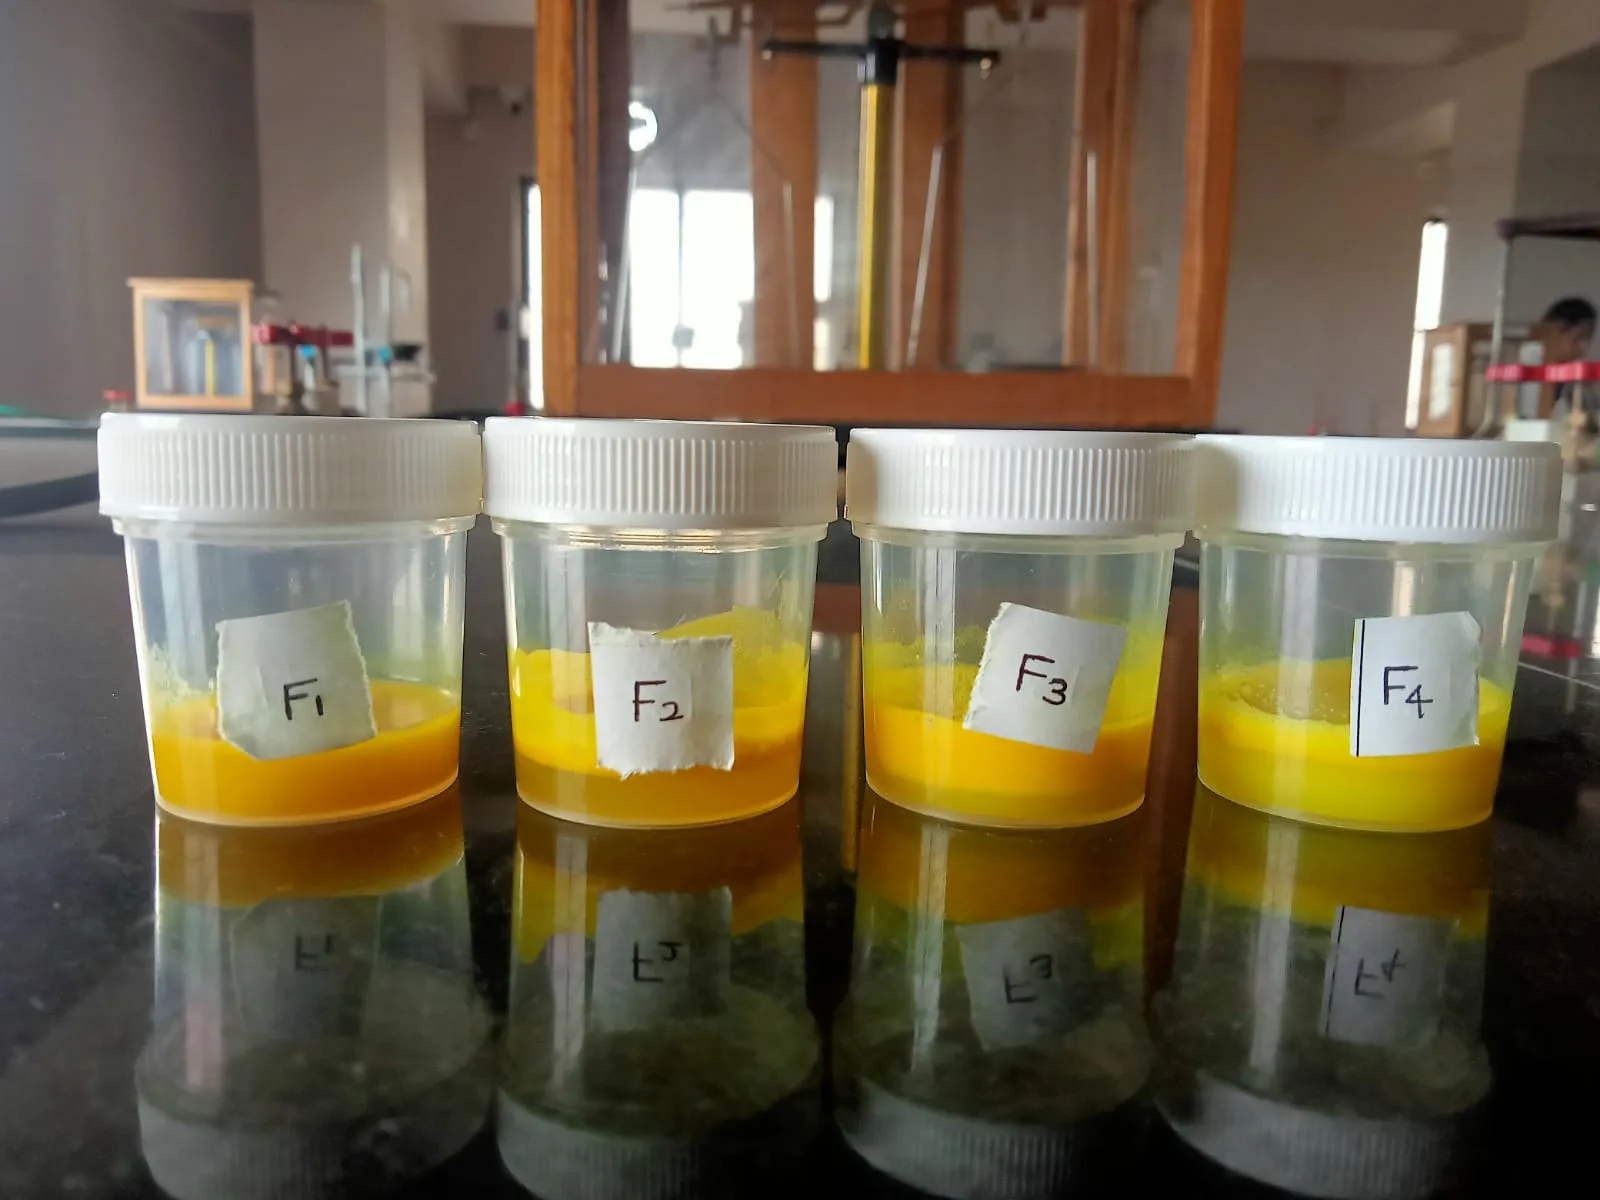
Fig 12: Prepared Niosomal Formulations (F1–F4)
2. Homogeneity
Table 20: Homogeneity of the Prepared Niosomal Formulations (F1–F4)
|
Parameter
|
F1 |
F2 |
F3 |
F4 |
|
Uniform distribution |
Good |
Good |
Excellent |
Good |
|
Lumps/Aggregates |
Absent |
Absent |
Absent |
Absent |
|
Foreign particles |
Absent
|
Absent |
Absent |
Absent |
|
Consistency |
Uniform |
Uniform |
Highly uniform |
Uniform |
|
Overall homogeneity |
Good |
Good |
Excellent |
Good |
3. pH
Table 21: pH of the Prepared Niosomal Formulations (F1–F4)
|
Formulation |
pH |
|
F1 |
6.2 |
|
F2 |
6.3 |
|
F3 |
6.4 |
|
F4 |
6.5 |
4. Particle Size
Table 22: Particle Size of Optimized Niosomal Formulation (F3)
|
Formulation code |
Particle Size |
|
F3 |
286 nm |
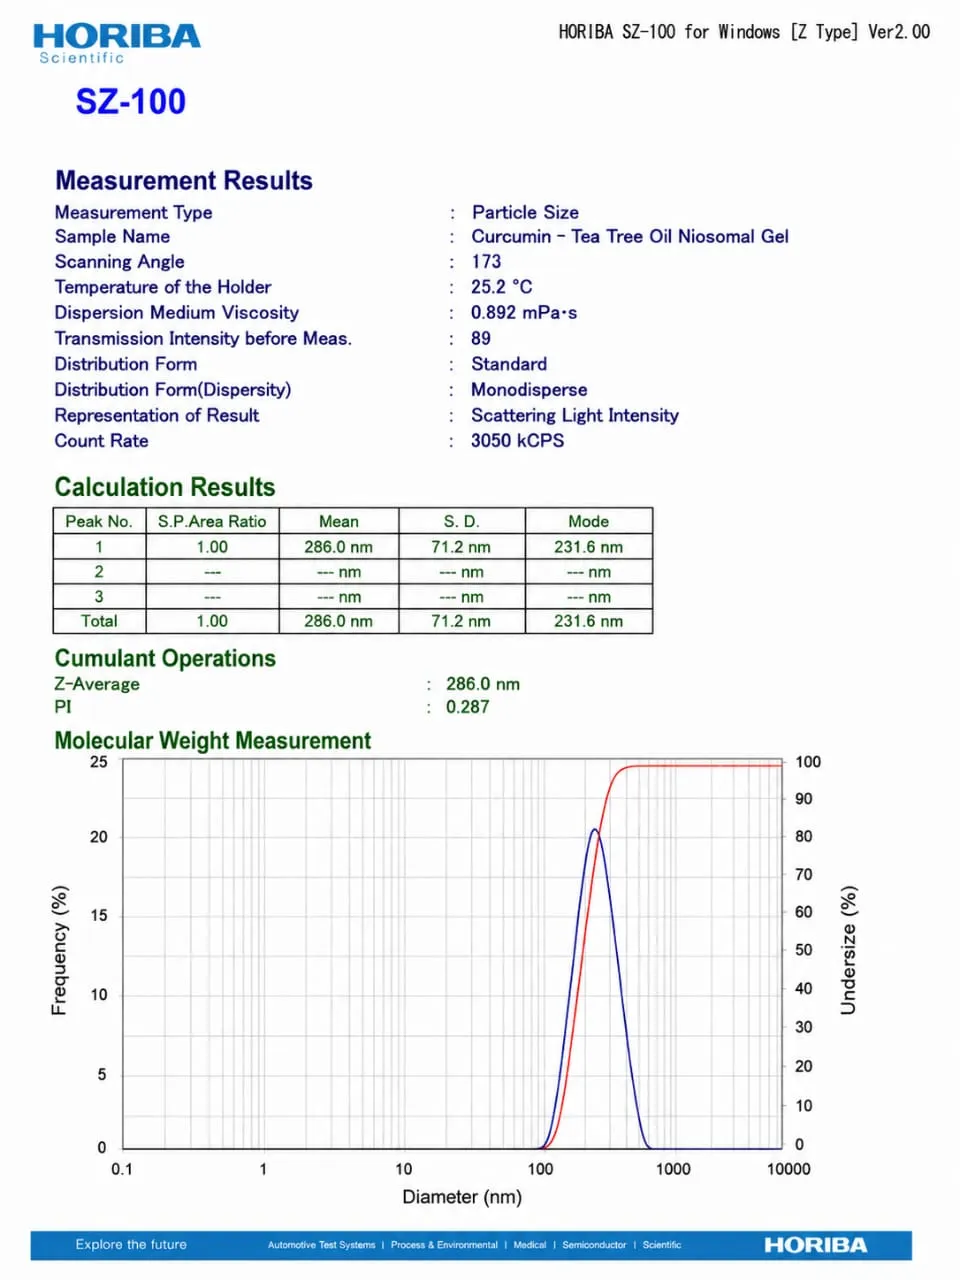
Fig 13: Particle Size Analysis of F3 Niosomal Formulation
5. Zeta Potential
Table 23: Zeta Potential of Optimized Niosomal Formulation (F3)
|
Formulation Code |
Zeta Potential |
|
F3 |
- 32.4 mV |
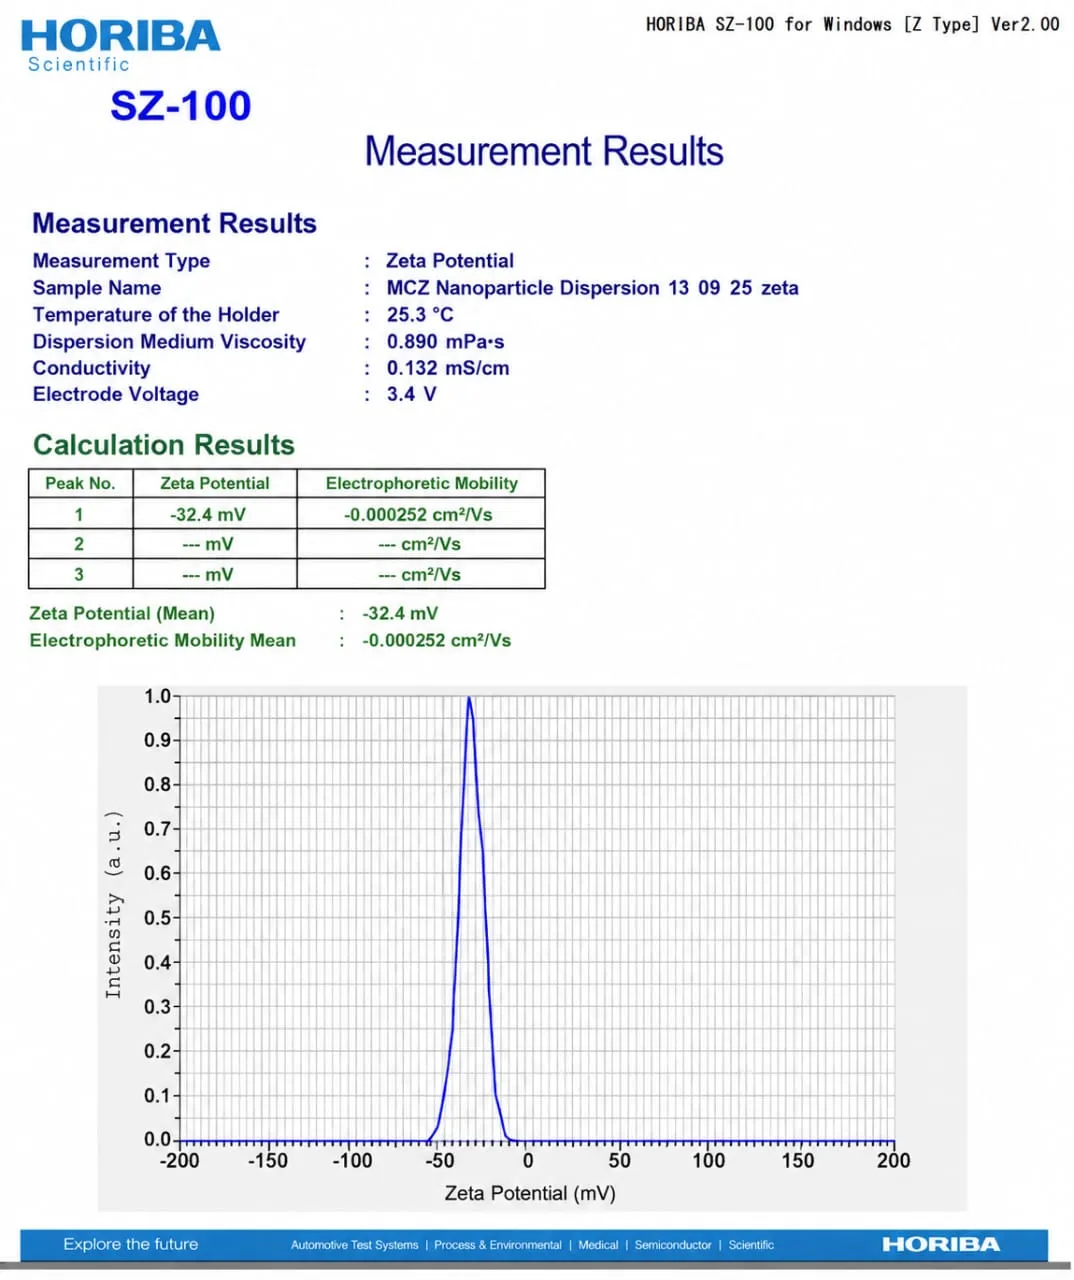
Fig 14: Zeta Potential of F3 Niosomal Formulation
6. Drug Entrapment Efficacy
Table 24: Entrapment Efficiency of the Prepared Niosomal Formulations (F1–F4)
|
SI.NO |
Formulation Code |
Percentage Entrapment Efficacy (%) |
|
1. |
F1 |
72.4 % |
|
2. |
F2 |
78.6 % |
|
3. |
F3 |
84.7 % |
|
4. |
F4 |
81.3 % |
Table 25: Drug Content of the Prepared Niosomal Formulations (F1–F4)
|
Formulation |
Drug Content (%) |
|
F1 |
94.2 |
|
F2 |
95.6 |
|
F3 |
97.1 |
|
F4 |
96.8 |
3.3 Evaluation of niosomal gel
1.Appearance
Table 26: Appearance of the Prepared Niosomal Gel Formulations (G1-G3)
|
Parameter |
G1 |
G2 |
G3 |
|
Colour |
Yellowish |
Yellowish |
Yellowish |
|
Odour |
Characteristic |
Characteristic |
Characteristic |
|
Texture |
Smooth |
Smooth |
Smooth |
|
Consistency |
Uniform |
Uniform |
Uniform |
|
Phase separation |
Absent |
Absent |
Absent |
2. Homogeneity
Table 27: Homogeneity of the Prepared Niosomal Gel Formulations (G1–G3)
|
Parameter |
G1 |
G2 |
G3 |
|
Uniformity |
Good |
Good |
Good |
|
Lumps/Aggregates |
Absent |
Absent |
Absent |
|
Foreign Particles |
Absent |
Absent |
Absent |
|
Phase separation |
Absent |
Absent |
Absent |
3. pH
Table 28: pH of the Prepared Niosomal Gel Formulations (G1–G3)
|
Formulation |
pH |
|
G1 |
5.42 |
|
G2 |
5.48 |
|
G3 |
5.55 |
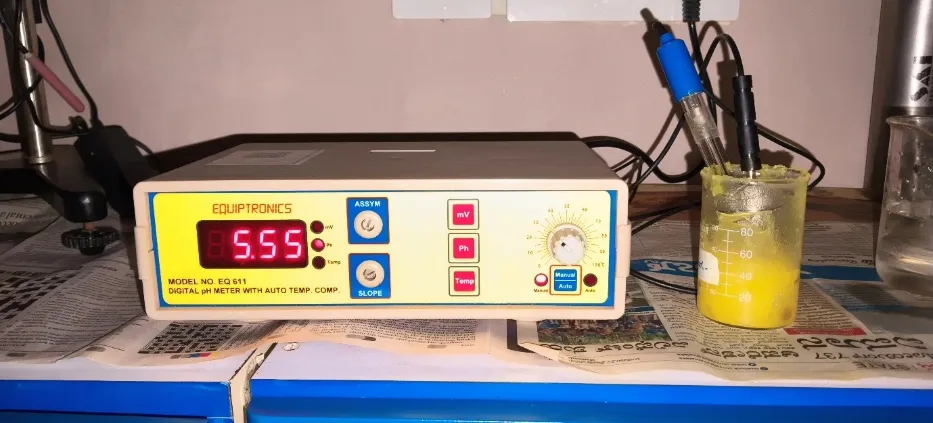
Fig 15: pH of Optimized Niosomal Gel Formulation (G3)
4. Viscosity
Table 29: Viscosity of the Prepared Niosomal Gel Formulations (G1–G3)
|
Formulation |
Viscosity (cP) |
|
G1 |
8420 |
|
G2 |
9180 |
|
G3 |
10308 |
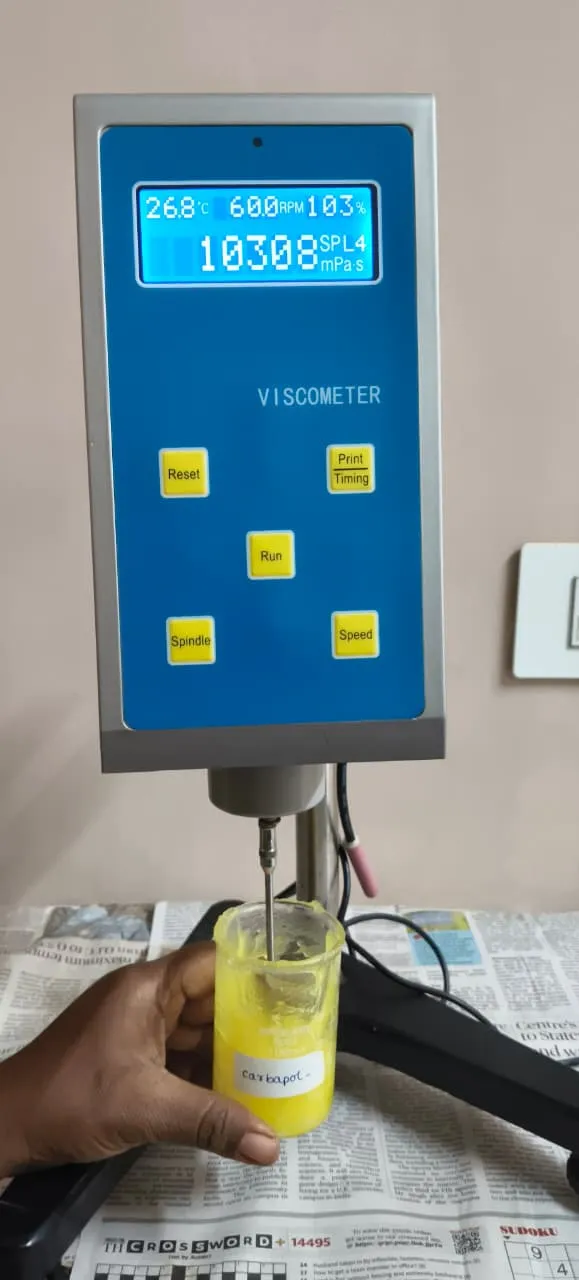
Fig 16: Viscosity of G3 Niosomal Gel Formulation
5. Spreadability
Table 30: Spreadability of Optimized Niosomal Gel Formulation (G3)
|
Applied weight (M) |
Distance (L) |
Time (T) |
Spreadability (g.cm/sec) |
|
6 g |
1.4 cm |
60 sec |
0.14 |
|
50 g |
1.5 cm |
60 sec |
1.25 |
|
100 g |
1.9 cm |
60 sec |
3.17 |
|
150 g |
2.5 cm |
60 sec |
6.25 |
6. Extrudability
Table 31: Extrudability of the Prepared Niosomal Gel Formulations (G1–G3)
|
Formulation |
Gel extruded (g) |
Time (sec) |
Extrudability (g/sec) |
|
G1 |
0.80 |
10 |
0.080 |
|
G2 |
0.85 |
10 |
0.085 |
|
G3 |
0.90 |
10 |
0.090 |
7. Drug Content
Table 32: Drug Content of Niosomal Gel Formulations (G1–G3)
|
Formulation |
Drug content (%) |
|
G1 |
94.26 |
|
G2 |
96.18 |
|
G3 |
98.42 |
DISCUSSION
The present study was carried out to develop a Curcumin and Tea Tree Oil-loaded niosomal gel enriched with Aloe vera as a potential topical formulation for acne management. The formulation approach combined the selected natural active ingredients with a niosomal delivery system and an Aloe vera-enriched Carbopol 934 gel base.
The preformulation studies provided preliminary information regarding the physicochemical characteristics of Curcumin and Tea Tree Oil and supported their selection for formulation development. Curcumin showed an orange-coloured, odourless solid nature, while its observed melting point was 185°C and the λmax was 425 nm. The moisture content and ash value were found to be 2.0% and 1.0%, respectively. The extractive value was 84% w/w. Tea Tree Oil was obtained as a clear, colourless liquid with a characteristic odour. Its specific gravity was found to be 0.8868 and the λmax was 267 nm. These preformulation findings provided useful information for the subsequent formulation studies.
The niosomal formulations F1–F4 were prepared using different concentrations of Span 20 and stearic acid while maintaining the quantities of Curcumin and Tea Tree Oil constant. The variation in the formulation composition produced differences in the physicochemical characteristics of the prepared niosomes. Among the formulations, F3 showed the most satisfactory overall characteristics and was therefore selected as the optimized niosomal formulation.
The optimized F3 formulation exhibited a particle size of 286 nm with a PDI of 0.287. The nanosized particle size indicates the formation of a vesicular system suitable for investigation as a topical nanocarrier, while the PDI value indicates a relatively uniform particle-size distribution. The zeta potential of F3 was found to be −32.4 mV. The presence of surface charge may contribute to repulsion between vesicles and thereby support the physical stability of the niosomal dispersion.
F3 showed an entrapment efficiency of 84.7%, indicating effective incorporation of Curcumin into the niosomal vesicles. The drug content of F3 was 97.1%, demonstrating satisfactory drug incorporation within the optimized formulation. Considering the particle size, zeta potential, entrapment efficiency and drug content, F3 was selected for incorporation into the gel base.
The optimized niosomal dispersion was incorporated into a Carbopol 934 gel base enriched with Aloe vera to obtain the niosomal gel formulations G1–G3. The prepared gel formulations showed smooth and uniform characteristics without visible phase separation. The pH values of the formulations were within an acceptable range for topical application, indicating their suitability for further evaluation.
Among the prepared gel formulations, G3 exhibited the highest viscosity of 10308 cP. The viscosity indicates that the formulation possessed adequate consistency for topical application. The spreadability results demonstrated that the optimized gel could spread over the surface when an external weight was applied, which is important for convenient application over the affected skin area. The extrudability values of G1, G2 and G3 were 0.080, 0.085 and 0.090 g/sec, respectively, indicating that the formulations could be readily removed from their container.
The drug content of the prepared gel formulations was found to be 94.26%, 96.18% and 98.42% for G1, G2 and G3, respectively. G3 showed the highest drug content among the prepared formulations. Based on its overall appearance, homogeneity, pH, viscosity, spreadability, extrudability and drug content, G3 was selected as the optimized niosomal gel formulation.
Overall, the results demonstrate the feasibility of incorporating Curcumin and Tea Tree Oil into a niosomal system and subsequently incorporating the optimized niosomes into an Aloe vera-enriched Carbopol 934 gel. The optimized formulation showed satisfactory physicochemical characteristics and therefore represents a potential polyherbal topical delivery system for acne management. Further studies such as in-vitro drug release, skin permeation, antimicrobial activity and stability studies are required to establish its performance and therapeutic potential.
CONCLUSION
The present study was successfully carried out through preformulation studies and systematic evaluation of the prepared niosomal formulations and niosomal gel, leading to the following conclusions:
The preformulation studies of Curcumin, including authentication, organoleptic properties, solubility, melting point, moisture content, UV spectrophotometric analysis, ash value, extractive value, and preliminary phytochemical screening, were performed and the obtained results were found to be satisfactory for further formulation development. The preformulation studies of Tea Tree Oil, including authentication, organoleptic properties, solubility study, specific gravity, UV spectrophotometric analysis, partition coefficient, and preliminary phytochemical screening, were carried out and the results supported its suitability for incorporation into the formulation.
The prepared niosomal formulations were evaluated for appearance, homogeneity, pH, particle size, zeta potential, entrapment efficiency, and drug content. Among the prepared formulations, F3 was selected as the optimized niosomal formulation based on its satisfactory evaluation characteristics.
The optimized F3 niosomal formulation was incorporated into a Carbopol 934 gel base enriched with Aloe vera to develop a topical niosomal gel.
The prepared niosomal gel formulations were evaluated for appearance, homogeneity, pH, viscosity, spreadability, extrudability, and drug content. Among the prepared gel formulations, G3 was selected as the optimized niosomal gel formulation based on its satisfactory physicochemical characteristics.
The optimized G3 niosomal gel exhibited suitable physicochemical properties, including acceptable appearance and homogeneity, skin-compatible pH, suitable viscosity, good spreadability and extrudability, and satisfactory drug content, indicating its potential suitability for topical application.
Hence, the study successfully demonstrated the feasibility of developing a Curcumin and Tea Tree Oil-loaded niosomal gel enriched with Aloe vera as a potential polyherbal topical formulation for the management of acne.
ACKNOWLEDGEMENT
The authors sincerely express their gratitude to Mrs. Anju K. P., Department of Pharmaceutics, Spurthy College of Pharmacy, Bengaluru, for her valuable guidance, continuous support, and encouragement throughout this research work. The authors also thank the management, Principal, faculty members, and staff of the institution for providing the necessary facilities and support for the successful completion of this study.
CONFLICT OF INTEREST
The authors declare that there are no conflicts of interest.
REFERENCES






Swetha V, Navyashree V, Chandana V, Amaldev K M, Abin T S, Anju K P, Curcumin and Tea Tree Oil-Loaded Niosomal Gel with Aloe Vera: A Polyherbal Approach to Anti-Acne Therapy, Int. J. of Pharm. Sci., 2026, Vol 4, Issue 9, 2315-2346, https://doi.org/10.5281/zenodo.22867615
 10.5281/zenodo.22867615