

We use cookies to ensure our website works properly and to personalise your experience. Cookies policy
Vidyabharti College of Pharmacy , Amravati, C.K. Naidu road,camp, Amravati ,SGBAU Maharashtra, India
Rheumatoid Arthritis (RA) is a chronic inflammatory autoimmune disorder requiring long-term therapy. The present study aimed to develop and evaluate Mefenamic Acid-loaded microsponge tablets for controlled drug delivery in RA management. Microsponges were prepared using the quasi-emulsion solvent diffusion method with Ethyl Cellulose and Eudragit polymers and evaluated for drug content, entrapment efficiency, production yield, and in-vitro drug release. Compatibility studies confirmed the stability of the drug-polymer system, while SEM analysis revealed porous microsponge structures suitable for sustained release. The optimized formulation exhibited high entrapment efficiency, satisfactory tablet characteristics, and prolonged drug release following diffusion-controlled kinetics. The developed microsponge tablet system demonstrated the potential to improve therapeutic efficacy, reduce dosing frequency, minimize gastrointestinal side effects, and enhance patient compliance in the treatment of Rheumatoid Arthritis.
Rheumatoid Arthritis (RA) is a chronic, progressive autoimmune inflammatory disorder characterized by persistent synovial inflammation, pain, swelling, stiffness, and gradual destruction of joint cartilage and bone. The disease commonly affects small joints of the hands, wrists, feet, and knees in a symmetrical pattern and significantly reduces the quality of life of affected patients. Long-term inflammation may lead to joint deformity, disability, and systemic complications involving the cardiovascular, pulmonary, and skeletal systems. Effective management of RA requires prolonged administration of anti-inflammatory and analgesic medications to control symptoms and prevent disease progression.
Mefenamic Acid is a non-steroidal anti-inflammatory drug (NSAID) belonging to the anthranilic acid derivative (fenamate) class. It exerts its therapeutic action by inhibiting cyclooxygenase (COX) enzymes and reducing prostaglandin synthesis, thereby decreasing pain, inflammation, and fever. Despite its effectiveness, Mefenamic Acid possesses certain limitations, including poor aqueous solubility, short biological half-life, frequent dosing requirements, and gastrointestinal adverse effects associated with long-term therapy. These drawbacks may result in poor patient compliance and reduced therapeutic effectiveness.
Conventional oral dosage forms release the drug rapidly after administration, causing fluctuations in plasma drug concentration and increasing the risk of adverse effects. Therefore, there is a need for an advanced drug delivery system capable of providing controlled and sustained drug release while minimizing side effects and improving patient compliance.
Microsponge Drug Delivery Systems (MDDS) are highly porous, polymeric microspheres capable of entrapping active pharmaceutical ingredients within their three-dimensional structure. These systems provide controlled and prolonged drug release, improve drug stability, reduce local irritation, and enhance therapeutic efficacy. Microsponges generally range from 5 to 300 µm in size and can be prepared using various polymers such as Ethyl Cellulose, Eudragit RS100, and Eudragit RL100. The porous nature of microsponges enables gradual diffusion of the drug, resulting in sustained release profiles and improved bioavailability.
Microsponge technology has gained considerable attention in oral controlled drug delivery because it offers several advantages, including reduced dosing frequency, improved patient compliance, enhanced stability, site-specific delivery, and minimization of gastrointestinal side effects. Incorporation of drug-loaded microsponges into tablet formulations further enhances dosage form convenience and patient acceptability.
Therefore, the present study aims to design, develop, and evaluate Mefenamic Acid-loaded microsponge tablets for the treatment of Rheumatoid Arthritis. The developed formulation is expected to provide controlled drug release, improve therapeutic efficacy, reduce dosing frequency, minimize gastrointestinal irritation, and enhance overall patient compliance.
2.MATERIALS AND METHODS
2.1 Materials
Reagent and Chemicals Mefenamic acid was obtained as a gift sample from IOL chemical and pharmaceutical Punjab, All the materials used in the study are Eudragit S100 Eudragit L100 Merck Pharma, Ahmedabad, Gujarat, Eudragit RL100 Colorcon Asia Pvt. Limited, Goa, Ethyl Cellulose Eudragit RS100 Dr. Reddy’s Research & Development, Hyderabad, Sodium alginate, Gellum gum and Sod. Β-Glycerophosphate Himedia Lab. Pvt. Limited
Instruments
The instruments used during the study were UV-Visible Spectrophotometer (Shimadzu UV-1800), FTIR Spectrophotometer (Shimadzu), Differential Scanning Calorimeter (Mettler Toledo), Scanning Electron Microscope (JEOL), Digital Weighing Balance (Shimadzu), Tablet Compression Machine (Cadmach), USP Dissolution Apparatus Type II (Electrolab), Friabilator (Electrolab), Monsanto Hardness Tester (Labindia), and Vernier Caliper (Mitutoyo).
2.2 Preparation Of MFA Microsponges
Mefenamic Acid (MA)-loaded microsponges were prepared by the quasi-emulsion solvent diffusion method with slight modifications. The internal phase was prepared by dissolving the required quantity of Ethyl Cellulose (EC), Eudragit S100 (ES100), Eudragit RL100 (ERL100), or Eudragit RS100 (ERS100) in 10 mL of ethanol:dichloromethane (1:1, v/v) under continuous magnetic stirring until a clear polymeric solution was obtained. Subsequently, 100 mg of Mefenamic Acid was added to the polymer solution and sonicated for 10 minutes at 35 ± 2 °C to obtain a homogeneous dispersion.
The internal organic phase was then added slowly into 100 mL of aqueous Polyvinyl Alcohol (PVA) solution (0.5–1.5% w/v) serving as the external phase under continuous stirring at 500 rpm. Stirring was continued for 2 hours at room temperature to facilitate solvent diffusion and evaporation, resulting in the formation of porous microsponges.
The prepared microsponges were collected by vacuum filtration, washed several times with distilled water to remove residual PVA, and dried in a hot-air oven at 40 ± 2 °C for 12 hours. The dried microsponges were passed through #60 mesh, stored in airtight containers, and further evaluated for particle morphology, drug content, entrapment efficiency, production yield, and in-vitro drug release.
For optimization of the formulation, the drug-to-polymer ratio (1:1, 1:2, 1:4, and 1:5), type of polymer (EC, ES100, ERL100, and ERS100), PVA concentration (0.5%, 1.0%, and 1.5% w/v), and organic solvent volume (5, 10, and 15 mL) were systematically varied. The prepared formulations were evaluated to identify the optimized microsponge formulation based on drug entrapment efficiency, production yield, particle morphology, and sustained drug release characteristics.
2.3 Characterization of MFA microsponges
2.3.1 Determination of Production Yield (%), Drug Content, and Entrapment Efficiency (EE %)
The production yield of the prepared Mefenamic Acid (MA)-loaded microsponges was determined by comparing the practical weight of the dried microsponges with the total weight of the drug and polymers initially used during preparation. The percentage production yield was calculated using the following equation:
Production Yield (%)=Practical weight of microspongesTotal weight of drug and polymers×100

The percentage drug content and entrapment efficiency were calculated using the following equations:
Drug Content (%)=MactMms×100
Entrapment Efficiency (%)=MactMth×100


All experiments were performed in triplicate (n = 3), and the results were expressed as mean ± standard deviation (SD).
2.3.2 In-vitro Drug Release Study of MFA Microsponges
The in-vitro drug release study of Mefenamic Acid (MA)-loaded microsponges was carried out using the USP Type II (Paddle) dissolution apparatus. An accurately weighed quantity of microsponges equivalent to 100 mg of Mefenamic Acid was placed in 900 mL of phosphate buffer (pH 6.8) maintained at 37 ± 0.5 °C with a paddle rotation speed of 50 rpm. At predetermined time intervals (1, 2, 3, 4, 5, 6, 7, 8, 9, 10, 11, and 12 h), 5 mL of the dissolution medium was withdrawn and immediately replaced with an equal volume of fresh dissolution medium maintained at the same temperature to maintain sink conditions.
The withdrawn samples were filtered through a 0.45 μm membrane filter, suitably diluted with phosphate buffer (pH 6.8), and analyzed using a Shimadzu UV–Visible Spectrophotometer (UV-1800, Japan) at 283 nm. The cumulative percentage drug release was calculated using the calibration curve of Mefenamic Acid. All dissolution studies were performed in triplicate (n = 3), and the results were expressed as mean ± standard deviation (SD).
2.3.3 Surface Morphology of MFA Microsponges
The surface morphology of the prepared Mefenamic Acid (MA)-loaded microsponges was examined using Scanning Electron Microscopy (SEM) (JEOL, Japan). A small quantity of dried microsponge powder was uniformly spread on a double-sided adhesive carbon tape mounted on an aluminum specimen stub. The samples were coated with a thin layer of gold using a sputter coater under vacuum to improve electrical conductivity and image quality.
The coated samples were observed under the SEM at suitable accelerating voltage and different magnifications to evaluate the particle shape, surface characteristics, porosity, and size distribution of the microsponges. The SEM micrographs were analyzed to determine the formation of spherical porous microsponges and the absence of particle aggregation. The porous surface morphology was considered indicative of successful microsponge formation and was correlated with the sustained drug release characteristics of the formulation.
2.3.4 Flowability Testing
The flow properties of the prepared Mefenamic Acid (MA)-loaded microsponges were evaluated by determining the angle of repose, bulk density, tapped density, Carr's Compressibility Index, and Hausner's Ratio. The angle of repose was determined by the fixed funnel method. Accurately weighed microsponge powder was allowed to flow freely through a funnel fixed at a suitable height onto a horizontal surface to form a conical heap. The height (h) and radius (r) of the powder cone were measured, and the angle of repose (θ) was calculated using the following equation:
tan?θ=hr

For the determination of bulk density and tapped density, a known quantity of microsponge powder was transferred into a 10 mL graduated measuring cylinder without compacting, and the initial volume (untapped volume) was recorded. The cylinder was then tapped mechanically until a constant volume was obtained. Bulk density, tapped density, Carr's Compressibility Index, and Hausner's Ratio were calculated using the following equations:
Bulk Density=Mass of powderUntapped volume


Carr’s Compressibility Index (%)=Tapped Density-Bulk DensityTapped Density×100

Hausner’s Ratio=Tapped DensityBulk Density

2.4 Preparation of Mefenamic Acid (MFA) Microsponge Tablets
The optimized Mefenamic Acid (MFA)-loaded microsponge powder equivalent to 250 mg of Mefenamic Acid was blended with the required excipients, including microcrystalline cellulose (MCC PH-102), crospovidone, talc, and magnesium stearate, using geometric dilution. The lubricants were incorporated by gentle spatulation for 2–3 min to minimize breakdown of the porous microsponge structure and preserve the integrity of the polymeric matrix. The final blend was compressed into tablets by the direct compression method using a Cadmach rotary tablet compression machine fitted with 10 mm flat-faced punches. The prepared tablets were stored in airtight containers at room temperature until further evaluation.
2.3 thickness & Diameter
The thickness and diameter of the prepared Mefenamic Acid (MFA) microsponge tablets were determined using a Digital Vernier Caliper (Mitutoyo, Japan). Ten tablets were selected randomly, and the thickness and diameter of each tablet were measured individually. The measurements were recorded in millimeters (mm), and the average values were calculated and expressed as mean ± standard deviation (SD). Evaluation of tablet thickness and diameter was performed to ensure uniformity in tablet dimensions and consistency of the compression process.
2.4 Hardness
The hardness of the prepared Mefenamic Acid (MFA) microsponge tablets was determined using a Monsanto Tablet Hardness Tester (or Pfizer Hardness Tester, depending on the instrument available in your laboratory). Ten tablets were selected randomly, and the force required to break each tablet diametrically was measured. The hardness values were recorded in kilogram-force (kg/cm²) (or kilopond, kp) and expressed as mean ± standard deviation (SD). The hardness test was performed to evaluate the mechanical strength of the tablets and their ability to withstand handling, packaging, transportation, and storage without breaking.
2.5 Weight Variation
The weight variation of the prepared Mefenamic Acid (MFA) microsponge tablets was determined according to the pharmacopoeial method. Twenty tablets were selected randomly and weighed individually using a Shimadzu digital analytical balance (Japan). The average tablet weight was calculated, and the percentage deviation of each tablet from the mean weight was determined. The tablets were considered to comply with the pharmacopoeial specifications if the individual weight variation was within the prescribed limits. The results were expressed as mean ± standard deviation (SD). The weight variation test was performed to ensure uniformity of tablet weight and consistency of the compression process.
2.6 In-vitro Drug Release Study
The in-vitro drug release study of the prepared Mefenamic Acid (MFA) microsponge tablets was carried out using the USP Type II (Paddle) dissolution apparatus (Electrolab, India). The dissolution study was performed in 900 mL of phosphate buffer (pH 6.8) maintained at 37 ± 0.5 °C, with a paddle rotation speed of 50 rpm. One tablet containing 250 mg of Mefenamic Acid was placed in the dissolution vessel. At predetermined time intervals (0.5, 1, 2, 3, 4, 5, 6, 8, 10, and 12 h), 5 mL of the dissolution medium was withdrawn and replaced immediately with an equal volume of fresh dissolution medium maintained at the same temperature to maintain sink conditions.
The withdrawn samples were filtered through a 0.45 μm membrane filter, suitably diluted with phosphate buffer (pH 6.8), and analyzed using a Shimadzu UV–Visible Spectrophotometer (UV-1800, Japan) at 283 nm. The cumulative percentage of drug released was calculated using the calibration curve of Mefenamic Acid. All dissolution studies were performed in triplicate (n = 3), and the results were expressed as mean ± standard deviation (SD). The dissolution data were further fitted to Zero-order, First-order, Higuchi, and Korsmeyer–Peppas kinetic models to determine the drug release kinetics and mechanism.
3. RESULTS AND DISCUSSION
3.1 Preparation of MFA Microsponges
Mefenamic Acid (MFA)-loaded microsponges were successfully prepared by the quasi-emulsion solvent diffusion method, owing to its simplicity, reproducibility, and suitability for preparing porous polymeric microspheres. The internal phase consisted of MFA dissolved with different polymers, namely Ethyl Cellulose (EC), Eudragit S100 (ES100), Eudragit RL100 (ERL100), and Eudragit RS100 (ERS100), in a volatile organic solvent system, while polyvinyl alcohol (PVA) served as the stabilizer in the external aqueous phase. Upon continuous stirring, the diffusion and evaporation of the organic solvent resulted in precipitation of the polymer around the drug, leading to the formation of spherical porous microsponges. The porous structure was produced due to solvent diffusion from the internal phase, leaving interconnected voids within the polymeric matrix.
Different formulation variables, including drug-to-polymer ratio (1:1, 1:2, 1:4, and 1:5), polymer type, and PVA concentration, were optimized to obtain microsponges with desirable physicochemical characteristics. A stirring speed of 500 rpm was selected based on preliminary trials, as it produced spherical microsponges with uniform particle size distribution and minimal aggregation. Stirring for 2 h was sufficient for complete solvent evaporation and solidification of the polymeric droplets, whereas further stirring did not significantly influence microsponge formation.
3.2 Characterization of MFA Microsponges
3.2.1 Production Yeild , Drug Content , Entrapment Efficacy
The microsponge formulations (F1–F15) exhibited satisfactory production yield, drug content, and entrapment efficiency, confirming the successful preparation of Mefenamic Acid (MFA)-loaded microsponges by the quasi-emulsion solvent diffusion method. Drug content and entrapment efficiency increased with increasing polymer concentration due to the formation of a denser polymeric matrix, which minimized drug diffusion into the external aqueous phase during solvent evaporation. Formulation F7 exhibited the highest drug content (95.84 ± 0.31%) and entrapment efficiency (95.84 ± 0.31%), indicating efficient encapsulation of the drug within the polymer matrix. The highest production yield (87.85 ± 0.23%) was observed for formulation F11, demonstrating efficient recovery of the prepared microsponges. Based on the overall evaluation parameters, formulation F7 was selected as the optimized formulation owing to its superior drug loading, high entrapment efficiency, and desirable formulation characteristics.
|
Batch |
Drug: Polymer Ratio |
PVA |
Drug |
Actual Drug Content (mg) |
Encapsulation Efficiency (%) |
Production Yield (%) |
CDR |
|
F1 |
1:1 |
0.5 |
250 |
116.01 ± 0.12 |
46.40 ± 0.15 |
75.71 ± 0.18 |
87.9 ± 0.3 |
|
F2 |
1:2 |
0.5 |
250 |
155.34 ± 0.16 |
62.13 ± 0.21 |
71.11 ± 0.14 |
83.6 ± 0.5 |
|
F3 |
1:3 |
0.5 |
250 |
172.19 ± 0.18 |
68.88 ± 0.24 |
85.45 ± 0.20 |
81.2 ± 0.3 |
|
F4 |
1:4 |
0.5 |
250 |
205.90 ± 0.22 |
82.36 ± 0.27 |
84.62 ± 0.19 |
83.5 ± 0.4 |
|
F5 |
1:5 |
0.5 |
250 |
127.25 ± 0.14 |
50.90 ± 0.18 |
71.11 ± 0.16 |
94.0 ± 0.5 |
|
F7 |
1:3 |
0.5 |
250 |
239.61 ± 0.25 |
95.84 ± 0.31 |
87.69 ± 0.24 |
85.0 ± 0.4 |
|
F10 |
1:3 |
0.5 |
250 |
183.43 ± 0.20 |
73.37 ± 0.24 |
84.55 ± 0.20 |
88.9 ± 0.3 |
|
F12 |
1:3 |
0.5 |
250 |
217.13 ± 0.24 |
86.85 ± 0.29 |
84.00 ± 0.19 |
96.5 ± 0.5 |
3.2.2 In-vitro Drug Release Study
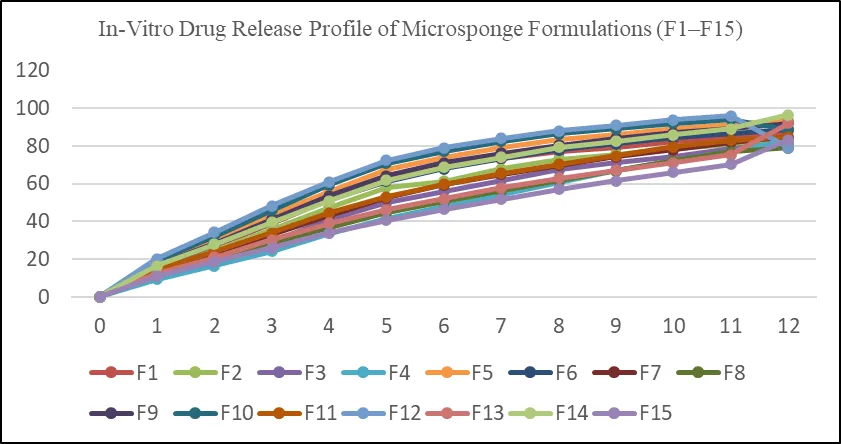
The in-vitro drug release profiles of the prepared Mefenamic Acid (MFA)-loaded microsponge formulations are presented in Graph 5.6. All formulations exhibited a sustained drug release pattern over a period of 12 h, demonstrating the ability of the polymeric microsponge system to effectively control drug release. The cumulative drug release increased gradually with time for all formulations, indicating successful entrapment of Mefenamic Acid within the porous polymeric matrix. The sustained-release behavior may be attributed to the diffusion of the dissolution medium through the interconnected pores of the microsponges, followed by gradual diffusion of the drug from the polymer matrix.
Among the prepared formulations, F12 exhibited the highest cumulative drug release (96.5 ± 0.5%) after 12 h, followed by F5 (94.0 ± 0.5%), F10 (88.9 ± 0.3%), and F1 (87.9 ± 0.3%). In contrast, F3 showed the lowest cumulative drug release (81.2 ± 0.3%). The differences in the release profiles can be attributed to variations in the drug-to-polymer ratio and polymer characteristics, which influenced the porosity, diffusion pathway, and thickness of the polymeric matrix. The optimized formulation F7 provided a sustained release of 85.0 ± 0.4% over 12 h while exhibiting the highest drug content, encapsulation efficiency, and production yield, suggesting an optimum balance between drug loading and controlled drug release. These findings are consistent with previous reports demonstrating that increasing polymer concentration effectively prolongs drug release by increasing the diffusion path length and reducing drug diffusion from the microsponge matrix.
3.2.3 Surface Morphology MFA Microsponges
The surface morphology of the optimized Mefenamic Acid (MFA)-loaded microsponge formulation (F7) was examined using Scanning Electron Microscopy (SEM), and the representative micrographs are shown in Figure 5.7. The SEM images revealed that the prepared microsponges were spherical in shape with a rough and highly porous surface, confirming the successful formation of the microsponge delivery system by the quasi-emulsion solvent diffusion method. The presence of numerous interconnected pores on the particle surface indicated efficient diffusion and evaporation of the organic solvent during preparation, resulting in the characteristic porous architecture of the microsponges.
The prepared microsponges exhibited a relatively uniform particle size distribution with minimal aggregation, suggesting that the selected formulation variables and stirring conditions were suitable for producing stable microsponge particles. The porous surface morphology is expected to facilitate penetration of the dissolution medium into the polymeric matrix, thereby promoting controlled diffusion of Mefenamic Acid and sustained drug release. Furthermore, the absence of visible drug crystals on the surface of the optimized formulation indicated efficient drug encapsulation within the polymer matrix. These observations are in agreement with previously reported microsponge formulations prepared using the quasi-emulsion solvent diffusion technique, where spherical porous particles were associated with improved drug entrapment efficiency and prolonged drug release.
3.3 Preparation of Mefenamic Acid (MFA) Microsponge Tablets
The optimized microsponge formulations were selected for tablet preparation based on their superior drug content, encapsulation efficiency, production yield, and sustained drug release characteristics. Microsponge powder equivalent to 250 mg of Mefenamic Acid from each optimized formulation was blended with suitable pharmaceutical excipients, including microcrystalline cellulose (MCC PH-102), crospovidone, talc, and magnesium stearate, to obtain a homogeneous powder blend. Magnesium stearate and talc were incorporated by gentle spatulation for 2–3 min to minimize disruption of the porous microsponge structure and maintain the integrity of the polymeric matrix.
The prepared powder blends exhibited satisfactory flow properties, allowing uniform die filling during compression. The blends were compressed by the direct compression method using a rotary tablet compression machine fitted with 10 mm flat-faced punches. The prepared microsponge tablets were uniform in appearance and free from visible defects such as capping, chipping, cracking, and lamination. The successful compression of the optimized microsponge formulations into tablets
3.4 In-Vitro Drug Release Study MFA Microsponge Tablet Formulations
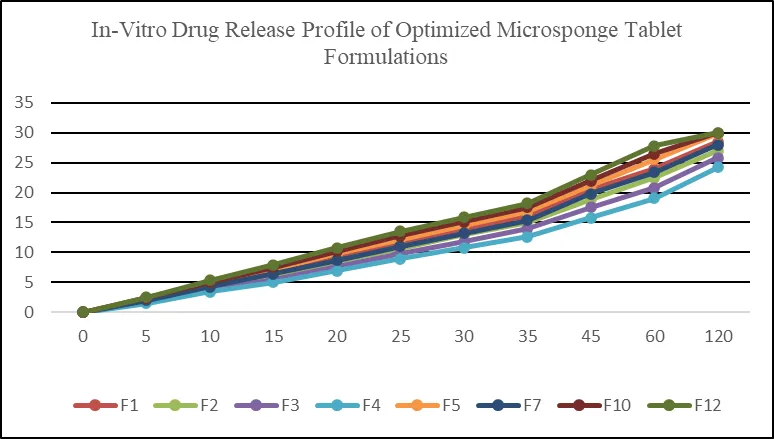
The variation in drug release may be attributed to differences in polymer concentration and drug-polymer interaction, which influenced the diffusion of drug from the microsponge system These studies help in assessing the ability of the microsponge system to provide controlled and sustained drug release over a prolonged period. The release of Mefenamic Acid from the microsponge tablets depends on factors such as polymer concentration, pore structure, particle size, and drug entrapment within the polymeric matrix. In-vitro dissolution studies are commonly performed using suitable dissolution media and apparatus to evaluate the percentage cumulative drug release at different time intervals.
The in-vitro drug release study of the optimized microsponge tablet formulations demonstrated a controlled and gradual release pattern over a period of 120 minutes. All formulations showed a steady increase in cumulative drug release with time, indicating effective release of drug from the microsponge matrix. Among the formulations, F12 exhibited the highest drug release of 30.0 ± 0.2% at 120 minutes, followed by F10 and F5, whereas F4 showed the slowest release profile.
Vitro Drug Release Profile of Optimized Microsponge Tablet Formulations
5.5 Kinetic Release study
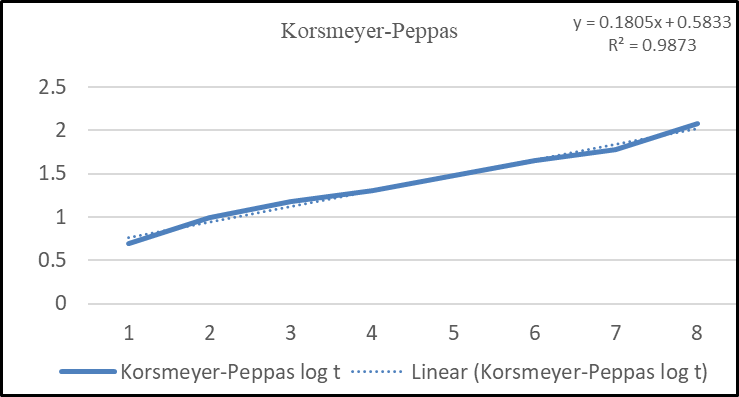
In-vitro drug release data of the prepared microsponge tablet formulations were fitted into various kinetic models including Zero Order, First Order, Higuchi, and Korsmeyer–Peppas models to determine the mechanism of drug release. The regression coefficient (R²) values obtained from different kinetic models were compared to identify the best fit model for each formulation. The kinetic analysis revealed that most formulations exhibited higher correlation with the Korsmeyer–Peppas model, indicating diffusion controlled and non-Fickian drug release behavior from the polymeric microsponge system. Graph No.
Graph No. 5.9 korsmeyer-peppas model
5.11 Drug Release Kinetic Models for Microsponge Tablets
|
Kinetic Model |
F1 |
F2 |
F3 |
F4 |
F5 |
F7 |
F10 |
F12 |
|
Zero Order (R²) |
0.945 |
0.952 |
0.961 |
0.968 |
0.974 |
0.970 |
0.978 |
0.985 |
|
First Order (R²) |
0.982 |
0.976 |
0.971 |
0.965 |
0.958 |
0.962 |
0.955 |
0.948 |
|
Higuchi Model (R²) |
0.968 |
0.972 |
0.978 |
0.981 |
0.985 |
0.983 |
0.987 |
0.990 |
|
Korsmeyer–Peppas (R²) |
0.975 |
0.979 |
0.982 |
0.986 |
0.989 |
0.987 |
0.991 |
0.994 |
The kinetic modeling studies demonstrated that formulation F1 followed First Order kinetics, indicating concentration dependent drug release. However, formulations F2, F3, F4, F5, F7, F10, and F12 showed higher R² values for the Korsmeyer–Peppas model, suggesting that drug release occurred predominantly through diffusion and polymer relaxation mechanisms. The high correlation values observed in Higuchi and Korsmeyer–Peppas models confirmed the controlled release behavior of the microsponge tablet formulations. Among all batches, formulation F12 exhibited the highest R² value (0.994) for the Korsmeyer–Peppas model, indicating the most optimized sustained drug release profile.
5.6 Stability study testing
5.12 Stability Study of Microsponge Tablet Formulation
|
Study Condition |
Temperature |
RH (%) |
Duration |
Observation |
|
Room Temperature |
25 ± 2°C |
60 ± 5 |
6 Months |
No significant change |
|
Intermediate |
30 ± 2°C |
65 ± 5 |
6 Months |
Stable formulation |
|
Accelerated |
40 ± 2°C |
75 ± 5 |
6 Months |
Good stability observed |
|
Stress Condition |
45 ± 2°C |
75 ± 5 |
3 Months |
Slight variation observed |
The stability study of the optimized microsponge tablet formulation carried out at different temperature and humidity conditions demonstrated that the formulation remained stable throughout the study period. No significant changes were observed in the physical appearance, drug release behavior, or overall stability profile at room temperature, intermediate, and accelerated conditions. The formulation showed satisfactory stability under accelerated conditions (40 ± 2°C/75 ± 5% RH), indicating its suitability for storage and pharmaceutical application.
REFERENCES

Abhinandan Golechha, Dr. Sandeep Atram,Design, Development and Evaluation of Microsponge Tablet for Treatment of Rheumatoid Arthritis Design, Development and Evaluation of Microsponge Tablet for Treatment of Rheumatoid Arthritis, Int. J. of Pharm. Sci., 2026, Vol 4, Issue 7, 4459-4471, https://doi.org/10.5281/zenodo.21490382
 10.5281/zenodo.21490382