

We use cookies to ensure our website works properly and to personalise your experience. Cookies policy
Bhagwan Mahavir Centre for Advance Research, Bhagwan Mahavir University, Surat, Gujarat, India.
Dermatofibrosarcoma protuberans (DFSP) is a locally aggressive cutaneous sarcoma for which conventional systemic administration of imatinib mesylate may be associated with dose-related adverse effects and limited site-specific drug availability. The present study aimed to develop and systematically optimize an imatinib mesylate-loaded poly (lactic-co-glycolic acid) (PLGA) nanoparticle-based topical nanogel to enhance local drug delivery. Imatinib mesylate-loaded nanoparticles were prepared by the emulsion solvent evaporation method and optimized using a three-factor, three-level Box–Behnken design. PLGA concentration, PVA concentration, and organic phase volume were selected as formulation variables, while particle size, polydispersity index (PDI), and entrapment efficiency were considered critical quality attributes. The optimized formulation exhibited a particle size of 234.5 nm, PDI of 0.204, and entrapment efficiency of 71.58%. Scanning electron microscopy revealed uniformly distributed, spherical and smooth-surfaced nanoparticles, corroborating the nanoscale characteristics obtained by dynamic light scattering. The optimized nanoparticles were subsequently incorporated into a Carbopol-based nanogel. The developed nanogel demonstrated satisfactory physicochemical properties, including a viscosity of 1904.07 ± 3.28, drug content of 99.26 ± 0.94%, pH of 7.19 ± 0.014, and good spreadability (28.0 ± 0.29). Notably, the nanogel exhibited substantially enhanced in vitro drug release, reaching 99.72 ± 6.20% within 360 min compared with 32.95 ± 3.56% from conventional imatinib gel. Release kinetics followed the Korsmeyer–Peppas model, suggesting a non-Fickian release mechanism involving diffusion coupled with polymer relaxation/erosion. Furthermore, the optimized nanogel retained its physicochemical characteristics under accelerated storage conditions, with an f? value of 74.74. Collectively, these findings demonstrate that the QbD-driven PLGA nanoparticle nanogel represents a promising topical platform for improving the delivery of imatinib mesylate and warrants further investigation using ex vivo permeation, pharmacodynamic, and in vivo models of DFSP
Dermatofibrosarcoma Protuberans (DFSP) is a low-grade cutaneous Sarcoma with exessive production of autocrine PDGFB. Platelet Derived Growth factor (PDGFB) & - collagen type -1α-1 [COL1A1] are the two main key genes which are responsible for causing the Dermatofibrosarcoma Protuberans (DFSP). Imatinib is an innovative tyrosine kinase inhibitor which has potency in disease in which the ABL, Kit and PDGFR genes. Have paramount role in driving the cell division of tumor (1). While delivering through oral route Imatinib shows some side defects including like mild to moderate nausea, myalgias, oedema, fatigue, dyspepsia & diarrhea. It is also P-gp substrate. So, it effused out drug molecule in intestinal cell & reduce their intracellular level (2).
This background information has encouraged us to develop Novel Topical Drug Delivery system (Transdermal Drug Delivery system) to over comes above discussed issues which could deliver drug to cancer cell. Simultaneously the delivery of drug Imatinib through the skin is difficult due to some problems like their physiochemical properties (solubility, ionization, molecular weight, Melting point) & the barrier function of Stratum corneum (3). Numerous strategies have been developed to enhance penetration of drug & improve efficacy of drug. A polymeric NPs is versatile drug delivery carrier which effectively target cancer cells by entrapped in tumor cell (Passive targeting) which increase EPR effect. Moreover, the Nanogel system can be applied to gain desired drug loading & release in specific site (4).
Thus, the present work is focused to develop a nanocarrier loaded gel to augment availability of drug at cancerous site.
MATERIALS AND METHODS
Materials
Imatinib Mesylate was acquired from Balaji Drugs, surat. PLGA, Carbopol 940 and Chloroform were procured from LOBA Chemicals. PVA was procured from Laboratory Sulab Reagent, Vadodara. Other laboratory grade materials were bought from an institutional supplier for the manufacturer of reagents and solutions.
Methods
Preparation of Imatinib Mesylate Nanoparticles by Solvent Evaporation method
Imatinib Nanoparticles (INPs) was prepared by emulsion solvent evaporation method. Briefly, PLGA and imatinib mesylate was dissolved in chloroform. This solution was added drop by drop to the aqueous phase containing PVA and homogenized at 18,000 RPM. After homogenization, the Nano-emulsion was stirred for 3 hours. The resulting emulsion was centrifuged at 20,000 rpm for 15 minutes to pellet down the nanoparticles. The pellet was washed three times with ultra-pure water to remove any free drug. Then, the pellet was freeze-dried and stored at 4°C until further use (5).
Optimization of IMT-nanoparticles using box behnken design
A Quality by Design (QbD) approach was employed to systematically optimize the formulation of Imatinib Mesylate-loaded PLGA nanoparticles using a Box–Behnken Design (BBD). Three critical material attributes (CMAs) were selected as independent variables: PLGA concentration (X₁, mg/mL), PVA concentration (X₂, % w/v), and organic phase volume (X₃, mL). Their effects were investigated on the critical quality attributes (CQAs), namely particle size (Y₁, nm), polydispersity index (PDI, Y₂), and entrapment efficiency (Y₃, %). A three-factor, three-level Box–Behnken experimental design comprising 17 runs, including five center points, was generated using Design-Expert® software to evaluate the individual, interaction, and quadratic effects of the formulation variables. The experimental responses were analyzed using regression analysis and analysis of variance (ANOVA) to establish statistically significant polynomial models. Response surface methodology (RSM) was employed to understand the relationship between the formulation variables and the responses, while numerical optimization was performed to identify the optimum formulation with minimum particle size and PDI and maximum entrapment efficiency. Finally, checkpoint analysis was carried out to validate the predictive accuracy of the optimized model, confirming the robustness, reproducibility, and reliability of the developed Imatinib Mesylate-loaded PLGA nanoparticle formulation for targeted drug delivery.
Evaluation of Imatinib Mesylate Nanoparticles
Particle Size, Shape, Encapsulation Efficiency, and Drug Content
Particle size distribution, mean particle size, and zeta potential of INPs will be determined in a Zetasizer by dynamic light scattering and laser Doppler anemometry (Zetasizer Nano ZS; Malvern Instruments, Malvern, UK). Briefly, 500 μg of INPs was suspended in 1 mL of deionized water. An electric field of 150 mV was applied to observe the electrophoretic velocity of the particles. All measurements were made at room temperature (6).
The content of imatinib mesylate in INPs was measured by spectrophotometric assay. Briefly, 10 mg INPs was dissolved in 1 mL of dichloromethane and 2 mL phosphate-buffered saline (PBS). The solution was centrifuged at 10,000 rpm, and the supernatant was collected. Absorbance at 265 nm was read in a spectrophotometer (Shimadzu UV-1700) using PBS as a blank to determine the drug content from a standard graph (7). The percentage of encapsulation efficiency (EE%) and drug content (DC%) of INPs was determined using the following two formulas:
EE%=Weight of encapsulated drugWeight of drug used ×100

DC%=Weight of encapsulated drugWeight of Nanoparticles ×100

Scanning Electron Microscopy (SEM)
Scanning electron microscopy (SEM) characterized the INPs morphologically. Samples were prepared by dropping INP onto aluminum stubs and allowing them to air-dry. The air-dried particles were coated with gold in vacuum using a Fiscon Instrument SC 502 sputter coater and then observed under the SEM (Leica Cambridge S 360; Leica Microsystems, Wetzlar, Germany) (8).
In Vitro Drug Release of Nanoparticles
The in vitro drug release of INPs was carried out using the previously described method with some modifications. Briefly, 10 mg of INPs was suspended in 2 mL PBS and transferred into a dialysis bag. The dialysis bag was then placed into a 100 mL bottle containing 50 mL PBS and was stirred at 100 rpm at 37°C. While stirring, 1 mL PBS sample was withdrawn at different time points from the bottle for 10 days. To maintain the volume, 1 mL PBS was added to the bottle after each withdrawal (9). Drug content of each sample was measured spectrophotometrically, as mentioned in the “Particle size, shape, encapsulation efficiency, and drug content” section.
% Entrapment Efficiency (%EE)
EE% was determined by centrifuging 1 mL of formulation (21,000 rpm, 1 h) to pellet vesicles. The free drug in the supernatant was diluted in Simulated Lung Fluid (pH 7.4) and quantified via UV-Vis spectroscopy (10). EE% was calculated as:
%EE=Amount of total drug - Amount of free drug in supernantAmount of total drug×100

High EE% ensures accurate dosing, maximized therapeutic efficacy, and minimized off-target effects.
Preparation of Nanogel by Incorporation of Nanoparticles of Imatinib Mesylate
On the basis of Box–Behnken design (BBD) approach, the optimized nanosuspension batch (NANOGEL) will be selected for further formulation of nanogel. The nanogel was prepared using Carbopol-934. Briefly, required amount of Carbopol-934 (2 % w/v) was added into nanosuspension (NANOGEL) and pH was adjusted using triethanolamine with gentle stirring. It allows to stand for 30 min to complete humectation of polymer chains. Similarly, the gel containing unprocessed IMT was also prepared. Prepared IMT-Gel and Nanogel were subjected for various quality control tests viz. Gel viscosity study, Drug content, pH, Spreadability, In-vitro drug diffusion studies, Ex- vivo drug diffusion studies (11) (12).
Evaluation of Gel
Gel Viscosity Study
The rheological property of prepared gel formulations was evaluated by determining the viscosity. Viscosity was measured using Brookfield viscometer equipped with Spindle 64 at 25 °C. (LV-DV III, Brookfield Engineering Laboratory, Incorporation, Middleboro) (13).
Drug Content
The prepared gel formulations were analyzed for drug content by transferring 1 gm of formulation in 100 mL volumetric flask. In this volumetric flask, 50 mL methanol was added, followed by continuous shaking until the gel was totally dispersed to give a clear solution. Final volume was adjusted to 100 ml with the help of methanol. Drug concentration of solution was determined spectrophotometrically at 315 nm using UV‑Visible spectrophotometer (Shimadzu 1800, Japan) (14).
pH Measurement
The pH of Nanogel was measured by using a digital pH meter which was calibrated before use with the standard buffer solutions of pH 4 and 7.1 g of gel was dissolved in 100ml of distilled water and stored for 2 h. The measurement of pH of IMT nanogel was done in triplicate and average values were calculated.(15)
Spreadability
The Spreadability of nanogel as determined by placing 0.5 g of respective gel within a circle of diameter 1 cm, pre-marked on a glass plate over which a second glass plate was placed. A weight of 500 g was allowed to rest on the upper glass plate for about 5 min.(15)
In-Vitro Drug Diffusion Studies
The In-vitro drug release study of Imatinib mesylate gel was determined using a Franz‑diffusion cell. The cellophane membrane was fixed on the receptor cell.(16) The donor cell was filled with 1 g of gel formulation. The receptor compartment was filled with 25mL of phosphate buffer pH 7.4 and constantly stirred with a small magnetic bar at a speed of 50 rpm during the experiments to confirm homogeneity. The 0.5 mL samples were withdrawn at scheduled time intervals (0, 15, 30, 45, 60, 90, 120, 180, 240, 300, 360 min) and were replaced with same volume of pH 7.4 phosphate buffer to maintain the sink condition. Samples were analyzed at 315 nm on UV‑visible spectrophotometer.(15)
Ex-Vivo Drug Diffusion Study
The ex-vivo drug diffusion study of gel was determined using a diffusion cell. In which dermatomed (500 μm thickness) pig’s ear skin (provided by a local slaughterhouse) was mounted between the donor and receptor compartments of vertical Franz-type diffusion cells with an effective permeation area of1.5 cm2. The The donor cell was filled with 1 g of gel formulation. The receptor compartment was filled with 25 mL of phosphate buffer pH 7.4 and constantly stirred with a small magnetic bar at a speed of 50 rpm during the experiments to confirm homogeneity, The 0.5 mL samples were withdrawn at scheduled time intervals (0, 15, 30, 45, 60, 90, 120, 180, 240, 300, 360 min) and were replaced with same volume of pH 7.4 phosphate buffer to maintain the sink condition. Samples were analyzed at 315 nm on UV‑visible spectrophotometer.(15, 17)
Stability Studies
The Imatinib mesylate loaded Nanoparticle incorporated gel optimized formulation (NANOGEL) was subjected for stability evaluation as per ICH guideline. It was evaluated at different temperatures and relative humidity such 25 ± 2 °C / 60 ± 5 % RH and 40 ± 2°C / 75 ± 5 % RH for 1 month. The evaluation parameters were pH, viscosity Spreadability and Assay.(18-20)
RESULT AND DISCUSSION
Formulation of IMT-nanoparticles using box behnken design
Based on the Preliminary Trails a Box-Behnken Design (BBD) was applied to optimize the formulation of an imatinib mesylate-loaded nanoparticles by evaluating the effects of three independent variables on the dependent variable.
Table 1 Results for BBD Design for Optimized Batch
|
Coded |
Run |
Independent Variable |
Dependent variable |
||||
|
PLGA Conc. (mg/mL) |
PVA Conc. (%) |
Org. Phase value (mL) |
Particle size (nm) |
PDI |
EE (%) |
||
|
X1 |
X2 |
X3 |
Y1 |
Y2 |
Y3 |
||
|
OBIN 1 |
1 |
150 |
1 |
4 |
448.3 |
0.523 |
55.27 |
|
OBIN 2 |
2 |
50 |
1.5 |
6 |
257.4 |
0.501 |
59.63 |
|
OBIN 3 |
3 |
50 |
1 |
4 |
242.5 |
0.623 |
38.72 |
|
OBIN 4 |
4 |
150 |
1.5 |
6 |
456.4 |
0.412 |
71.58 |
|
OBIN 5 |
5 |
100 |
1 |
6 |
234.3 |
0.123 |
68.17 |
|
OBIN 6 |
6 |
100 |
1 |
6 |
229.6 |
0.134 |
67.82 |
|
OBIN 7 |
7 |
50 |
0.5 |
6 |
342.3 |
0.612 |
45.36 |
|
OBIN 8 |
8 |
150 |
0.5 |
6 |
526.8 |
0.578 |
64.12 |
|
OBIN 9 |
9 |
150 |
1 |
8 |
417.2 |
0.434 |
66.51 |
|
OBIN 10 |
10 |
100 |
0.5 |
4 |
559.4 |
0.676 |
51.48 |
|
OBIN 11 |
11 |
100 |
0.5 |
8 |
521.7 |
0.535 |
59.79 |
|
OBIN 12 |
12 |
100 |
1 |
6 |
232.6 |
0.156 |
65.77 |
|
OBIN 13 |
13 |
50 |
1 |
8 |
223.7 |
0.523 |
50.93 |
|
OBIN 14 |
14 |
100 |
1 |
6 |
239.5 |
0.123 |
66.41 |
|
OBIN 15 |
15 |
100 |
1.5 |
4 |
482.6 |
0.534 |
57.69 |
|
OBIN 16 |
16 |
100 |
1.5 |
8 |
458.6 |
0.478 |
71.28 |
Model fitting and regression analysis
The Imatinib-loaded PLGA nanoparticle was optimized using Box- Behnken design and response surface methodology. ANOVA and F-test analyses confirmed that the independent variables had a significant impact on all response outcomes, as indicated by low p-values (p < 0.05) and high F-values. These results demonstrated a strong correlation between experimental and predicted values. The high R², along with close alignment between adjusted and predicted R² values, further validated the model’s accuracy and reliability. To streamline the models, statistically non-significant terms were removed, resulting in simplified reduced regression equations. These reduced models maintained strong predictive power while improving clarity and efficiency. They will be used for further optimization and interpretation of formulation responses.
Table 2 ANOVA Summary and Model Reduction Analysis for Selected Responses
|
Model parameter |
Y1:PS |
Y2: PDI |
Y3:EE |
|||
|
Full model |
Reduced model |
Full model |
Reduced model |
Full model |
Reduced model |
|
|
df |
9 |
6 |
9 |
6 |
9 |
7 |
|
F-value |
1255.68 |
1372.79 |
179.28 |
176.73 |
136.62 |
217.97 |
|
P- value (model) |
<0.0001 |
<0.0001 |
<0.0001 |
<0.0001 |
< 0.0001 |
< 0.0001 |
|
R2 |
0.9995 |
0.9989 |
0.9963 |
0.9916 |
0.9951 |
0.9948 |
|
No.of term omitted |
3 |
3 |
2 |
|||
|
SSE |
129.92 |
267.22 |
0.002 |
0.0046 |
6.75 |
1382.75 |
|
MSE |
21.65 |
29.69 |
0.0003 |
0.005 |
1.12 |
197.54 |
|
P -value (lack of fit) |
0.2916 |
0.2233 |
0.9037 |
|||
|
Fcalculated |
1264.636 |
176.73 |
217.97 |
|||
|
Fcritical(Ɑ=0.05) |
3.32 |
3.37 |
3.50 |
|||
|
Fcalculated is always greater than Fcritical confirming the statistical significance of the models and the impact of the factors on the responses. |
||||||
All models (full and reduced) are highly significant, with Fcalculated > Fcritical and p-values <0.0001 for the models. The models have high R² values (ranging from 0.9916 to 0.9995), showing they explain most of the variation in the responses. The lack of fit tests show that the models are a good fit for the data. The reduced models are simpler but still provide reliable predictions with only minor reductions in model fit compared to the full models. This analysis suggests that the factors involved in the formulation significantly influence the responses, and the models can be used confidently for optimization.
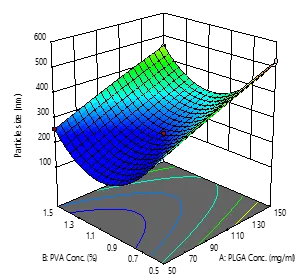
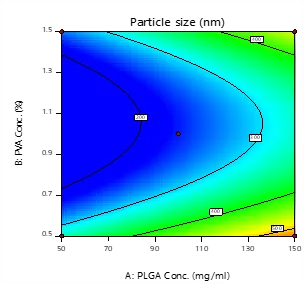
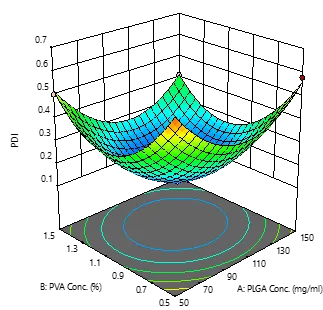
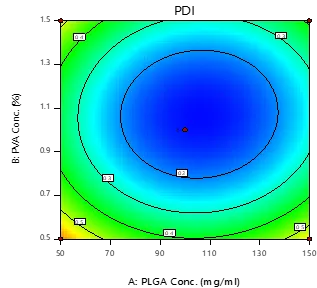
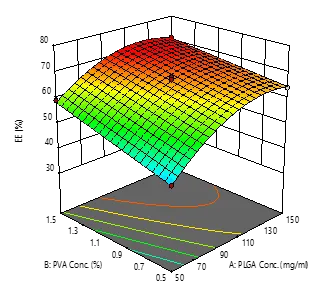
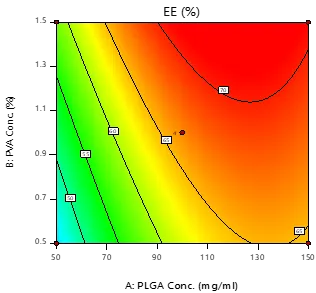
Nonetheless, since both interaction and quadratic terms are crucial, interpreting the equations in isolation could be misleading. Consequently, contour and 3D surface plots were created, which uncovered nonlinear relationships between the variables and responses. These graphical representations assisted in defining the optimal design space and offered a more comprehensive understanding of how variables affect formulation outcomes.
|
|
|
|
|
|
Figure 1 Contour Plots and 3D surface plots for Response Y1, Y2 & Y3
The predicted versus actual plots for particle size (Y₁), polydispersity index (Y₂), and entrapment efficiency (Y₃) collectively demonstrate the excellent predictive performance of the Box–Behnken Design model. In all three plots, the experimental observations closely align with the predicted values, indicating minimal residual error and the absence of systematic bias. The high degree of correlation between predicted and observed responses confirms the adequacy, accuracy, and robustness of the developed regression models. These results validate the suitability of the QbD-based optimization approach for the development of Imatinib Mesylate-loaded PLGA nanoparticles, ensuring reliable prediction of the critical quality attributes and supporting the selection of an optimized formulation for further characterization.
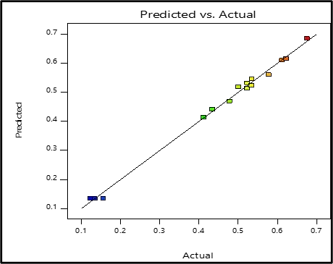
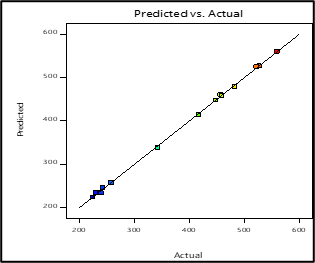
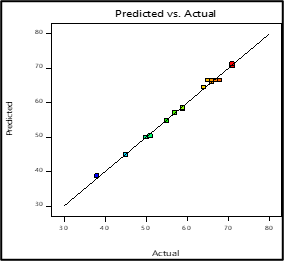
Figure 2 Predicted vs Actual Plot for response Y1, Y2 & Y3
Checkpoint analysis and formulation optimization
The Design of Experiments (DoE) approach was used to evaluate checkpoint of two batches to identify the one with the highest desirability score. Among them, Batch OBIN-2 demonstrated a desirability value of 1 and exhibited the lowest percentage error when compared to OBIN 1. Due to its superior predictive accuracy and performance, OBIN 2 was selected as the final optimized formulation. This batch was subsequently designated as OBIN-IMT-NP and considered the optimized batch for further formulation and evaluation.
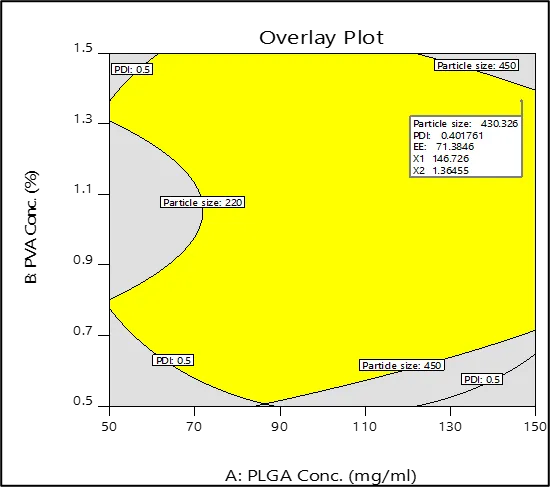
Figure 3 Overlay Plot
Table 3 Checkpoint analysis and optimized batch
|
Batch code |
Factor value |
Desir-ability |
Predicted value |
Experimental value* |
% Error |
||||||
|
PS (nm) |
PDI |
EE (%) |
PS (nm) |
PDI |
EE (%) |
PS (nm) |
PDI |
EE (%) |
|||
|
OBIN 1 |
X1= 146.72, X2=1.36, X3= 7.5 |
1 |
430.368 |
0.402 |
68.27 |
472.5 |
0.426 |
71.384 |
9.40 |
5.90 |
4.50 |
|
OBIN 2 |
X1=125.38, X2=1.39, X3= 7.0 |
1 |
224.6 |
0.197 |
69.24 |
234.5 |
0.204 |
71.58 |
4.45 |
3.52 |
3.37 |
|
*All values are mean ± SD (n = 3 |
|||||||||||
Characterization of Optimized Imatinib Mesylate Loaded Nanoparticles
Particle Size and Polydispersity Index (PDI)
An average particle size of 234.5 nm and a polydispersity index (PDI) of 0.204 were observed for the optimized formulation. These findings support the formulation results and affirm that OBIN-IMT-NP was successfully created with a suitable size distribution.
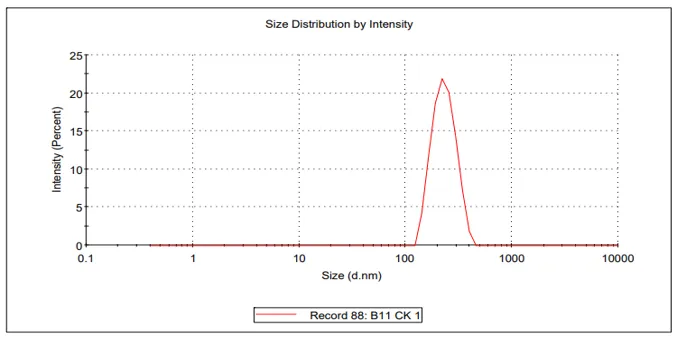
Figure 4 Particle size and PDI of optimized nanoparticle
Scanning Electron Microscopy (SEM) of IMT-Nanoparticles
SEM analysis was conducted to examine the size, shape, and surface characteristics of the optimized imatinib-loaded nanoparticles (IMT-NP). The nanoparticles appeared uniformly dispersed, spherical in shape, smooth-surfaced, and nonporous. These morphological features indicate effective formulation and structural integrity. Additionally, the particle size observed via SEM closely matched the values, confirming the accuracy and consistency of the particle size analysis.
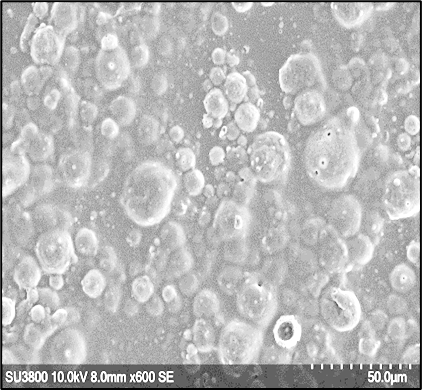
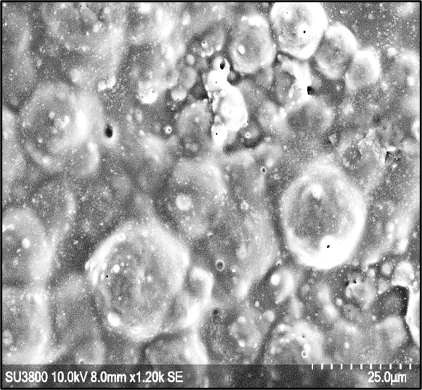
Figure 5 SEM image of IMT loaded Nanoparticles
Evaluation of Optimized Nanogel
Viscosity of nanogel
The average viscosity of IMT nanogel was observed 1904.07 ± 3.28 indicate good reproducibility and uniformity in the formulations compare to the IMT gel.
Drug Content of Optimized Nanogel
The Drug content of Optimized Nanogel is performed using UV-Visible spectrophotometer. IMT Gel compare to IMT nanogel showed an average drug content of 95.86% ± 0.71 and 99.26% ± 0.94.
pH measurement
The pH of the IMT-NPs loaded nanogel was measured using a calibrated digital pH meter at room temperature. The Gel showed a pH value of 7.19 ± 0.014, which is within the acceptable range for topical application and is considered non-irritant to the skin.
Spreadability Study
The IMT nanogel exhibited good average spreadability 28.0 ± 0.29, indicating ease of application and suitability for topical delivery.
In-Vitro drug Release study
The IMT gel showed a gradual increase in drug release from 2.59 ± 0.52% to 32.95 ± 3.56%, whereas the IMT nanogel showed significantly higher release, increasing from 7.58 ± 0.63% to 99.72 ± 6.20% over 360 min. The enhanced release from the nanogel may be attributed to its smaller particle size, increased surface area, and improved drug dispersion, which facilitate faster dissolution and diffusion of the drug.
Table 4 Results of in-vitro drug release study of optimized nanogel
|
Time(min) |
% CDR |
|
|
IMT Gel |
IMT Nanogel |
|
|
Mean ± SD |
Mean ± SD |
|
|
10 |
2.59±0.52 |
7.58±0.63 |
|
30 |
6.60±0.92 |
19.90±2.25 |
|
60 |
9.25±1.40 |
28.74±2.76 |
|
90 |
12.80±1.17 |
37.51±6.41 |
|
120 |
17.05±2.32 |
51.77±7.87 |
|
180 |
22.11±1.37 |
67.72±11.25 |
|
240 |
26.50±3.51 |
81.11±5.07 |
|
300 |
28.83±1.33 |
88.24±7.70 |
|
360 |
32.95±3.56 |
99.72±6.20 |
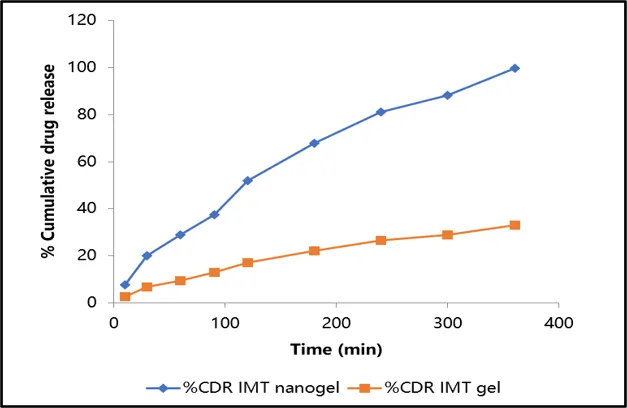
Figure 6 Cumulative drug release study of IMT gel and IMT Nanogel
Release Kinetics of IMT Nanogel
The release kinetics study showed that the drug release from both IMT gel and IMT nanogel followed different mathematical models with varying degrees of correlation. For IMT gel, the highest correlation coefficient was observed for the Korsmeyer–Peppas model (R² = 0.976), with an n value of 0.672, indicating anomalous (non-Fickian) drug release involving both diffusion and polymer relaxation/erosion mechanisms. Similarly, the IMT nanogel showed the highest R² for the Korsmeyer–Peppas model (R² = 0.972), with an n value of 0.664, suggesting a comparable non-Fickian release mechanism. The results indicate that drug release from both formulations was predominantly governed by a combination of diffusion and polymer relaxation/erosion mechanisms.
Table 5 Result of Release kinetic study
|
Batch |
Zero order |
First order |
Higuch |
K-P |
H-C |
|
|
R2 |
R2 |
R2 |
R2 |
n |
R2 |
|
|
In-vitro |
||||||
|
IMT-gel |
0.892 |
0.931 |
0.936 |
0.976 |
0.672 |
0.881 |
|
IMT-Nanogel |
0.874 |
0.955 |
0.935 |
0.972 |
0.664 |
0.968 |
Stability study of optimized IMT nanogel
The stability study indicated that the formulation remained stable under accelerated conditions of 40 ± 2°C/75 ± 5% RH, with no significant changes in its evaluated parameters. The pH was maintained at 7.14 ± 0.04, while viscosity and spreadability were 1852 ± 2.23 and 27.67 ± 0.02, respectively. The similarity factor (f₂) of 74.74 (>50) indicated a high degree of similarity between the freshly prepared and stability-tested formulation, suggesting that the formulation maintained its physicochemical characteristics during storage. The dissolution profiles of the reference and test formulations showed a comparable and progressive increase in drug release with time. The test formulation exhibited slightly higher drug release during most of the initial and intermediate time points, while both formulations approached nearly complete drug release at 360 min (≈99%). The close overlap between the two dissolution curves, along with the relatively small standard deviations, indicates good reproducibility and similarity in drug release behavior between the test and reference formulations.
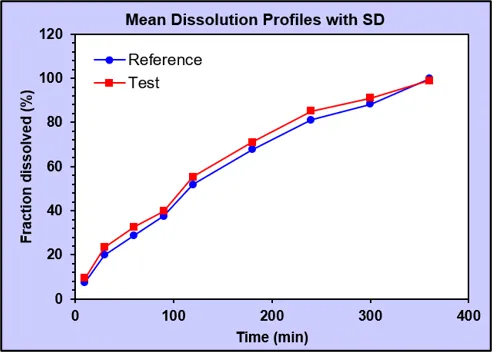
Figure 7 Stability study of optimized nanogel
Table 6 Results of different parameter for stability study
|
Parameters |
Freshly prepared mean ± SD 40± 2°C/75±5% RH |
|
pH |
7.14 ± 0.04 |
|
Viscosity |
1852 ± 2.23 |
|
Spredebility |
27.67 ± 0.02 |
|
n = 3 |
|
|
Similarity fator = 74.74 |
|
CONCLUSION
The present study successfully established a Quality by Design-based approach for developing an imatinib mesylate-loaded PLGA nanoparticle-incorporated topical nanogel for localized delivery in dermatofibrosarcoma protuberans. The optimized nanoparticles demonstrated a particle size of 234.5 nm, PDI of 0.204, and entrapment efficiency of 71.58%, with SEM confirming a uniform spherical morphology. Incorporation into Carbopol nanogel provided suitable topical properties and significantly enhanced drug release, achieving 99.72% release within 360 min compared with 32.95% from conventional imatinib gel. The Korsmeyer–Peppas model indicated a combined diffusion and polymer relaxation/erosion mechanism, while stability studies demonstrated satisfactory physicochemical stability with an f₂ value of 74.74. Overall, the findings support PLGA nanoparticle-based nanogel as a promising strategy for improving the local delivery of imatinib mesylate; however, ex vivo permeation, skin retention, pharmacokinetic, pharmacodynamic, and in vivo efficacy studies are required to confirm its therapeutic potential in DFSP.
CONFLICT OF INTEREST
The authors disclose that they have no conflicting financial interests.
ACKNOWLEDGEMENT
Authors would like to thank Dr. Vineet C. Jain and Bhagwan Mahavir college of Pharmacy for offering research facility that is required in this study.
REFERENCES

Chetan Bhagat, Dr. Ronak Dedania, Design, Optimization, and Characterization of Hyaluronic Acid-Conjugated Nanoparticle loaded Gel of Imatinib Mesylate for Targeted Delivery in Dermatofibrosarcoma Protuberans, Int. J. of Pharm. Sci., 2026, Vol 4, Issue 9, 399-411. https://doi.org/10.5281/zenodo.22260366
 10.5281/zenodo.22260366