

We use cookies to ensure our website works properly and to personalise your experience. Cookies policy
University Department of Chemical Technology, Dr. Babasaheb Ambedkar Marathwada University, Chhatrapati Sambhajinagar.
A simple, rapid, and economical UV-visible spectrophotometric method for estimation of kaempferol was developed and validated for estimation of kaempferol in bulk and marketed products. The kaempferol solution was scanned over UV range for determining maximum absorbance. The calibration curve of concentration vs. absorbance was plotted and linearity and range were calculated. The various method validation parameters such as accuracy, precision, & robustness were calculated using QC standards. The maximum absorbance of Kaempferol was found to be at 360 nm. The correlation coefficient over concentration range of 1-14 µg/mL was found to be 0.999. The intraday and inter-day accuracy was measured in terms of %RSD which is found to be in range of 0.47 to 1.76. The precision values show the percentage relative standard deviations in the range of 0.142 to 0.894 & 0.212 to 1.119 respectively. LOD and LOQ was found to be 0.22 and 0.69 µg/mL, respectively. ensuring adequate sensitivity for routine analysis. The proposed method was successfully used for the estimation of Kaempferol in the formulation
Kaempferol contain naturally occurring polyphenolic flavonoids which are commonly included in herbal and nutraceutical formulations [1-3]. Kaempferol has been extensively studied for its strong antioxidant, anti-inflammatory, and anticancer properties [4-7]. The molecular structure of the kaempferol is shown in Figure 1 [5]. Kaempferol has gained significantly attention in herbal, pharmaceutical, and nutraceutical products due to their notable therapeutic effects. Despite their pharmacological significance, few studies have validated a UV-visible spectrophotometric method for their quantification [6-8]. Although often combined in dietary supplements, a straightforward, cost-effective, and reproducible technique for their simultaneous analysis remains unavailable, especially in quality control labs. While methods like HPLC and LC-MS provide accuracy, they are costly, time-consuming, and require advanced equipment [9-13]. This research aims to develop a simple, reliable, and validated UV spectrophotometric method for measuring kaempferol in bulk [8]. Therefore, UV-visible spectrophotometry offers a rapid, economical, and user-friendly alternative for the simultaneous quantification of kaempferol in bulk drugs [13]. This study aims to fill this analytical gap and ensure that the proposed method meets international standards for accuracy, precision, linearity, and robustness, thereby strengthening quality assurance in herbal product manufacturing [14-15].
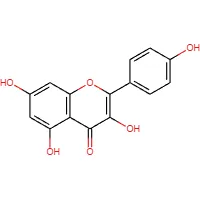
Fig. 1: Molecular Structure of Kaempferol
2.1 Instrumentation:
A pre-calibrated double-beam UV-Visible spectrophotometer (UV-530, Jasco), employed with Spectra Manager software, was used for method development. Quartz cuvettes with a 1 cm path and 3 cm length were used for spectral analysis. The analytical balance (Essae, Vibra HT) with an internal calibration system was used for weighing. An ultrasonic bath (PCI Analytics, India; 6.5 L capacity) was used for assisting the complete solubilisation of kaempferol.
2.2 Chemicals and Reagents:
Kaempferol was purchased from TCI Chemicals (India) Pvt. Ltd., Chennai. Acetonitrile was purchased from Merck. Deionized water was obtained from a water purification system (Lablink Xtrapure). For method development, all chemicals employed in the study were of at least analytical grade.
2.3 Preparation of Standard Solutions:
Accurately weighed 100 mg of kaempferol was transferred into a 100 mL volumetric flask and dissolved in 100 ml acetonitrile (Mother stock). Further, dilutions were prepared using co-solvent system comprising of acetonitrile and water in a 40:60 (v/v) ratio to achieve working standard solution of 100 μg/mL (Stock I). Stock-I was suitably diluted to achieve the kaempferol solution of 15 μg/mL strength (Stock II).
2.4 Determination of wavelength of maximum absorbance (λmax)
The wavelength of maximum absorbance (λmax) of Kaempferol was determined using a UV-Visible spectrophotometer. The spectrophotometer was set in the spectrum management mode. A working stock II solution (15 μg/mL) of kaempferol was scanned over the wavelength of 200 to 800 nm with medium scanning speed. The wavelength of maximum absorbance (λmax) was identified using the help of software settings. The scanning and λmax identification process was repeated three times to achieve the reproducible results.
2.5 Preparation of calibration curve:
Freshly prepared stock-II solution of kaempferol was diluted with co-solvent to achieve six calibration standards viz., CAL-STD-1 (1 μg/mL), CAL-STD-2 (2 μg/mL), CAL-STD-3 (4 μg/mL), CAL-STD-4 (8 μg/mL), CAL-STD-5 (12 μg/mL) and CAL-STD-6 (14 μg/mL). The spectrophotometer was set in Fixed Wavelength Measurement mode, and the absorbance of each calibration standard was measured at pre-identified wavelength of maximum absorption of 360 nm. The procedure was repeated thrice to ensure consistency of the results which were reported in terms of mean ± SD.
2.6 Validation of the Method:
The developed UV-visible spectrophotometric method for kaempferol was validated using the ICH Q2 (R1) guidelines [16]. The developed method was assessed for linearity, accuracy, precision, robustness, limit of detection (LOD), and limit of quantitation (LOQ).
2.6.1 Linearity & Range:
The linearity of the proposed UV Spectrophotometric method of kaempferol was evaluated using predefined six calibration standards, as mentioned in section 2.5. By using calibration curves of absorbance vs. concentration, the linear least squares regression analysis was carried out. The linearity of the proposed method was established by evaluating the correlation coefficient (r²), which states a linear relationship between absorbance and concentration. The range of the UV spectrophotometric method of kaempferol was defined by the lower and upper concentration limits over which acceptable linearity was consistently observed.
2.6.2 Accuracy:
The accuracy of the proposed UV-visible spectrophotometric method was established using quality control standards (QC-STD). Three distinct quality control standards of kaempferol, viz. QC-STD-1, QC-STD-2, and QC-STD-3 having nominal concentrations of 1.5 μg/mL, 7 μg/mL, and 13 μg/mL respectively, were prepared in triplicate and used for the proposed study. The QC-STD were analysed for its kaempferol content using the proposed UV-visible spectrophotometric method at three different time intervals in a day for three consecutive days. The intra-day and inter-day accuracy of the proposed method was established in terms of % difference, calculated using the following formula.
% Difference=Mean Measured Concentration- Nominal ConcentrationNominal Concentration×100

2.6.3 Precision:
Precision of the method was conducted to assess the reliability of the anticipated analysis process. The QC-STD as mentioned in section 2.6.2 were employed to determine precision of proposed method in terms of % relative standard deviation (RSD). The intra-day and inter-day precision was established by analysing the QC-STDs at three different time intervals during the day & the same procedure was repeated on three consecutive days. The precision of the method was established in terms of % RSD, calculated by following formula,
%RSD=StandardDeviation SDMean ×100

2.6.4 Robustness:
The robustness of the proposed UV method for Kaempferol was assessed by making a small deliberate change in the co-solvent mixture of acetonitrile and water. The acetonitrile: water ratio was adjusted to 38:62 v/v and 42:58 v/v to check whether such alterations affect the results. The three QC-STDs were analysed with above mentioned co-solvent ratio, and the mean standard deviation (SD) and percent relative standard deviation (%RSD) was calculated. The method was robust in case the % RSD values were within the acceptable limit of ≤ 2%.
2.6.5 Limit of Detection and Limit of Quantification:
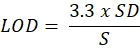
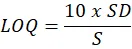
According to ICH guidelines, the limits of detection (LOD) and quantification (LOQ) for kaempferol was calculated based on standard deviation of the regression line and slope of the calibration curve, using the following formula.
LOD= 3.3 x SDS
LOQ=10 x SDS
Where,
SD = Standard deviation of Y-intercept
S = Slope of calibration curve
2.7 Estimation of Kaempferol in Marketed Formulation:
The proposed UV-visible spectrophotometric method was employed to quantify and estimate Kaempferol in marketed formulations to ensure the methods reliability for routine quality assessment of Kaempferol capsules. An amount equivalent to 50 mg of kaempferol was transferred in a 10 mL volumetric flask and dissolved in 10 ml of acetonitrile. The solution was subjected to ultrasonication for 10 minutes. Further, it was diluted at a 1:4 v/v ratio of cosolvent to achieve the desired theoretical concentration of 12 µg/mL. The kaempferol content was analysed using the pre-validated method and the percentage of the kaempferol in capsules was shown in terms of mean ± SD.
3.1 Determination of the wavelength:
For accurate quantitative analysis of Kaempferol by UV spectrophotometry, initially, the λmax of Kaempferol was established. When a 15 µg/mL solution of Kaempferol repeatedly scanned over the range of 200 to 800 nm showed the maximum absorbance at 360 nm which is evident in the figure 2.
|
360 nm |
Fig. 2: UV-Visible Spectra of Kaempferol
3.2 Preparation of calibration curve:
For precise quantification of Kaempferol using a UV-Visible Spectrophotometer, it is important to establish a relation between concentration and absorbance. An equation-based calibration method provides greater precision and acceptance compared to the graphical method. In the proposed method a calibration curve of Kaempferol was prepared using seven distinct calibration standards viz., 1 μg/mL, 2 μg/mL, 4 μg/mL, 8 μg/mL, 12 μg/mL, and 14 μg/mL. Each calibration standard was analysed three times for its absorbance at 360 nm in the fixed wavelength mode. The mean absorbance values were calculated with their corresponding standard deviations, and obtained data were used to construct the calibration curve. The calibration curve was subsequently employed as a standard reference for the quantification of Kaempferol in unknown samples for further analysis. Table 1 shows the mean absorbance values ± SD.
Table 1: Calibration standard data for Kaempferol
|
Concentration (μg/mL) |
Absorbance (Mean ± S.D.) |
|
1 |
0.0699 ± 0.0019 |
|
2 |
0.1394 ± 0.0035 |
|
4 |
0.2790 ± 0.0153 |
|
8 |
0.5609 ± 0.0107 |
|
12 |
0.8324 ± 0.0049 |
|
14 |
0.9645 ± 0.0197 |
(n=3)
3.3 Method validation:
After Development of analytical method, it becomes essential to validate the developed method. The Validation of said method ensured its reliability and sensitivity. The ICH Q2 (R1) guidelines were used to conduct validation of proposed method, which is extensively used by academics and industries worldwide. There are various parameters for analytical method validation. The set values and limits of these parameters, obtained within the range during validation demonstrate the authenticity and reliability of the analytical methods. For kaempferol, the developed method was validated using the following parameters.
3.3.1 Linearity and Range:
The linearity of the said method was assessed using six predefined calibration standards of Kaempferol over the concentration range of 1 to 14 μg/mL. The strong linear relation between concentration and absorbance was demonstrated by the regression analysis of calibration data with correlation coefficient (r²) values > 0.999. The three replicate calibration curves showed consistent values of slopes and intercepts, confirming the method’s linearity and range, as illustrated in Figure 3 (A-C). According to linearity analysis, the developed UV method was found to be linear over the pre-defined calibration standard concentration range.
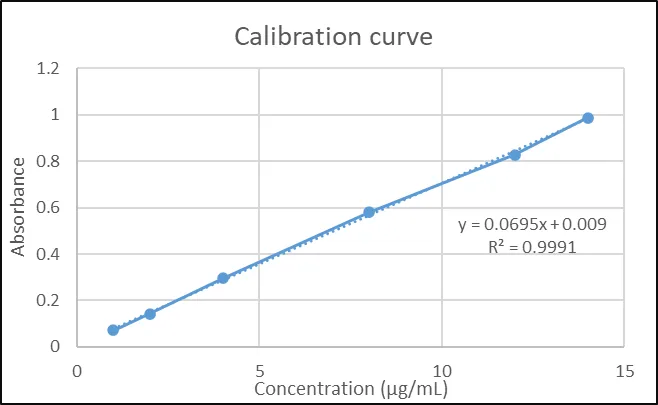
Fig. 3: (A) Calibration curve of kaempferol (Replicate 1)
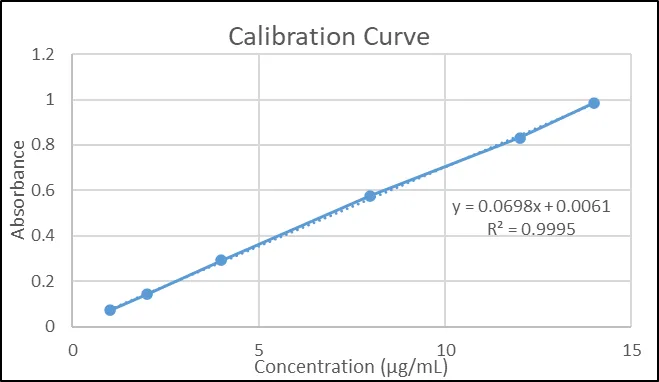
Fig. 3: (B) Calibration curve of kaempferol (Replicate 2)
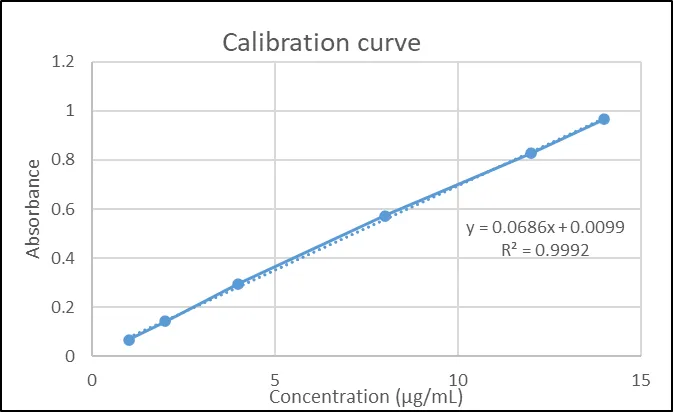
Fig. 3 (C) Calibration curve of kaempferol (Replicate 3)
3.3.2 Accuracy:
Accuracy refers to how closely the experimental value matches the nominal reference value. To ensure reliable results throughout the entire calibration range of the analytical method, accuracy must be maintained at every determination stage of the process. The intraday and inter-day percentage difference values are presented in Tables 2 and 3, respectively. The intra-day accuracy expressed in terms of % difference was found to be in range of 0.47 to 1.76, whereas inter-day accuracy ranged from 0.68 to 1.63. Based on these values, it was concluded that the proposed UV-Visible spectrophotometric method for kaempferol was accurate.
Table 2: Intra-day accuracy data of the UV method for Kaempferol
|
Concentration Level |
Nominal Concentration (μg/mL) |
Mean Measured Concentration (μg/mL) |
% Difference |
|
LQC |
1.5 |
1.5135 |
0.90 |
|
1.5 |
1.5264 |
1.76 |
|
|
1.5 |
1.5220 |
1.46 |
|
|
MQC |
7 |
7.1177 |
1.68 |
|
7 |
7.0546 |
0.78 |
|
|
7 |
7.0496 |
0.70 |
|
|
HQC |
13 |
13.092 |
0.70 |
|
13 |
13.135 |
1.03 |
|
|
13 |
13.062 |
0.47 |
Table 3: Inter-day Accuracy data of the UV method for Kaempferol
|
Concentration Level |
Nominal Concentration (μg/mL) |
Mean Measured Concentration (μg/mL) |
% Difference |
|
LQC |
1.5 |
1.5226 |
1.50 |
|
1.5 |
1.5149 |
0.99 |
|
|
1.5 |
1.5245 |
1.63 |
|
|
MQC |
7 |
7.0658 |
0.93 |
|
7 |
7.088 |
1.25 |
|
|
7 |
7.0681 |
0.97 |
|
|
HQC |
13 |
13.088 |
0.68 |
|
13 |
13.088 |
0.68 |
|
|
13 |
13.112 |
0.86 |
3.3.3 Precision:
Precision refers to the degree of scatter among repeated measurements, indicating how consistently the results are obtained. In the proposed study intra-day and inter-day precision of the developed UV methods was determined using three QC levels: 1.5 μg/mL, 7 μg/mL, and 13 μg/mL of kaempferol. Tables 4 and 5 present the % RSD values for intra-day and inter-day precision. Intra-day precision, expressed in terms of % RSD, and found to be in the range 0.14 to 0.89, whereas inter-day precision was found to be in the range 0.21 to 1.11. The lower % RSD values indicate the precision of the proposed analytical method for kaempferol. The results confirm the developed method provides reproducible quantitative analysis of Kaempferol.
Table 4: Intra-day precision data of the UV method for Kaempferol
|
|
Morning |
Afternoon |
Evening |
||||||
|
Conc Range (μg/mL) |
Mean |
SD |
%RSD |
Mean |
SD |
%RSD |
Mean |
SD |
%RSD |
|
1.5 |
1.514 |
0.004 |
0.273 |
1.526 |
0.014 |
0.894 |
1.522 |
0.01 |
0.643 |
|
7 |
7.118 |
0.031 |
0.439 |
7.055 |
0.01 |
0.142 |
7.05 |
0.016 |
0.226 |
|
13 |
13.09 |
0.067 |
0.513 |
13.13 |
0.034 |
0.26 |
13.1 |
0.036 |
0.279 |
Table 5: Inter-day precision data of the UV method for Kaempferol
|
|
Morning |
Afternoon |
Evening |
||||||
|
Conc. Range (μg/mL) |
Mean |
SD |
%RSD |
Mean |
SD |
%RSD |
Mean |
SD |
%RSD |
|
1.5 |
1.5226 |
0.017 |
1.1196 |
1.5148 |
0.013 |
0.8654 |
1.5244 |
0.0139 |
0.9178 |
|
7 |
7.065 |
0.047 |
0.666 |
7.087 |
0.063 |
0.893 |
7.068 |
0.057 |
0.820 |
|
13 |
13.088 |
0.089 |
0.684 |
13.088 |
0.0277 |
0.2122 |
13.11 |
0.095 |
0.728 |
3.3.4 Robustness:
The robustness of the proposed method for Kaempferol was evaluated by making the deliberate changes in concentration of co-solvent system (acetonitrile: water in ratio of 38:62 v/v and 42:58 v/v). By these optimized parameters, absorbance values were Kaempferol solutions of strength 1.5 μg/mL, 7 μg/mL, and 13 μg/mL, which showed low % RSD values when tested in triplicate (Table 7). All calculated % RSD values remained within the acceptable limit of ≤ 2. The consistent low % RSD values indicated that the proposed UV method for kaempferol is robust and remains reliable under deliberate changes.
Table 6: Robustness data of the UV method for Kaempferol
|
Conc. (μg/mL) |
Acetonitrile: Water (V/V) |
Absorbance (Mean ±SD) |
%RSD |
|
1.5 |
38:62 |
0.1028 ± 0.0010 |
1.0248 |
|
7 |
0.5084 ± 0.0006 |
0.1180 |
|
|
13 |
0.9361 ± 0.0011 |
0.1191 |
|
|
1.5 |
42:58 |
0.1188 ± 0.0021 |
1.7976 |
|
7 |
0.5219 ± 0.0068 |
1.3191 |
|
|
13 |
0.9671 ± 0.0138 |
1.4323 |
3.3.5 Limit of Quantification and Limit of Detection
The lowest concentration that can be measured with reasonable precision and accuracy is represented by LOQ. Table 7 presents the LOD and LOQ of the proposed UV method, which were determined to be 0.22 and 0.69 μg/mL respectively.
Table 7: LOD and LOQ data of the UV method for Kaempferol
|
Parameter |
Values |
|
LOD |
0.22 μg/mL |
|
LOQ |
0.69 μg/mL |
The Proposed analytical method was developed and validated for routine analysis. Before it can be employed regularly, its ability to analyse routine samples needs to be established. The proposed method for kaempferol was used to analyse a marketed formulation. Results from the analysis are presented in Table 8. The method accurately estimated the kaempferol content in the marketed product with satisfactory precision.
Table 8: Kaempferol content in the marketed formulation
|
Sr. |
Formulation |
Brand Name |
%Label claim of Kaempferol |
% Assay of Kaempferol (Mean S.D) N=3 |
|
1 |
Capsule |
Zyrex Herbal |
98% |
96.07 ± 0.6297 |
CONCLUSION
A precise and sensitive UV-Visible spectrophotometric method for kaempferol was developed and validated. The proposed UV-Visible spectrophotometric method showed excellent linearity, accuracy, precision, and robustness in accordance with ICH guidelines. The low LOD & LOQ values confirmed its sensitivity. Results from testing commercial capsules closely matched with label claims, making the proposed UV-Visible spectrophotometric method suitable for routine quality control testing.
REFERENCES


Vaibhav Dande, Sachin Bhusari, Pravin Wakte, Development and Validation of an Analytical Method for Kaempferol Using UV-Vis Spectrophotometry, Int. J. of Pharm. Sci., 2026, Vol 4, Issue 8, 4752-4762, https://doi.org/10.5281/zenodo.22145137
 10.5281/zenodo.22145137