

We use cookies to ensure our website works properly and to personalise your experience. Cookies policy
Department of Pharmaceutics, Shree Santkrupa College of Pharmacy, SUK- Ghogaon - Karad, Maharashtra, India-41511.
Fungal infections are commonly observed skin disorders caused mainly by dermatophytes affecting the skin, hair, and nails. These infections often lead to itching, irritation, inflammation, and discomfort, thereby reducing the quality of life. Conventional topical antifungal preparations show limitations such as poor skin penetration, low retention time, and the requirement for repeated application. The outermost layer of skin, known as the stratum corneum, acts as a major barrier that restricts effective drug delivery. To overcome these limitations, advanced topical delivery systems have gained importance in modern pharmaceutical research. Nanoemulsion-based formulations improve drug solubility, stability, and penetration through the skin due to their nanosized droplets and enhanced surface area. Incorporation of nanoemulsion into gel systems results in nanoemulgel formulations with better viscosity, spreadability, and prolonged skin retention. These systems provide controlled drug release and improved therapeutic effectiveness with better patient compliance. Liranaftate, a potent antifungal agent, shows effective activity against dermatophyte infections through inhibition of fungal cell membrane synthesis. Enhanced topical delivery of antifungal agents using nanoemulgel systems offers promising results for safer, targeted, and more efficient management of fungal skin infections.
Dermatophyte infections, commonly known as dermatophytosis or tinea infections, represent the most frequent form of superficial fungal infections worldwide. These infections are characterized by colonization of the stratum corneum and keratinized appendages due to the ability of dermatophytes to utilize keratin as a nutrient source. Based on the depth of invasion, fungal infections are commonly classified into superficial, cutaneous, subcutaneous, and systemic infections. Superficial and cutaneous infections primarily affect keratinized tissues such as skin, hair, and nails, while systemic infections involve internal organs and may become life-threatening, particularly in immunocompromised individuals.1, 4
MATERIALS AND METHODS
MATERIALS:
The chemicals and excipients used in the formulation were procured from different suppliers. Liranaftate was obtained from Tokyo Chemical Industry, Japan. Almond oil, Tween 80, propylene glycol, methyl paraben, and BHT were procured from Loba Chemicals, Mumbai. Propyl paraben was purchased from Fine Chemicals, Mumbai, while Carbopol was obtained from Molychem. These chemicals and excipients were used for their respective functions in the formulation, such as oil phase formation, surfactant and cosurfactant activity, preservation, antioxidant activity, and gel formation.
METHODS
2.2.1 Preformulation studies:
The systematic development of a pharmaceutical dosage form begins with a detailed understanding of the drug substance and its interaction with excipients. This stage provides essential information regarding the physicochemical, mechanical, and biological characteristics of the active pharmaceutical ingredient and formulation components. Such investigations are highly important in the development of liranaftate-loaded nanoemulgel formulations because they assist in selecting suitable excipients, improving drug stability, and enhancing formulation performance. Knowledge of the drug’s solubility behavior, compatibility with formulation ingredients, and stability under different environmental conditions helps in designing an effective. Therefore, detailed characterization of the drug and excipients forms the scientific basis for the successful development of stable and patient-compliant topical nanoemulgel formulations containing liranaftate1, 2.
2.2.1.1Organoleptic Properties:
The initial phase of formulation development involves characterization of the drug substance by evaluating its physical properties such as colour, odor, appearance, and physical state.
Physical appearance:
2.2.1.2 Melting point:
The melting point of liranaftate was determined by the capillary fusion method using a digital melting point apparatus. A small quantity of the finely powdered drug was filled into a sealed capillary tube and placed in the melting point device. The sample was heated gradually, and the temperature at which the drug started melting and completely liquefied was carefully recorded. Determination of melting point is important for assessing the purity and identity of the drug substance and also provides information regarding its thermal behavior during formulation development3.
2.2.1.3Solubility:
The solubility of liranaftate was determined in different solvents such as methanol, chloroform, almond oil, Tween 80, and propylene glycol for the selection of suitable formulation components. An excess amount of drug was added separately into test tubes containing 10 mL of each solvent, followed by mixing using a vortex mixer and water bath shaker until a uniform solution was obtained4.
2.2.1.4UV-Visible spectrophotometry:
Preparation of Stock Solution of Liranaftate
A standard stock solution of liranaftate was prepared by accurately weighing the required quantity of drug and dissolving it in methanol to obtain a clear solution of known concentration. The solution was mixed thoroughly to ensure complete dissolution of the drug.
Determination of Maximum Absorption Wavelength (λmax) of Liranaftate
The prepared stock solution was suitably diluted with methanol and scanned using a UV–Visible spectrophotometer over an appropriate wavelength range to determine the
wavelength of maximum absorbance (λmax) of liranaftate. The wavelength showing highest absorbance was selected for further analytical studies.
Preparation of Standard Calibration Curve of Liranaftate
From the stock solution, a series of diluted solutions containing different concentrations of liranaftate were prepared using methanol. The absorbance of each solution was measured at the determined λmax using a UV–Visible spectrophotometer. A calibration curve was constructed by plotting concentration versus absorbance, and the linearity of the method was evaluated5, 6.
2.2.1.5 Fourier Transform Infrared spectroscopy (FTIR):
Fourier Transform Infrared Spectroscopy (FTIR) was employed to evaluate the compatibility between liranaftate and the selected excipients used in the nanoemulgel formulation. This analytical technique helps in identifying possible interactions by examining the characteristic functional groups and absorption patterns of the drug and formulation components. The infrared spectra of pure liranaftate, individual excipients such as oils, surfactants, and polymers, as well as the optimized formulation, were recorded using a BRUKER Alpha-II FTIR spectrophotometer. Samples were prepared by the potassium bromide (KBr) pellet method, in which finely powdered samples were blended with dry KBr and compressed into transparent discs using a hydraulic press under suitable pressure. The spectra were obtained over a wavenumber range of 4000–500 cm⁻¹ to identify any significant changes in characteristic peaks, indicating compatibility or interaction between the drug and excipients7, 8.
2.2.1.6 Differential Scanning Calorimetry (DSC)
Differential Scanning Calorimetry (DSC) analysis was carried out to investigate the thermal characteristics of liranaftate and to identify any possible interaction between the drug and formulation excipients. Accurately weighed samples of pure drug, individual excipients, and the optimized nanoemulgel formulation were placed separately in sealed aluminium pans. The analysis was performed using a HITACHI STA 7300 thermal analyzer over a temperature range of 10°C to 350°C at a constant heating rate of 20°C/min under a nitrogen atmosphere maintained at an appropriate
flow rate. The obtained thermograms were examined for changes in melting endotherms, peak shifts, or disappearance of characteristic peaks, which could indicate compatibility or interaction between formulation components9, 10.
2.2.1.7 Drug–Excipient Compatibility Study
A compatibility assessment was carried out to evaluate possible interactions between liranaftate and the selected excipients used in the formulation. Fourier Transform Infrared Spectroscopy (FTIR) analysis was employed to confirm the chemical compatibility of the drug with formulation components. The FTIR spectra of pure liranaftate, individual excipients, and their physical mixtures were obtained using an FTIR spectrophotometer within the scanning range of 4000–400 cm⁻¹. The recorded spectra were carefully analyzed for any significant changes, including shifting, disappearance, or appearance of characteristic peaks, which may indicate potential drug–excipient interactions11.
2.2.1.8 Pseudo ternary phase diagram
It were established to find the suitable nanoemulsion space and optimize the proportions of oil, surfactant, and co-surfactant (Smix) in the developed formulation. Almond oil was chosen as the oil phase, whereas Tween 80 and propylene glycol were selected as the surfactant and co-surfactant, respectively, due to their high liranaftate solubilization capability observed during preliminary solubility evaluation. Different Smix ratios of surfactant to co-surfactant, including 3:5, 4:5, and 1:1, were prepared and further mixed with the oil phase in ratios varying from 1:9 to 9:1. Distilled water was gradually introduced into each mixture dropwise under continuous gentle stirring at ambient temperature using a magnetic stirrer. The prepared systems were visually assessed for parameters such as clarity, transparency, phase separation, and overall appearance including nanoemulsion formation, turbidity, or gel formation. The nanoemulsion area was identified by employing the aqueous titration technique, and the diagrams were draw using Chemix Classroom software12.
| Fig. No.1: Ratio at 3:5 | Fig. No.2 : Ratio at 4:5 |
| Fig. No.3 :Ratio at 1:1 |
Experiment Design:
2.2.1 Design of experiment:
The experimental study was analyzed using Design-Expert software for optimization of the Liranaftate loaded nanoemulgel formulation. A Central Composite Design (CCD) was used because it is a widely applied Response Surface Methodology (RSM) design for studying the effect of formulation variables with a limited number of experiments. The study evaluated the influence of independent variables such as the concentration of almond oil (X1) and Tween 80 (X2) on dependent responses including particle size, and viscosity. A three-level, two-factor CCD design was selected to optimize the nanoemulsion formulation effectively 13
Table 1: Independent Variables with Coded Levels
| Sr. No. |
code | Factor | Level | ||
|---|---|---|---|---|---|
| Low | Medium | High | |||
| 1. | X1 | Almond oil |
0.03 | 0.06 | 0.09 |
| 2. | X2 | Tween 80 | 0.1125 | 0.135 | 0.1575 |
Table 2: Formulation Table: Preparation of Liranaftate- Loaded Nanoemulgel
| Formulation code |
F1 | F2 | F3 | F4 | F5 | F6 | F7 | F8 | F9 |
|---|---|---|---|---|---|---|---|---|---|
| Liranaftate( mg) |
10 | 10 | 10 | 10 | 10 | 10 | 10 | 10 | 10 |
| Almond oil (ml) |
0.01 | 0.01 | 0.01 | 0.02 | 0.02 | 0.02 | 0.03 | 0.03 | 0.03 |
| Tween 80(ml) |
0.037 | 0.045 | 0.052 | 0.037 | 0.045 | 0.052 | 0.037 | 0.045 | 0.052 |
| Propylene glycol (ml) |
0.05 | 0.05 | 0.05 | 0.05 | 0.05 | 0.05 | 0.05 | 0.05 | 0.05 |
| Methyl paraben(mg) |
0.000 3 |
0.000 3 |
0.000 3 |
0.000 3 |
0.000 3 |
0.000 3 |
0.000 3 |
0.000 3 |
0.000 3 |
| Propyl paraben(mg) |
0.000 1 |
0.000 1 |
0.000 1 |
0.000 1 |
0.000 1 |
0.000 1 |
0.000 1 |
0.000 1 |
0.000 1 |
| BHT | 0.001 | 0.001 | 0.001 | 0.001 | 0.001 | 0.001 | 0.001 | 0.001 | 0.001 |
| Water(ml) | 1 | 1 | 1 | 1 | 1 | 1 | 1 | 1 | 1 |
2.2.2 Preparation of Nanoemulgel
The nanoemulsion was prepared by first dissolving a measured quantity of propylene glycol in distilled water maintained at approximately 80°C to form the aqueous phase. Separately, the oil phase was developed by blending almond oil with Tween 80 under controlled heating conditions. Liranaftate was gradually incorporated into the oil mixture with continuous stirring until a clear and uniform solution was obtained. Preservatives such as methyl paraben, propyl paraben, and the antioxidant BHT were subsequently added to the mixture to enhance formulation stability. The aqueous phase was then slowly introduced into the oil phase while homogenization was carried out using a homogenizer operated at optimized rotational speed to obtain a stable nanoemulsion system.
For preparation of the gel base, Carbopol 934 was dispersed uniformly in distilled water maintained at around 40°C under continuous stirring. Triethanolamine was added gradually to adjust the pH and promote gel formation. The prepared gel was stored under refrigerated conditions for 24 hours to ensure complete hydration and improved consistency. Finally, the nanoemulsion containing 1% drug was incorporated slowly into the gel base with gentle stirring to obtain a homogeneous emulgel formulation suitable for topical application14, 15, 16.
2.2 Evaluation Test
2.2.1 Evaluation of Nanoemulsion
2.2.1.5 Particle size
The particle size of the formulated nanostructured lipid carriers was determined using the Dynamic Light Scattering (DLS) method. Generally, NLCs exhibit particle sizes within the nanometer range of approximately 10–1000 nm. Particle size plays a crucial role in influencing drug release, stability, and penetration characteristics of the formulation. Smaller and uniformly distributed particles are often associated with improved stability and enhanced delivery performance.
2.2.1.6 Polydispersity Index (PDI)
The Polydispersity Index (PDI) was evaluated to determine the homogeneity of particle size distribution within the formulation. PDI values below 0.3 are generally considered indicative of a uniform and monodisperse nanoparticle system, reflecting good stability and consistency. Conversely, higher PDI values represent a wider variation in particle size, suggesting a heterogeneous system that may affect the physical stability of the formulation over time17.
2.2.1.7 Zeta potential:
The surface charge of the nanoemulsion droplets was determined using a zeta sizer instrument to evaluate the zeta potential of the formulation. Zeta potential is considered an important parameter for predicting the physical stability of colloidal systems. Formulations exhibiting zeta potential values greater than +20 mV or less than -20 mV generally possess adequate electrostatic repulsion between particles, thereby minimizing particle aggregation and improving dispersion stability18.
2.2.1.8 Scanning Electron Microscopy:
The morphology of the nanoemulsion can be evaluated using Scanning Electron Microscopy (SEM), which provides detailed three-dimensional images of the particles. The samples are analyzed under an appropriate accelerating voltage, generally around 20 kV, at various magnifications. SEM enables effective examination of the surface characteristics and structural appearance of the dispersed phase present in the formulation. Furthermore, image analysis software can be utilized for automated assessment of particle shape and surface morphology19.
2.2.2 Evaluation of Nanoemulgel
2.2.2.5 pH Determination:
The pH of the prepared formulation was determined using a properly calibrated digital pH meter with standard buffer solutions. Measurement of pH is an important parameter for topical preparations because formulations intended for skin application should possess a pH close to that of the skin, generally within the range of 5.0–7.0, to minimize the risk of irritation or discomfort. In addition, the pH of the formulation can
significantly influence the chemical stability, solubility, and ionization behaviour of the incorporated drug20.
2.2.2.6 Viscosity:
The viscosity of the prepared emulgel formulations was evaluated using a Brookfield Viscometer (RVDV-I Prime, Brookfield Engineering Laboratories, USA) fitted with spindle number 63. An adequate quantity of formulation was transferred into a suitable beaker and allowed to stand for approximately 30 minutes at a controlled temperature of 25 ± 1°C before analysis. The spindle was carefully immersed vertically into the centre of the sample without touching the bottom of the container. The measurement was carried out at a rotational speed of 50 rpm for 10 minutes, after which the viscosity values of the formulations were recorded21.
7.5. 2.3 Spreadability:
The spreadability of the prepared gel formulation was evaluated using the parallel plate method. Two glass slides of suitable dimensions were selected, and a measured quantity of gel was placed between them. The upper slide was carefully moved to distribute the formulation uniformly and to avoid entrapment of air bubbles. A standard weight of 50g was then placed on the upper slide to obtain a thin and even film of gel between the plates. Additional weight was subsequently applied, and the time required for the upper slide to move over the lower slide was recorded using a stopwatch. This method is widely used for semisolid formulations because of its simplicity, reproducibility, and economical nature. The spreadability of the formulation was calculated using the appropriate standard formula22, 23.
7.5.2.4 in vitro drug release
The in vitro drug release study of Liranaftate-loaded nanoemulgel was performed using the dialysis membrane diffusion method. Methanol was used as the release medium to ensure adequate solubility of the drug and maintain sink conditions throughout the study. An accurately measured quantity of nanoemulgel was placed inside a pre-soaked dialysis membrane, which was securely tied at both ends. The prepared dialysis bag was immersed in the receptor compartment containing methanol
and maintained at a temperature of 37±2°C with continuous stirring at 50 rpm. At regular time intervals, samples were withdrawn from the receptor medium and replaced immediately with an equal volume of fresh methanol to maintain constant volume during the experiment. The collected samples were suitably diluted and analyzed using a UV-visible spectrophotometer at the selected wavelength of Liranaftate. The cumulative percentage drug release from the nanoemulgel formulation was then determined23.
7.5.2.5 Antifungal activity:
The antifungal activity of the Liranaftate-loaded nanoemulgel was evaluated using the agar well diffusion method against Trichophyton rubrum. Sabouraud dextrose agar (SDA) medium was used for the cultivation and maintenance of the fungal strain. The fungal culture was uniformly spread over the surface of the sterile agar plates under aseptic conditions. Wells were then prepared in the agar medium using a sterile gel borer. Different nanoemulgel formulations containing Liranaftate were carefully introduced into the respective wells, while a marketed antifungal preparation was used as the standard reference. The inoculated plates were incubated at 37°C for 24–48 hours to allow fungal growth and diffusion of the drug into the medium. After the incubation period, the antifungal activity was determined by measuring the diameter of the zones of inhibition surrounding each well. The obtained results were compared to evaluate the effectiveness of the prepared nanoemulgel formulation against Trichophyton rubrum24.
RESULTS AND DISCUSSION
3.1 PREFORMULATION STUDY:
3.1.1 Identification Test:
The appropriate procedures were used to conduct the testing. Table 8.1 has a mention of the findings. The test findings fall within the range. The test findings indicate that the medication liranaftate is pure.
Table 3: Identification Tests for Liranaftate
| Sr. No. | Physical Properties |
Methods | Description |
|---|---|---|---|
| 1 | Physical nature | Visual observation |
Solid |
| 2 | colour | Visual observation |
White - yellow |
| 3 | Odor | Smelling by nose |
Odorless |
| 4 | Melting point | Capillary method |
99˚C-110˚C |
3.1.2 Solubility of Liranaftate in various solvents
The solubility study of liranaftate in different solvents is mentioned in Table 8.2. The nanoemulgel production technique benefits from the solubility test's assistance in choosing a solvent.
Table 4: Solubility Profile of Liranaftate in Different Solvents
| Sr. No. | Solvent | Solubility |
|---|---|---|
| 1 | Water | Insoluble |
| 2 | Methanol | Slightly soluble |
| 3 | Chloroform | soluble |
| 4 | Acetone | soluble |
3.1.3 UV Spectral Characterization:
Determination of absorption maxima:
The maximum wavelength was found to be 293nm from the liranaftate spectra which was chosen for the study.
Calibration Curve of Liranaftate in Methanol:
The graph of value Absorbance Vs Concentration for pure Liranaftate was achieved at 293 nm. The calibration curve was plotted using both the concentration and absorbance data.
Table 5: Absorbance Value at Various Concentration of Liranaftate in Methanol
| Sr. No. | Concentration (μg/ml) |
Absorbance |
|---|---|---|
| 1. | 2 | 0.188 |
| 2. | 4 | 0.392 |
| 3. | 6 | 0.584 |
| 4. | 8 | 0.781 |
| 5. | 10 | 0.976 |
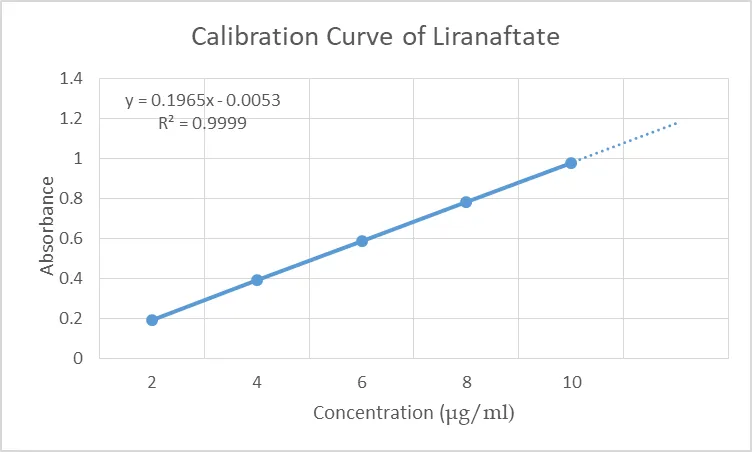
Figure 4: Calibration Curve of Liranaftate in Methanol
3.1.4 Fourier Transform Infrared Spectroscopy:
3.1.4.1 FTIR of Pure Liranaftate Drug
The FTIR spectrum of Liranaftate was recorded using FTIR (Alpha II Brucker). The spectrum was recorded from 3000 to 400 cm-1. The IR spectrum is shown in Figure
8.2 from the observed peak it is concluded that Liranaftate is in pure form.
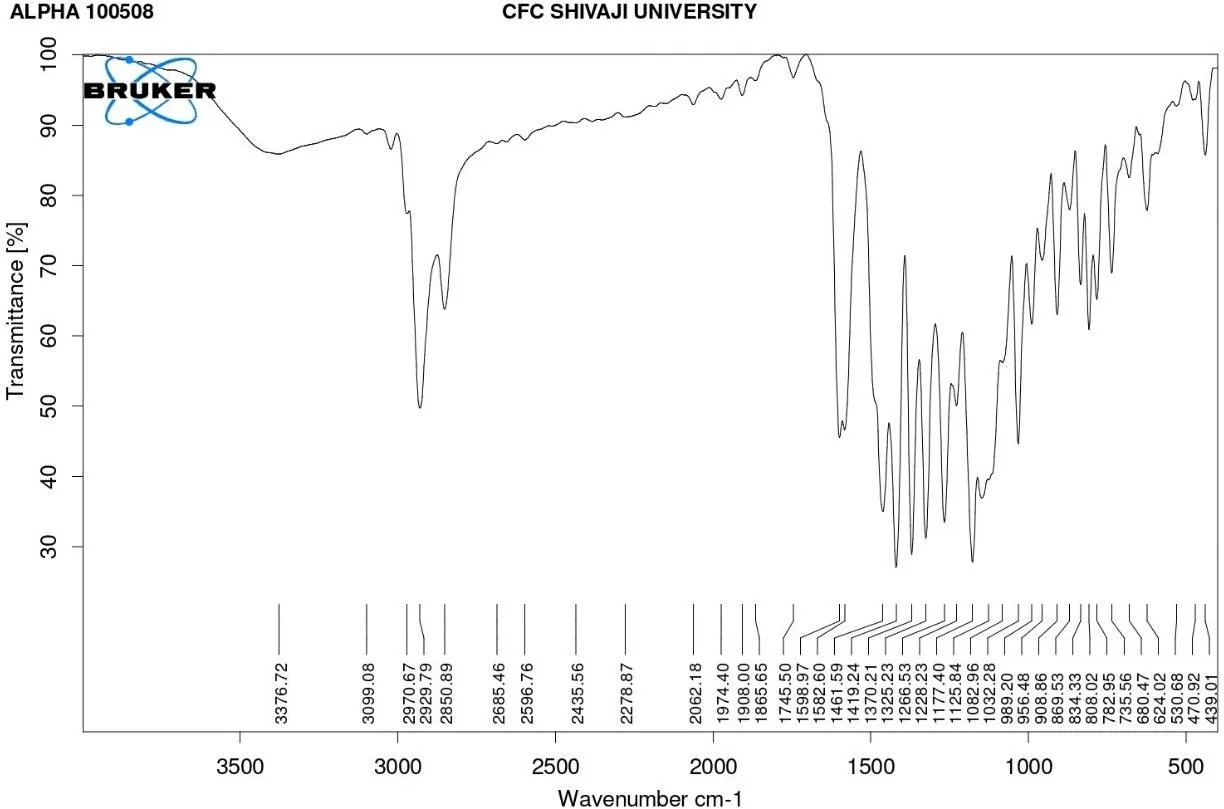
Figure 5: FTIR Spectrum of Liranaftate Drug
Table 6: FTIR Ranges of Liranaftate Drug
| Sr. No. |
Wavenumber (cm-1) | Peak intensity | Stretching/ Bending Vibration |
Probable functional group |
|---|---|---|---|---|
| 1. | 3376.72 | Broad | O-H stretching |
Hydroxy group |
| 2. | 3099.08 | Weak | =C-H stretching |
Aromatic group |
| 3. | 2970.67 | Strong | C-H stretching |
Alkane chain |
| 4. | 2929.79 | Strong | CH2 asymmetric stretching |
Aliphatic chain |
|---|---|---|---|---|
| 5. | 2850.89 | Medium | CH2 symmetric stretching |
Alkane group |
| 6. | 1745.50 | strong | C=O stretching |
Ester /Carbonyl group |
The FTIR spectrum of pure liranaftate showed characteristic absorption peaks corresponding to aromatic, alkane, ester, ether, and thiocarbamate functional groups. The prominent peak observed around 1745 cm⁻¹ confirmed the presence of carbonyl (C=O) stretching, while peaks in the region of 2970–2850 cm⁻¹ indicated aliphatic C–H stretching vibrations. These characteristic peaks confirmed the identity and purity of liranaftate without significant structural alteration.
3.1.5 Drug Excipient Compatibility Study:
FTIR Spectra of Liranaftate and Almond Oil
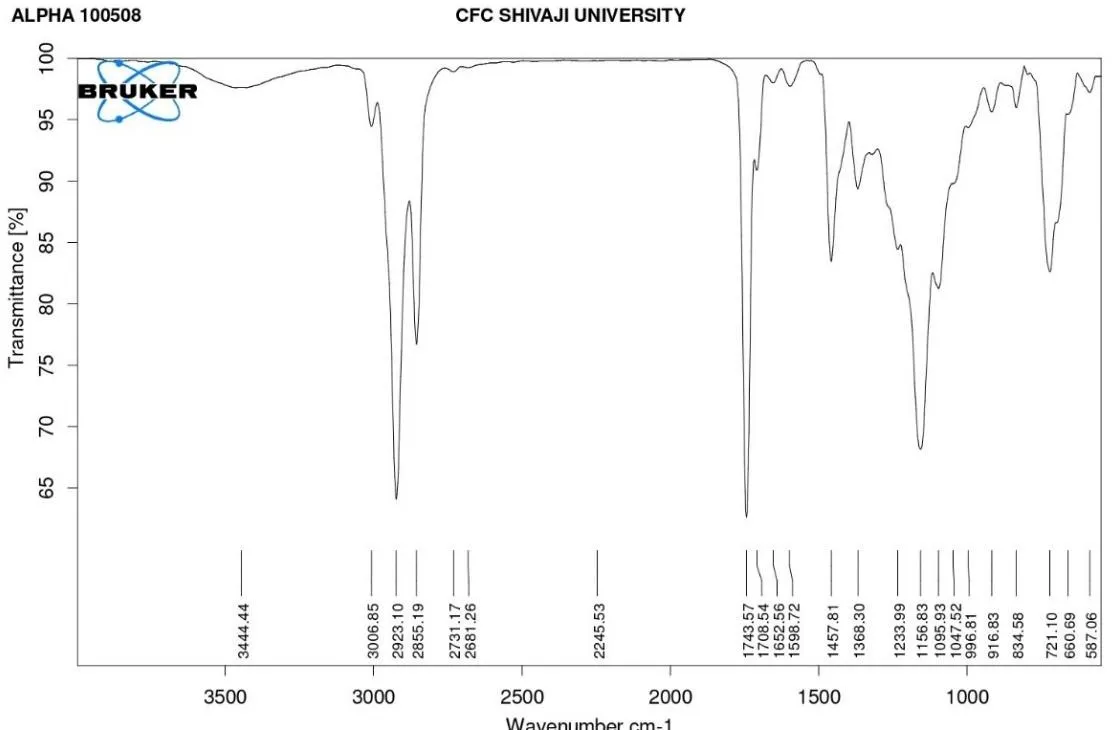
Figure 6: FTIR Spectra of Liranaftate and Almond Oil
Table 7: FTIR Ranges of Liranaftate and Almond Oil
| Sr. No. | Wavenumber (cm-1) | Peak intensity | Stretching vibration | Probable functional group |
|---|---|---|---|---|
| 1. | 3444.44 | Broad | O-H stretching |
Hydroxyl group |
| 2. | 3006.85 | Weak | =C-H stretching |
Aromatic ring |
| 3. | 2923.10 | Strong | C-H asymmetric stretching |
Alkane group |
| 4. | 2855.19 | Strong | C-H symmetric |
Aliphatic chain |
| 5. | 1743.57 | Strong, Sharp | C=O stretching |
Ester carbonyl group |
| 6. | 1708.54 | Strong | C=O stretching |
Thiocarbamate group |
| 7. | 1652.56 | Medium | C=O stretching |
Aromatic |
3.1.6 FTIR Spectra of Liranaftate and Tween 80
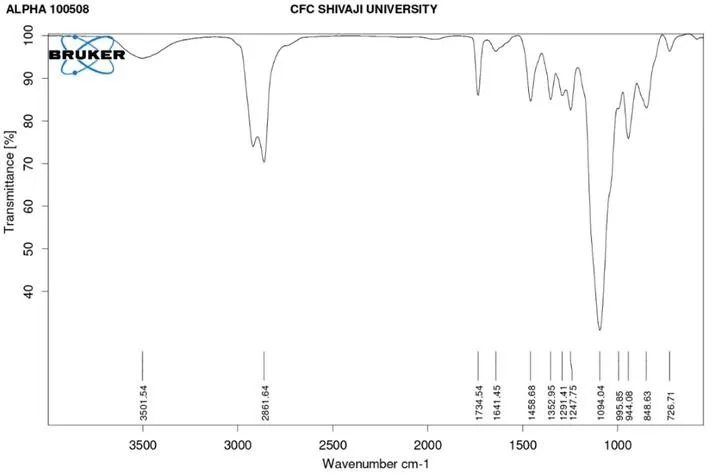
Figure 7: FTIR Spectra of Liranaftate and Tween 80
Table 8: FTIR Ranges of Liranaftate and Tween 80
| Sr. No. |
Wavenumber (cm-1) | Peak Intensity | Stretching / Bending Vibration |
Probable functional group |
|---|---|---|---|---|
| 1. | 3501.54 | Broad | O-H stretching |
Hydroxy group |
| 2. | 2861.64 | Strong | C-H stretching |
Aliphatic alkane |
| 3. | 1734.54 | Very strong | C=O stretching |
Ester carbonyl group |
| 4. | 1641.45 | Medium | C=C stretching |
Aromatic / alkane group |
| 5. | 1247.75 | Strong | C-O-C stretching |
Ether linkage |
| 6. | 1094.04 | Very strong | C-O stretching |
Polyoxyethylene group |
3.1.7 FTIR of Liranaftate Nanoemulgel:
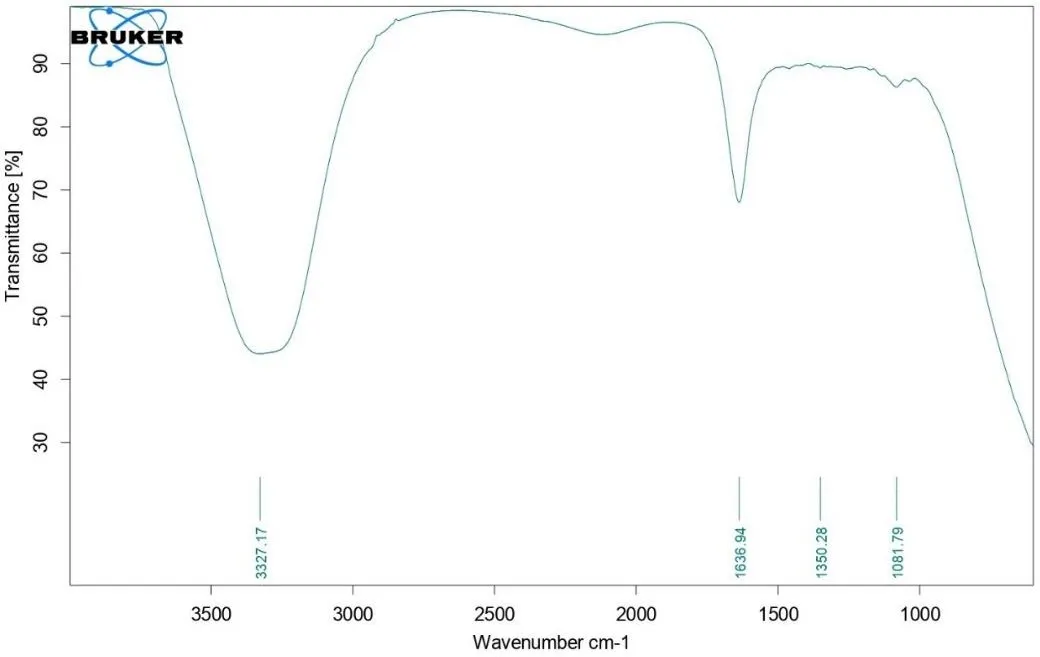
Figure 8: FTIR of Liranaftate Nanoemulgel
The FTIR spectrum of the prepared nanoemulgel formulation showed characteristic absorption peaks at 3327.17 cm⁻¹, 1636.94 cm⁻¹, 1350.28 cm⁻¹, and 1081.79 cm⁻¹. The broad peak observed at 3327.17 cm⁻¹ corresponds to O–H stretching vibration, indicating the presence of hydroxyl groups and hydrogen bonding within the formulation. The peak at 1636.94 cm⁻¹ represents C=C stretching or bending vibrations associated with the drug and excipients. The absorption peak at 1350.28 cm⁻¹ is attributed to C–H bending vibrations, while the peak at 1081.79 cm⁻¹ corresponds to C–O stretching vibrations of ether or ester groups present in the formulation components.
The obtained FTIR spectrum confirmed the presence of major functional groups of the drug and excipients without significant shifting or disappearance of characteristic peaks. This indicates the absence of chemical interaction between Liranaftate and formulation excipients, confirming good compatibility and stability of the developed nanoemulgel formulation.
3.1.8 DSC of Liranaftate Drug:
The Differential Scanning Calorimetry (DSC) thermograms of pure Liranaftate showed a sharp endothermic peak at 99.81°C with an onset temperature of 97.68°C and enthalpy value of 110.09 J/g. The sharp and narrow melting endothermic peak indicates the crystalline nature and purity of the drug. The absence of additional peaks
confirmed that the drug sample was free from impurities and thermal degradation.
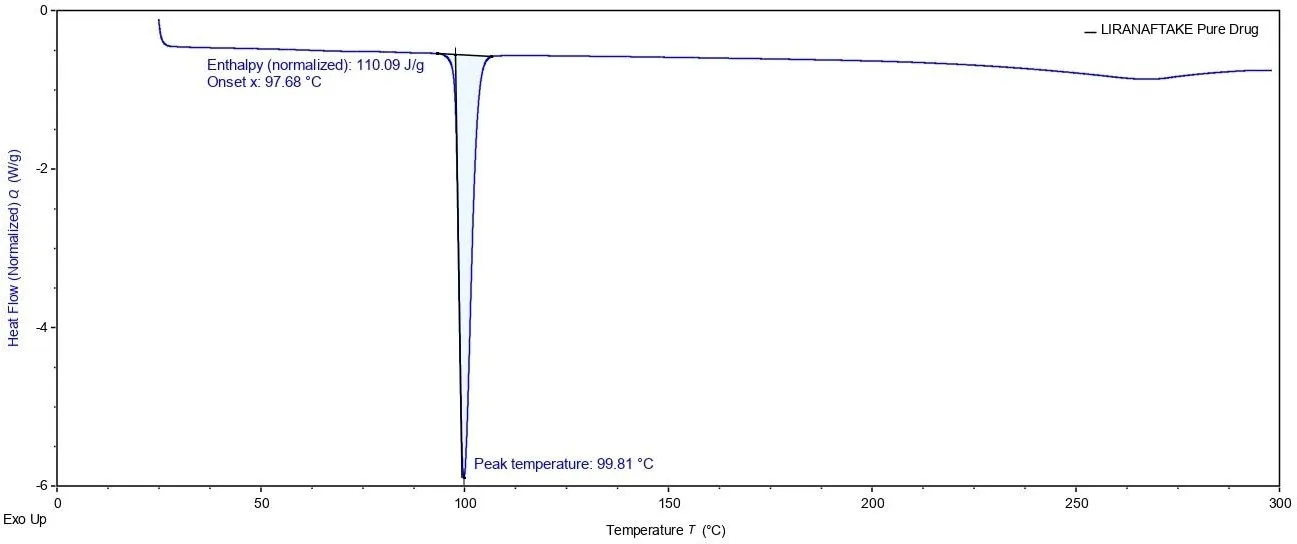
Figure 9: DSC of Liranaftate Drug:
Ternary phase diagram:
| Fig. No. 10: 1:1 ratio of tween 80 :Propylene glycol |
A pseudo-ternary phase diagram was developed to determine the most appropriate ratio of surfactant-co-surfactant mixture (Smix) and oil for the preparation of nanoemulsion formulations. Different Smix ratios, including 3:5, 4:5, and 1:1 were evaluated and compared based on the extent of the nanoemulsion region obtained in each phase diagram. Among all tested ratios, the 1:1 Smix ratio exhibited the widest nanoemulsion area, indicating enhanced emulsification capability and greater
formulation stability. The broader nanoemulsion region also suggested improved flexibility in selecting suitable component concentrations during formulation development. Therefore, the 1:1 Smix ratio was considered the optimized ratio for the preparation of a stable and efficient nanoemulsion system.
Experimental design:
ANOVA for Quadratic model Response 1: Particle Size
Table 9: Response Table of Particle Size
| Source | Sum of Squares | df | Mean Square | F-value | p-value | |
|---|---|---|---|---|---|---|
| Model | 794.05 | 5 | 158.81 | 6943.89 | < 0.0001 | significant |
| AAlmond oil | 665.71 | 1 | 665.71 | 29107.82 | < 0.0001 | |
| B- Tween80 |
127.88 | 1 | 127.88 | 5591.59 | < 0.0001 | |
| AB | 0.0025 | 1 | 0.0025 | 0.1093 | 0.7627 | |
| A² | 0.1089 | 1 | 0.1089 | 4.76 | 0.1171 | |
| B² | 0.3472 | 1 | 0.3472 | 15.18 | 0.0300 | |
| Residual | 0.0686 | 3 | 0.0229 | |||
| Cor Total | 794.12 | 8 |
The Model F-value of 6943.89 implies the model is significant. P-values less than 0.0500 indicate model terms are significant. In this case A, B, B² are significant model.
Fit Statistics
Table 10: Fit Statistics of Particle Size
| Std. Dev. | 0.1512 | R² | 0.9999 |
|---|---|---|---|
| Mean | 152.38 | Adjusted R² | 0.9998 |
| C.V. % | 0.0992 | Predicted R² | 0.9990 |
| Adeq Precision | 245.3871 |
The Predicted R² of 0.9990 is in reasonable agreement with the Adjusted R² of 0.9998; i.e. the difference is less than 0.2.
Adeq Precision measures the signal to noise ratio. A ratio greater than 4 is desirable. Your ratio of 245.387 indicates an adequate signal. This model can be used to navigate the design space.
Final Equation in Terms of Coded Factors Response 1: Particle Size, Y1
Y1 = 152.26+10.53X1-4.62X2-0.0250X1X2-0.2333X12+0.4167X 2 …. Eq (1)
Figure 11: 2D Contour Plots and 3D Response Surface Plots for Evaluating Influence of Almond Oil (X1) and Tween 80 (X2) on Particle Size (Y1)
Effect of independent variable on Particle size
The 3D response surface plot for particle size demonstrated the combined influence of Almond oil and Tween 80 on globule size of the nanoemulgel formulation. It was observed that increasing Almond oil concentration resulted in an increase in particle size due to higher dispersed phase volume. In contrast, increasing Tween 80 concentration reduced particle size because of improved emulsification and stabilization of nano-sized droplets. The curved surface confirmed the significant effect of formulation variables on particle size optimization.
ANOVA for Quadratic model Response 2: Viscosity
Table 11: Response of Viscosity
| Source | Sum of Squares | df | Mean Square | F-value | p-value | |
|---|---|---|---|---|---|---|
| Model | 5.353E+0 6 |
5 | 1.071E+06 | 761.26 | < 0.0001 | significa nt |
| A- Almond oil |
4.842E+0 6 |
1 | 4.842E+06 | 3442.92 | < 0.0001 | |
| B- Tween 80 |
1.308E+0 5 |
1 | 1.308E+05 | 93.03 | 0.0024 | |
| AB | 324.00 | 1 | 324.00 | 0.2304 | 0.6641 | |
| A² | 256.89 | 1 | 256.89 | 0.1827 | 0.6979 | |
| B² | 3.796E+0 5 |
1 | 3.796E+05 | 269.92 | 0.0005 | |
| Residu al | 4219.11 | 3 | 1406.37 | |||
| Cor Total | 5.357E+0 6 |
8 |
The Model F-value of 761.26 implies the model is significant. P-values less than 0.0500 indicate model terms are significant. In this case A, B, B² are significant model terms.
Fit Statistics
Table 12: Fit Statistics of Viscosity
| Std. Dev. | 37.50 | R² | 0.9992 |
|---|---|---|---|
| Mean | 5575.56 | Adjusted R² | 0.9979 |
| C.V. % | 0.6726 | Predicted R² | 0.9926 |
| Adeq Precision | 78.0211 |
The Predicted R² of 0.9926 is in reasonable agreement with the Adjusted R² of 0.9979; i.e. the difference is less than 0.2.
Adeq Precision measures the signal to noise ratio. A ratio greater than 4 is desirable. Your ratio of 78.021 indicates an adequate signal. This model can be used to navigate the design space.
Response 1: Particle Size, Y1
[Figure could not be converted – please insert manually]
2
Y1 = 152.26+10.53X1-4.62X2-0.0250X1X2-0.2333X12+0.4167X 2 …. Eq (1)
Figure 12: 2D Contour Plots and 3D Response Surface Plots for Evaluating Influence of Almond Oil (X1) and Tween 80 (X2) on Viscosity (Y2)
Effect of independent variable on viscosity
The 3D response surface plot for viscosity showed that viscosity increased significantly with increasing Almond oil concentration. This may be due to increased internal resistance and thickness of the formulation system. Tween 80 also influenced viscosity, but its effect was comparatively lower than Almond oil. The response surface plot indicated the interaction between formulation variables and helped in selecting the optimized nanoemulgel with suitable viscosity for topical application.
3.2 Evaluation of Nanoemulsions:
3.2.1 Particle Size:
The particle size of nanoemulgel formulations ranged from 137.4 nm to 167.5 nm, indicating successful formation of nano-sized droplets. Formulation F3 showed the optimized batch with better emulsification efficiency and desirable nanoscale particle distribution.
Table 13: Particle Size Analysis
| Formulation code |
Particle size (nm) |
|---|---|
| F1 | 146.5 |
| F2 | 141.4 |
| F3 | 137.4 |
| F4 | 157.4 |
| F5 | 152.2 |
| F6 | 148 |
| F7 | 167.5 |
| F8 | 162.7 |
| F9 | 158.9 |
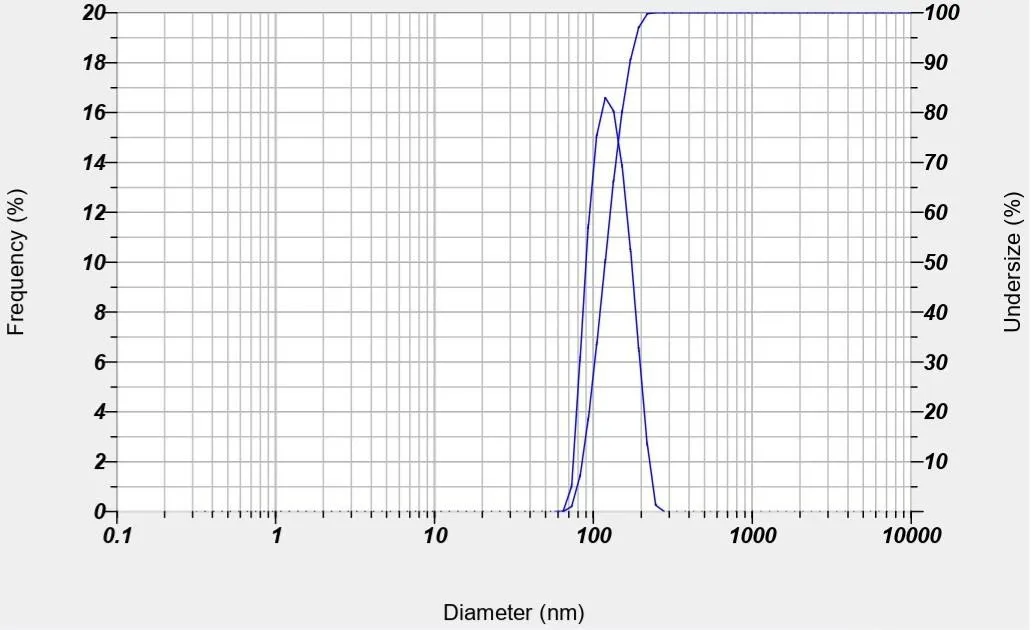
Figure 13: Particle Size
3.2.2 Polydispersity Index:
The polydispersity index (PDI) values of all formulations ranged from 0.318 to 0.425, indicating moderate to good uniformity in particle size distribution of the nanoemulgel system. Among all formulations, F3 showed the lowest PDI value (0.318), suggesting better homogeneity and stability.
Table 14: Polydispersity Index
| Formulation code |
Polydispersity Index |
|---|---|
| F1 | 0.321 |
| F2 | 0.349 |
| F3 | 0.318 |
| F4 | 0.380 |
| F5 | 0.349 |
| F6 | 0.425 |
| F7 | 0.408 |
| F8 | 0.398 |
| F9 | 0.352 |
3.2.3 Zeta Potential:
Zeta potential analysis was carried out to determine the physical stability of the nanoemulsion system under stress conditions as per ICH stability guidelines. The optimized formulation with nanosized particles around 137.4 nm exhibited a zeta potential value of -21.1 mV, indicating good electrostatic repulsion between particles and improved stability of the colloidal dispersion. The negative zeta potential value also suggested reduced particle aggregation and enhanced dispersion uniformity.
Table 15: Zeta Potential
| Formulation code | Zeta potentials |
|---|---|
| F3 | -21.1mV |
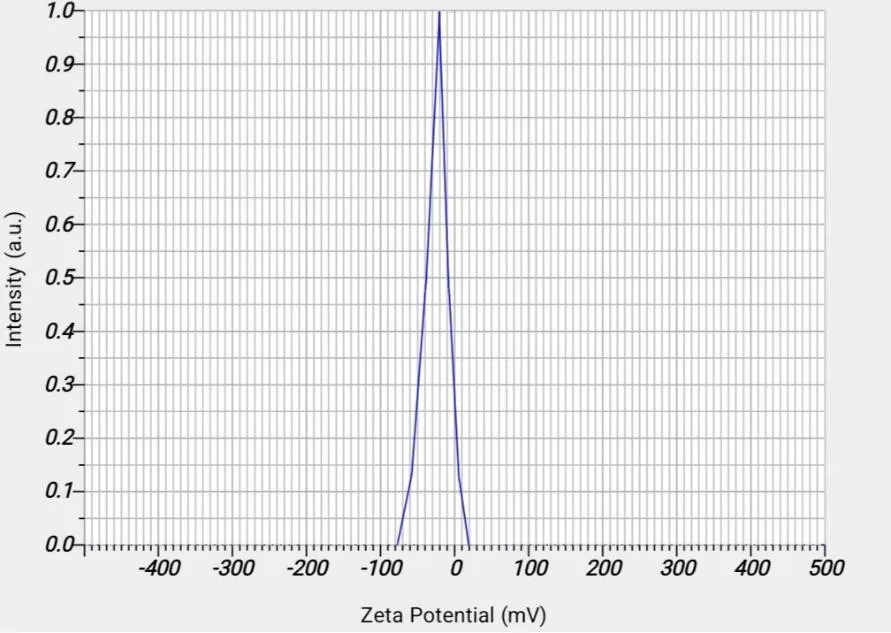
Figure 14: Zeta Potential
3.2.4 Scanning Electron Microscopy (SEM):
Scanning electron microscopy of Nanoemulsion is shown in figure. The shape of nanoemulsion was globular in the micrometer range. The micrograph also revealed the |some agglomeration of nanoemulsion which might be due to the evaporation of water present in formulation during sample preparation prior to SEM analysis.
Figure 15: Scanning Electron Microscopy
3.2 Evaluation of Nanoemulgel:
3.3.1 Appearance:
Table 16: Appearance
| Parameter | Inference |
|---|---|
| Colour | Translucent gel |
| Homogeneity | Homogeneous |
| Consistency | Consistency |
3.3.2 pH Determination:
pH of various emulgel are shown in the following table which was found to be in range of 6.25 to 6.50 pH values indicate the suitability of emulgel for topical application, so as to minimize discomfort or irritation due to acidic pH and microbial growth due to basic pH.
Table 17: pH Determination
| Formulation code | pH |
|---|---|
| F1 | 6.48 |
| F2 | 6.62 |
| F3 | 6.54 |
| F4 | 6.35 |
| F5 | 6.39 |
| F6 | 6.28 |
| F7 | 6.24 |
| F8 | 6.50 |
| F9 | 6.41 |
3.3.3 Viscosity:
The viscosity of nanoemulgel formulations ranged from 4382 cp to 6730 cp, indicating the effect of formulation components on gel consistency and flow behavior. The optimized batch F3 showed a viscosity of 6218 cp, which was considered suitable for topical application with good consistency, stability, and spreadability of the nanoemulgel system.
Table 18: Viscosity
| Formulation code |
Viscosity (cp) |
|---|---|
| F1 | 4382 |
| F2 | 4976 |
| F3 | 6218 |
| F4 | 5248 |
| F5 | 5892 |
| F6 | 5564 |
| F7 | 4685 |
| F8 | 6730 |
| F9 | 6485 |
3.3.4 Spreadability:
The spreadability of nanoemulgel formulations ranged from 13.58 to 18.14, indicating suitable applicability and ease of spreading over the skin surface. Among all formulations, the optimized batch F3 showed the optimum spreadability value (18.14), which suggests better uniform application, improved patient compliance, and desirable consistency for topical delivery.
Table 19: Spreadability
| Formulation code |
Spreadability |
|---|---|
| F1 | 15.45 |
| F2 | 16.02 |
| F3 | 18.14 |
| F4 | 14.26 |
| F5 | 15.48 |
| F6 | 14.93 |
| F7 | 15.55 |
| F8 | 14.03 |
| F9 | 13.58 |
3.3.5 in vitro drug release study:
Table 20: in vitro Drug Release Study
| Time (hr) | F1 | F2 | F3 | F4 | F5 | F6 | F7 | F8 | F9 |
|---|---|---|---|---|---|---|---|---|---|
| 0 | 0 | 0 | 0 | 0 | 0 | 0 | 0 | 0 | 0 |
| 1 | 5.2 | 4.8 | 7.28 | 5.98 | 3.96 | 4.27 | 5.35 | 4.12 | 6.38 |
| 2 | 10.81 | 7.32 | 12.98 | 10.16 | 8.28 | 10.26 | 10.59 | 8.52 | 11.34 |
| 3 | 16.53 | 13.48 | 20.28 | 15.53 | 12.62 | 15.89 | 18.67 | 12.85 | 17.27 |
| 4 | 22.39 | 20.48 | 29.78 | 20.45 | 19.28 | 26.98 | 24.39 | 15.26 | 24.18 |
| 5 | 28.19 | 26.5 | 39.73 | 30.35 | 22.8 | 33.52 | 30.45 | 21.38 | 31.62 |
| 6 | 35.27 | 33.98 | 50.12 | 43.32 | 31.49 | 45.39 | 35.97 | 25.28 | 38.84 |
| 7 | 45.82 | 42.78 | 61.85 | 51.37 | 47.45 | 56.42 | 46.89 | 42,52 | 50.39 |
| 8 | 53.45 | 52.78 | 73.25 | 58.67 | 55.89 | 61.37 | 65.38 | 51.29 | 62.19 |
| 10 | 69.23 | 71.5 | 84.5 | 65.48 | 60.32 | 76.39 | 80.45 | 68.51 | 81.25 |
| 12 | 80.25 | 82.46 | 93.39 | 73.82 | 70.52 | 86.25 | 87.28 | 76.27 | 89.34 |
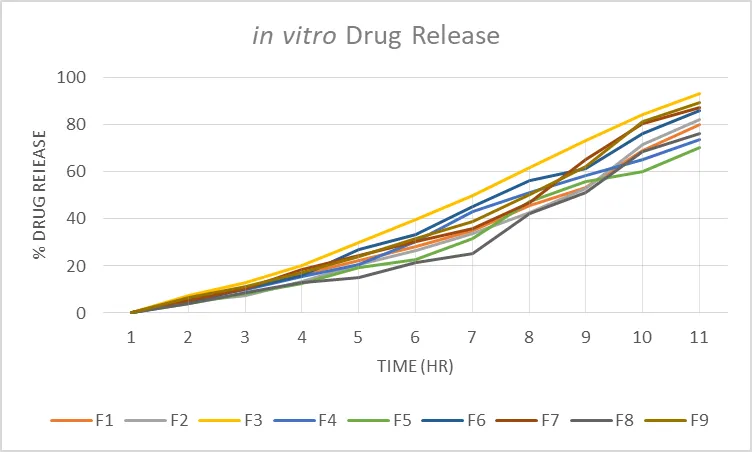
Figure 16: in vitro Drug Release
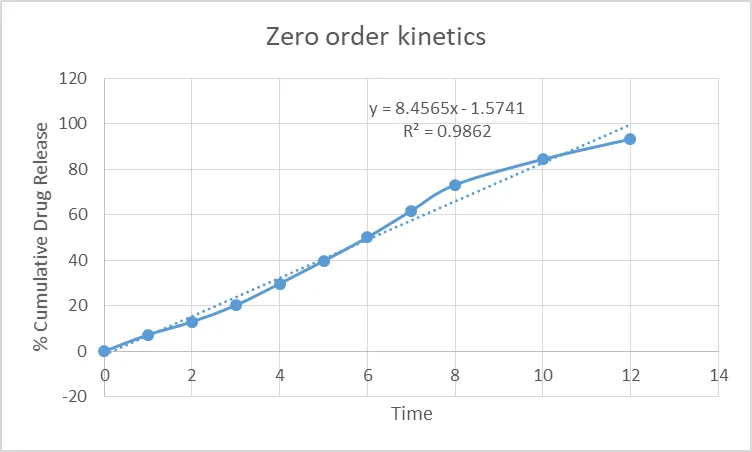
Figure 17: Zero-Order Kinetics
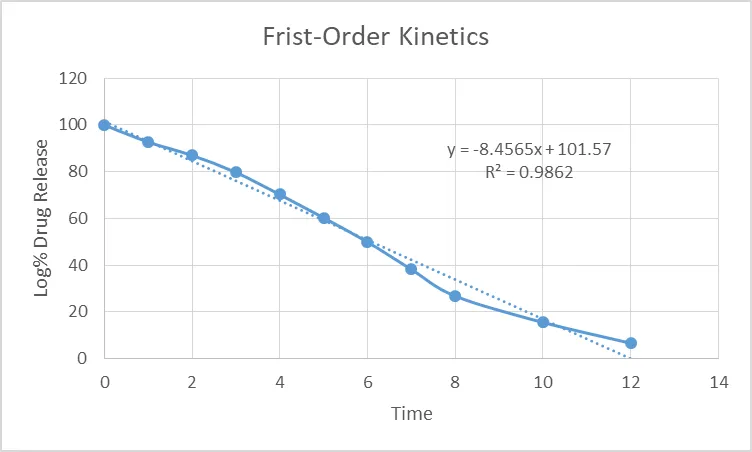
Figure 18: First-Order Kinetics
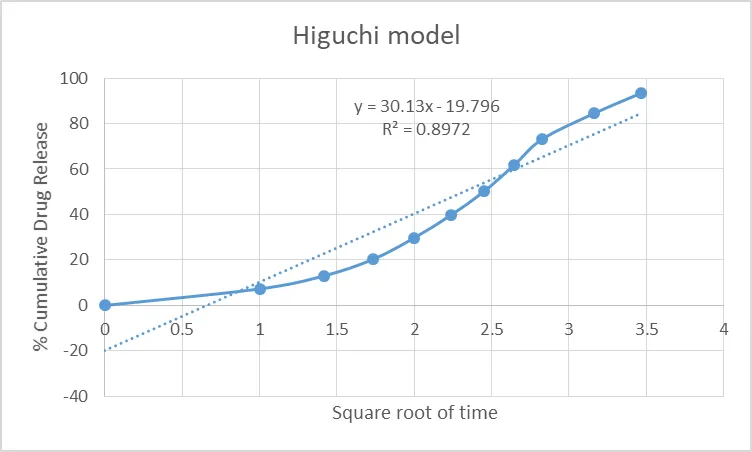
Figure 19: Higuchi Model
The Zero-order and Higuchi model show a good fit, indicating a consistent and diffusion influence release.
3.3.6 Antifungal activity:
The antifungal activity study showed that the nanoemulgel formulation exhibited a zone of inhibition of 18 mm, indicating significant antifungal effectiveness against the tested microorganism. Although the activity was lower than the standard drug Miconazole (22 mm), the optimized nanoemulgel demonstrated appreciable antimicrobial potential, while the control showed no zone of inhibition.
Table 21: Antifungal Activity of Test Samples Against T. rubrum
| Sr. No. | Samples | Zone in Diameter (mm) |
|---|---|---|
| 1 | Control | 00 |
| 2 | Standard (Miconazole) | 22 |
| 3 | Nanoemulgel | 18 |
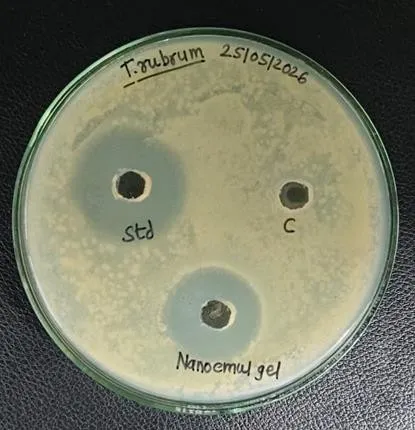
Figure 20: Antifungal Activity Against T. rubrum
The antifungal activity of the formulation was tested against Trichophyton rubrum using the agar well diffusion method. The formulation showed effective antifungal activity with satisfactory drug release and good stability characteristics. The nanoemulgel demonstrated better penetration and enhanced therapeutic performance compared to conventional topical preparations. Overall, the formulation proved to be a promising and effective approach for topical antifungal drug delivery.
CONCLUSION
The formulation Liranaftate nanoemulgel demonstrated significant potential as an effective topical antifungal formulation. The optimized batch F3 was successfully prepared using suitable oils, surfactants, and gelling agents to improve the delivery of Liranaftate through the skin. Evaluation studies confirmed that the nanoemulgel possessed acceptable physicochemical properties such as pH, viscosity, spreadability, and stability, making it suitable for topical application. The nanosized droplets enhanced drug solubility and improved penetration through the skin barrier. In-vitro drug release studies showed sustained and controlled release of the drug, which may help in maintaining therapeutic concentration for a longer duration. The antifungal activity against Trichophyton rubrum indicated effective inhibition of fungal growth when compared with conventional formulations. The gel base also improved retention time and ease of application, leading to better patient acceptability.
Overall, the optimized batch F3 nanoemulgel system proved to be a promising approach for enhancing topical antifungal therapy. The formulation may reduce dosing frequency, improve therapeutic efficacy, and minimize recurrence of fungal infections. Hence, Liranaftate nanoemulgel can be considered a beneficial and advanced drug delivery system for the management of superficial fu
5. REFERRANCES
REFERENCES

Prerana Kadam, Priyanka Thorat, Formulation and Evaluation of Antifungal Liranaftate-Loaded Nanoemulgel for Topical Drug Delivery., Int. J. of Pharm. Sci., 2026, Vol 4, Issue 11, 1461-1479. https://doi.org/10.5281/zenodo.24008122
 10.5281/zenodo.24008122