

We use cookies to ensure our website works properly and to personalise your experience. Cookies policy
Department Of Pharmaceutics College Of Pharmaceutical Sciences, Govt Medical College, Kozhikode.
Bacterial conjunctivitis is a common ocular infection requiring effective antimicrobial therapy. Conventional ophthalmic preparations of ciprofloxacin hydrochloride have limited ocular residence time due to tear drainage and blinking, which may reduce therapeutic effectiveness. The present study aimed to formulate, optimize and evaluate ciprofloxacin hydrochloride-loaded chitosan nanoparticles incorporated into a thermoreversible in situ gel for enhanced ocular drug delivery. Ciprofloxacin hydrochloride was characterized by preformulation studies, showing a ?max of 277 nm, saturation solubility of 13.6 ± 0.05 mg/mL in distilled water and 11.4 ± 0.05 mg/mL in simulated tear fluid, an average melting point of 316°C and a DSC endothermic peak at 319°C. FTIR studies confirmed drug identity and compatibility with the selected excipients. Nanoparticles were prepared by ionic gelation using chitosan and sodium tripolyphosphate and optimized using a central composite design. The optimized nanoparticles containing 0.2% chitosan and 0.1% tripolyphosphate exhibited a particle size of 266.8 nm, PDI of 0.25, zeta potential of +20.6 mV, entrapment efficiency of 71.05% and drug content of 35.5%. SEM confirmed spherical nanoparticles. The optimized nanoparticles were incorporated into 19% w/v Poloxamer 407 in situ gel. The formulation showed a gelation temperature of 35.36 ± 0.31°C, gelation time of 66 seconds, pH of 7.2 ± 0.2, solution viscosity of 130 ± 4.1 and gel viscosity of 6454 ± 4.5, with 83% drug content. In vitro release reached 78.5% at 8 hours and followed the Korsmeyer–Peppas model (R² = 0.9954; n = 1.4886), indicating Super Case-II transport. Ex vivo corneal permeation reached 41.07% at 4 hours. The formulation showed antibacterial activity against S. aureus and E. coli, with zones of inhibition of 3.1 ± 0.2 and 3.4 ± 1.2 cm, respectively. Thus, the developed formulation demonstrated sustained drug release, corneal permeation and promising antibacterial activity, indicating its potential for ocular delivery of ciprofloxacin hydrochloride.
Pharmaceutical research on ocular medication delivery devices is both fascinating and extremely difficult1. The intricate anatomical and physiological structure of the eye creates substantial obstacles to the admission of foreign substances, requiring creative approaches to get past these defense mechanisms2. Due to significant drug loss prior to corneal absorption, which restricts therapeutic efficacy, achieving adequate bioavailability at specific ocular locations continues to be a significant issue. The researcher must therefore overcome the many protective barriers of the eye, including the corneal epithelium, tear film, blood-ocular barriers, and high enzymatic activity, without causing long-term tissue damage3. Eye drops are the most common way to administer medication because they are cheap and rarely used. The drawbacks of these conventional formulations include shorter residence times, limited bioavailability, and quick precorneal drainage. Nasolacrimal drainage-induced precorneal medication loss is the key mechanism contributing4,5.
1.1 ANATOMY OF EYE
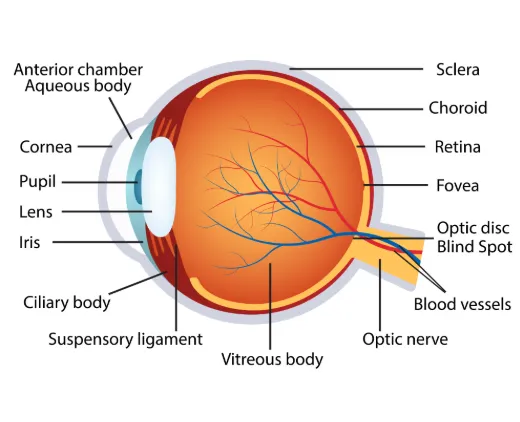
Figure 1.1: Anatomy of Eye
a. The eyeball
The primary component of the eye is the eyeball, sometimes referred to as the globe.The diameter of each sphere-shaped eye is approximately 2.5 cm6. The eyeball contains many blood vessels.. Vitreous humor, a transparent, jelly-like material, makes up the majority of the eyeball's interior. Vitreous fluid fills the back of the eye7. It aids in maintaining the eye's shape and supporting the inside tissues. The outer, middle, and inner layers make up the structure of the eyeball, often known as the wall of the eye.
b. Outer layer
The cornea and sclera make up the fibrous tunic, which is the outermost layer or covering of the wall of the eye.
c. Sclera
The sclera is the thick, white connective tissue that covers much of the outside of the eyeball. The white part of the eye, called the sclera, acts as a barrier. The sclera at the rear of the eye is where the optic nerve and blood vessels pass through. The sclera is connected to the muscles that regulate eye movement.
d. Cornea
the clear, dome-shaped layer at the front of the eye that lets light in. The pupil and iris are covered by the cornea. There are no blood vessels in it8.
e. Middle Layer
The term "vascular tunic" describes the middle layer of the ocular wall. There are three primary components to the uvea: Iris: The iris is the muscular, colorful, and slender portion of the eye. It is situated in the anterior, or front, part of the eye. The white part of the eye called the sclera acts as a barrier between the lens and cornea. The blood vessels and optic nerve Pass through the back of the eye's sclera9. The pupil, the tiny central aperture that regulates how much light enters the eye, is opened and closed by the iris.
f. Choroid:
The retina receives nourishment and oxygen from the choroid, a thin layer of tissue containing numerous tiny blood capillaries. The choroid has a considerable number of melanocytes, which are cells that create pigment. These cells reduce reflections and increase light absorption in the eye10.
g. Ciliary body
Just behind the iris lies the ciliary body. and comes out of the choroid. The ring of muscle tissue helps focus the eyes. It modifies the lens's curvature to concentrate on close or distant objects11. Aqueous humor, the transparent liquid in the front of the eye, is produced by the cells of the ciliary body. between the lens and the cornea.
h. Inner Layer
The layer adjacent to the eye wall is called the neural tunic, sometimes referred to as the retina. The thin layer of cells at the back of the eye called the retina functions similarly to a camera's film. It is composed of nerve cells. that are light-sensitive12. The optic nerve transports information from the brain to the eye, enabling vision.
i. Lens
The interior of the lens is a clear structure. of the eye, just below the iris and cornea. To enable the eye to focus on things, the lens undergoes a shape shift. Light rays are focused onto the retina by the lens13.
j. Orbit
Sometimes called the eye socket, the orbit is a hollow bowl. composed of the connective tissues around the eye and the bone that makes up the skull, which houses the eye. The eye is protected and cushioned by the bone and connective tissues. The eyeball can move in various directions thanks to the muscles that attach to it14. The orbit is made up of bones in the back, and these tiny muscles are connected to the sclera in the front of the eye. Blood arteries, neurons, lipids, and various connective tissues are also found in the orbit.
k. Eyelids
Palpebrae are the folds of skin that encircle and protect the eye.5. To prevent the tears from evaporating and the eyelids from adhering to one another, the glands in the eyelids produce an oily fluid that covers the tear layer. The eyelids are raised and closed by these muscles.
Described are the eyelid's anterior (front) and posterior (back) lamellae.
The anterior lamella is composed of a layer of fatty tissue called skin. It helps protect the eyes by regulating the amount of light that reaches them. 3. The tarsal plates, palpebral conjunctiva, and posterior lamella are composed of a layer of muscle.The tarsal plates consist of two thick, closely spaced plates. tissue that supports and aids in the growth of the upper and lower eyelids. The margins of the eyelid give rise to lashes.
l. Conjunctiva
The conjunctiva is a translucent mucous membrane. A thin, wet layer of tissue lines the gastrointestinal (GI) tract, nose, mouth, lungs, airways, vagina, and other body cavities. This lines the inside and outside of the eyeballs. The conjunctiva secretes mucus. assist in keeping the eyeball hydrated and lubricated16. The portion of the conjunctiva that covers the eyeball's front outer aspect is known as the bulbar conjunctiva. 1. The eyelid's anterior (front) and posterior (back) lamellae are explained. 2. The anterior lamella is composed of the skin, which is a layer of fatty tissue. the layer of connective tissue and muscle fibersIt helps protect the eyes by regulating the amount of light that enters them. 3The posterior lamella is a layer of muscle. The conjunctiva secretes mucus. assist in keeping the eyeball hydrated and lubricated. The tarsal plates consist of two thick, closely spaced plates. tissue that supports the development of the lower and upper eyelids. 4. Lashes emerge from the eyelid's margins. The conjunctival forniceal is the loose fold that forms the conjunctiva along the interior of the eyelid. membrane that envelops the eye. The tarsal or palpebral conjunctiva is the portion of the conjunctiva that covers the inside of the eyelids.The plica is a little fold of conjunctiva tissue located in the inner corner of the eye adjacent to the caruncle.17.
m. Caruncle
The caruncle, a little, pinkish area of the inner canthus, or innermost corner of the eye, contains the conjunctival tissue and sebaceous glands that emit perspiration and oil18.
n. Lacrimal gland
The almond-shaped gland in the top outer corner is called the lacrimal gland, sometimes called the tear gland. Tears are secreted by the lacrimal gland to aid each eye. Both the lining of the eyelids and the surface of the eye should be kept lubricated and moist. Tears reduce friction and prevent infection by clearing the eye of dust and dirt. Lacrimal canaliculi, or tiny lacrimal ducts Tears are drained from the lacrimal gland by the lacrimal punctum, a small hole in the inner corner of each eyelid.
1.1.1 Functions of eye19:
1. The organ that collaborates with the brain to permit vision is the eye. It works like a camera.
2. The eye's primary job is to gather light and convert it into electrical impulses that are transmitted to the brain.
3. Even if we lose one eye, we can still see. most of what was already noted. Light first travels through the cornea before entering the eye.
4. The iris modifies the amount of light that enters the eye after it has passed through the pupil.
5. After that, the light passes through the lens of the eye. Light beams are focused by the lens onto the retina, where they are converted into a signal that is sent to the brain by the optic nerve.
1.1.2 Ocular Drug Delivery System Benefits20
1. a more precise dosing. to get around the negative consequences of standard techniques' pulsed dosage.
2. to administer medication properly and regularly.
3. to extend the corneal contact time in order to improve the drug's ocular bioavailability. This is feasible. by successfully adhering to the eye's surface.
4. to prevent loss to other eye tissues by offering targeting within the ocular globe.
5. to get past defense mechanisms such conjunctival absorption, lacrimation, and drainage.
6. a more precise dosing. to get around the negative consequences of standard techniques' pulsed dosage.
7. to administer medication properly and regularly.
8. to extend the corneal contact time in order to improve the drug's ocular bioavailability. This is feasible. by successfully adhering to the eye's surface.
9. to prevent loss to other eye tissues by offering targeting within the ocular globe.
10. to get past defense mechanisms such conjunctival absorption, lacrimation, and drainage
1.1.3 Ocular Drug Delivery System Drawbacks21
1. The drug solution is only momentarily visible on the eye's surface.
2. Its bioavailability is poor.
3. shows how brittle the medication is after dissolving.
4. Preservatives must be used.
1.1.4 Ocular Drug Delivery Limitations21
1. The dosing form cannot be discontinued in an emergency.
2. interference with vision.
3. Removal and placement are difficult.
4. Occasionally losing something while sleeping or wiping your eyes
1.2 Conjunctivitis
Conjunctivitis, commonly known as "pink eye," is an inflammatory disorder of the conjunctiva, the thin, transparent mucous membrane that lines the inner surface of the eyelids (palpebral conjunctiva) and covers the anterior sclera (bulbar conjunctiva). The conjunctiva serves as a protective barrier for the ocular surface by maintaining tear film stability, facilitating immune surveillance, and preventing microbial invasion. Inflammation of this membrane results in conjunctival hyperemia,edema, excessive tearing, ocular discomfort, and discharge. Conjunctivitis is one of the most common ocular diseases encountered in ophthalmic practice, accounting for a significant proportion of outpatient eye consultations worldwide. Although the condition is generally self-limiting, untreated or improperly managed cases may lead to corneal involvement, visual impairment, or transmission of infection, particularly in contagious forms22.
Conjunctivitis affects individuals of all age groups, from neonates to the elderly. The incidence is higher among children due to close interpersonal contact in schools and daycare centers, whereas adults are more frequently affected by allergic and viral conjunctivitis. The disease has substantial socioeconomic implications because of work absenteeism, school exclusion, healthcare expenditures, and the inappropriate use of topical antibiotics. Early diagnosis and appropriate management are therefore essential to reduce complications and prevent unnecessary antimicrobial use23.
1.2.1 Classification of Conjunctivitis
Conjunctivitis is broadly classified into infectious and non-infectious types.
1. Infectious Conjunctivitis
a) Bacterial Conjunctivitis
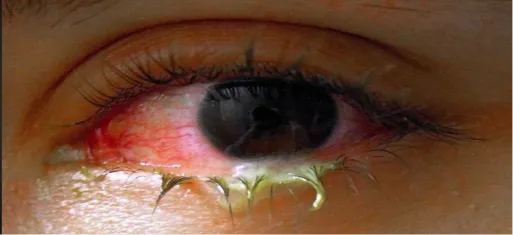
Fig 1.2 bacterial conjunctivitis
Bacterial conjunctivitis results from infection of the conjunctival epithelium by pathogenic bacteria. It is characterized by acute onset, conjunctival redness, purulent or mucopurulent discharge, eyelid edema, and eyelids sticking together upon awakening.
The most common causative organisms include:
Acute bacterial conjunctivitis is highly responsive to topical antibiotics, including ciprofloxacin, ofloxacin, moxifloxacin, and gatifloxacin24.
b) Viral Conjunctivitis
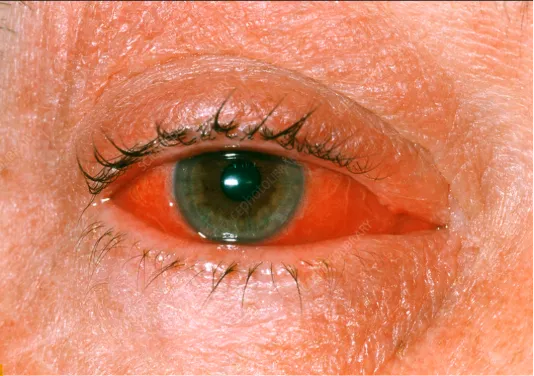
Figure 1.3: Viral Conjunctivitis
Viral conjunctivitis is the most common infectious conjunctivitis worldwide and is highly contagious. Adenoviruses account for nearly 80% of viral conjunctivitis cases. Other causative viruses include herpes simplex virus, varicella-zoster virus, enteroviruses, and coxsackievirus.Watery discharge, conjunctival hyperemia, follicular response, foreign body sensation, photophobia, and preauricular lymphadenopathy are among the clinical symptoms.Epidemic keratoconjunctivitis, caused by adenovirus serotypes 8, 19, and 37, represents one of the most severe forms.
c) Chlamydial Conjunctivitis
This chronic follicular conjunctivitis is caused by Chlamydia trachomatis. Adult inclusion conjunctivitis is sexually transmitted, whereas neonatal conjunctivitis occurs during vaginal delivery from infected mothers.
d) Gonococcal Conjunctivitis
Caused by Neisseria gonorrhoeae, this severe hyperacute bacterial infection produces copious purulent discharge and may rapidly progress to corneal ulceration and perforation if untreated. It requires immediate systemic antibiotic therapy.
2. Non-Infectious Conjunctivitis
a) Allergic Conjunctivitis
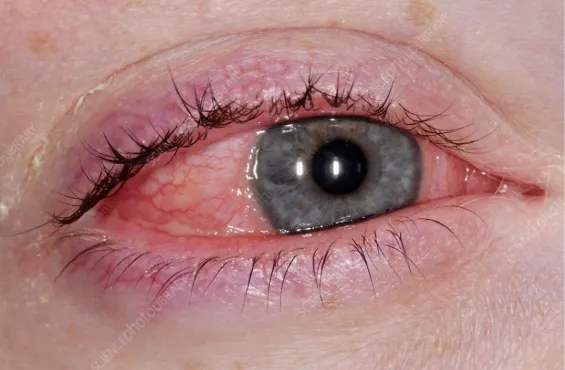
Figure 1.4: Allergic Conjunctivitis
Allergic conjunctivitis is an IgE-mediated hypersensitivity reaction induced by environmental allergens such as pollen, dust mites, animal dander, molds, and cosmetics.
Symptoms include:
Major forms include:
b) Chemical and Toxic Conjunctivitis
This results from exposure to acids, alkalis, smoke, chlorine, cosmetics, preservatives, or medications. Immediate irrigation is essential to minimize ocular damage.
c) Mechanical Conjunctivitis
Mechanical irritation due to contact lenses, ocular prostheses, sutures, or foreign bodies can produce chronic inflammation of the conjunctiva25.
1.2.2 Etiology and Risk Factors
Several factors predispose individuals to conjunctivitis:
1.3 Bacterial Conjunctivitis
Bacterial conjunctivitis is an acute or chronic infection of the conjunctiva caused by pathogenic bacteria. It is one of the most common ocular infections encountered in primary care and ophthalmology clinics and represents a significant cause of ocular morbidity, particularly among children. The condition is characterized by inflammation of the conjunctival epithelium, resulting in conjunctival hyperemia, mucopurulent discharge, eyelid edema, and ocular discomfort. Although bacterial conjunctivitis is usually self-limiting, prompt diagnosis and treatment are important to reduce the duration of symptoms, prevent transmission, and minimize complications such as keratitis or corneal ulceration. The disease is highly contagious and spreads through direct contact with infected ocular secretions, contaminated hands, towels, cosmetics, contact lenses, or ophthalmic instruments.
1.3.1 Etiology
Acute bacterial conjunctivitis is caused by a wide range of Gram-positive and Gram-negative microorganisms. The causative organisms vary with age, geographic location, and host immune status. In adults, Staphylococcus aureus is the most common pathogen, whereas Haemophilus influenzae, Streptococcus pneumoniae, and Moraxella catarrhalis predominate in children. Contact lens wearers are particularly susceptible to infections caused by Pseudomonas aeruginosa, which may rapidly progress to corneal ulceration if untreated. Hyperacute conjunctivitis is usually caused by Neisseria gonorrhoeae, while chronic follicular conjunctivitis may result from Chlamydia trachomatis infection.
1.3.2 Pathophysiology
The infection begins when pathogenic bacteria adhere to the conjunctival epithelial cells using bacterial adhesins and surface proteins. After colonization, bacterial multiplication stimulates the release of endotoxins, exotoxins, and other virulence factors that activate the innate immune response. Resident macrophages, dendritic cells, and epithelial cells produce inflammatory mediators such as interleukin-1 (IL-1), interleukin-6 (IL-6), interleukin-8 (IL-8), tumor necrosis factor-alpha (TNF-α), and prostaglandins. These mediators promote vasodilation, increased vascular permeability, and recruitment of neutrophils to the infected tissue. Neutrophil infiltration leads to the formation of mucopurulent exudate, while conjunctival blood vessel dilation produces the characteristic redness of the eye. Persistent inflammation may extend to the cornea, causing keratitis or corneal ulceration in severe cases.
1.3.3 Clinical Manifestations
The onset of bacterial conjunctivitis is usually acute, affecting one eye initially before spreading to the opposite eye within 24–48 hours. Patients commonly present with conjunctival redness, mucopurulent or purulent discharge, foreign body sensation, burning, mild pain, excessive lacrimation, and eyelid swelling. A characteristic feature is the sticking together of the eyelids upon awakening due to accumulated purulent secretions. Mild photophobia and transient blurred vision may occur because of excessive discharge. Unlike allergic conjunctivitis, itching is usually absent or minimal. Severe infections caused by Neisseria gonorrhoeae may produce profuse purulent discharge, marked chemosis, severe pain, and rapid corneal involvement requiring emergency treatment.
1.3.4 Diagnosis
The diagnosis of bacterial conjunctivitis is primarily based on patient history and clinical examination. Slit-lamp biomicroscopy typically reveals diffuse conjunctival hyperemia, papillary reaction, mucopurulent discharge, and eyelid edema. Laboratory investigations are generally unnecessary in uncomplicated cases but are recommended for severe, recurrent, neonatal, chronic, immunocompromised, or treatment-resistant infections. Conjunctival swabs may be subjected to Gram staining, bacterial culture, antimicrobial susceptibility testing, or polymerase chain reaction (PCR) for identification of atypical pathogens such as Chlamydia trachomatis and Neisseria gonorrhoeae.
1.3.5 Treatment
Management aims to eradicate the causative organism, relieve symptoms, prevent complications, and reduce disease transmission. Mild cases may resolve spontaneously within one to two weeks; however, topical antibiotics shorten the duration of symptoms and decrease bacterial shedding. Broad-spectrum ophthalmic antibiotics commonly used include ciprofloxacin, ofloxacin, moxifloxacin, gatifloxacin, levofloxacin, tobramycin, chloramphenicol, polymyxin B–trimethoprim, and fusidic acid. Contact lens wear should be discontinued during treatment, and patients should maintain strict hand hygiene and avoid sharing personal items. Hyperacute gonococcal conjunctivitis requires immediate systemic antibiotic therapy and urgent ophthalmologic referral because of the high risk of corneal perforation26.
1.4 ciprofloxacin hydrochloride
Ciprofloxacin hydrochloride is a second-generation fluoroquinolone antibiotic widely used in ophthalmology for the treatment of bacterial infections of the eye, including bacterial conjunctivitis, keratitis, corneal ulcers, and blepharitis. It is the hydrochloride salt of ciprofloxacin, formulated to improve aqueous solubility and stability for pharmaceutical preparations. Due to its broad-spectrum antibacterial activity, rapid bactericidal action, and excellent ocular penetration, ciprofloxacin hydrochloride is one of the most commonly prescribed antibiotics in ophthalmic drug delivery systems. It is particularly effective against both Gram-positive and Gram-negative pathogens responsible for ocular infections, including Staphylococcus aureus, Streptococcus pneumoniae, Haemophilus influenzae, Moraxella catarrhalis, and Pseudomonas aeruginosa.
In conventional ophthalmic eye drops, ciprofloxacin hydrochloride exhibits limited ocular bioavailability because of rapid tear turnover, blinking, and nasolacrimal drainage, resulting in less than 5% of the administered dose reaching the intraocular tissues. Consequently, frequent dosing is required to maintain therapeutic drug concentrations, which may reduce patient compliance. To overcome these limitations, advanced ocular drug delivery systems such as nanoparticle-loaded in situ gels have been developed to prolong precorneal residence time, enhance corneal penetration, provide sustained drug release, and improve therapeutic efficacy.
1.4.1 Mechanism of Action
Ciprofloxacin hydrochloride exerts its antibacterial effect by selectively inhibiting two essential bacterial enzymes: DNA gyrase (topoisomerase II) and topoisomerase IV. DNA gyrase is responsible for introducing negative supercoils into bacterial DNA, facilitating DNA replication and transcription, whereas topoisomerase IV is involved in the separation of replicated chromosomal DNA during bacterial cell division. Inhibition of these enzymes prevents DNA replication, transcription, repair, and chromosome segregation, ultimately leading to bacterial cell death. Because ciprofloxacin causes irreversible damage to bacterial DNA, it exhibits a bactericidal rather than bacteriostatic effect.
1.4 Ionic Gelation Technique
The ionic gelation method involves electrostatic interaction between positively charged chitosan and negatively charged sodium tripolyphosphate (TPP). Chitosan is dissolved in dilute acetic acid to produce a positively charged polymer solution, while TPP is dissolved separately in distilled water. Under continuous magnetic stirring, the TPP solution is slowly added to the chitosan solution. Instantaneous ionic cross-linking between protonated amino groups of chitosan and phosphate groups of TPP results in the spontaneous formation of nanosized particles.
For drug-loaded formulations, ciprofloxacin hydrochloride is dissolved or dispersed in the chitosan solution before addition of TPP. During nanoparticle formation, the drug becomes entrapped within the polymeric matrix, producing nanoparticles with high encapsulation efficiency and controlled-release characteristics.
1.4.1 Mechanism of Mucoadhesion
The ocular surface is covered by a mucus layer composed mainly of mucins that contain negatively charged sialic acid residues. Chitosan nanoparticles possess positively charged amino groups that interact electrostatically with these negatively charged mucins. In addition to ionic interactions, hydrogen bonding and van der Waals forces further strengthen adhesion to the ocular surface.This strong mucoadhesion prolongs the retention of nanoparticles on the cornea and conjunctiva, minimizes precorneal drug loss, increases drug absorption, and significantly improves ocular bioavailability.
1.4.2 Mechanism of Enhanced Corneal Permeation
Chitosan nanoparticles improve ocular drug delivery through several complementary mechanisms:
1.7.3 Advantages of Chitosan Nanoparticles
Chitosan nanoparticles provide numerous advantages for ophthalmic drug delivery:
1.5 Ocular In Situ Gel
Ocular in situ gel is an advanced ophthalmic drug delivery system designed to overcome the limitations associated with conventional eye drops. It is formulated as a low-viscosity liquid before administration and undergoes a sol-to-gel transition upon instillation into the eye in response to specific physiological stimuli such as changes in temperature, pH, or ionic composition of the tear fluid. This transformation results in the formation of a viscoelastic gel on the ocular surface, thereby increasing the residence time of the drug, reducing precorneal elimination, and enhancing drug bioavailability. Due to these advantages, ocular in situ gels have emerged as a promising alternative to conventional ophthalmic formulations for the treatment of various anterior segment eye diseases, including bacterial conjunctivitis, glaucoma, dry eye syndrome, allergic conjunctivitis, and postoperative inflammation32.
The human eye possesses several anatomical and physiological barriers that significantly limit the effectiveness of topically administered drugs. After instillation of conventional eye drops, approximately 90–95% of the administered dose is rapidly lost due to blinking, tear turnover, nasolacrimal drainage, and limited corneal permeability. Consequently, only a small fraction (typically less than 5%) of the drug reaches the intraocular tissues, necessitating frequent dosing to maintain therapeutic drug concentrations. Frequent administration not only reduces patient compliance but also increases the risk of systemic absorption through the nasolacrimal duct, potentially leading to undesirable side effects. Ocular in situ gel systems effectively address these challenges by forming a gel depot on the ocular surface, thereby prolonging contact with the cornea and conjunctiva and allowing sustained drug release over an extended period33.
The mechanism of gel formation depends on the type of stimulus-responsive polymer employed in the formulation. Thermosensitive in situ gels remain in a liquid state at room temperature and rapidly gel at ocular surface temperature (approximately 34–35°C). Poloxamer 407 and Poloxamer 188 are the most commonly used thermosensitive polymers because of their reversible gelation behavior and excellent biocompatibility. pH-sensitive systems utilize polymers such as Carbopol, which remain fluid at acidic pH during formulation but undergo gelation upon exposure to the physiological tear pH of approximately 7.4. Ion-sensitive in situ gels are formulated using polymers such as sodium alginate, gellan gum, or deacetylated gellan gum, which interact with divalent cations (Ca²⁺ and Mg²⁺) naturally present in tear fluid to form a stable gel network immediately after administration (2–4).An ideal ocular in situ gel should possess several critical characteristics to ensure therapeutic efficacy and patient acceptability. It should exhibit low viscosity before administration to facilitate easy instillation, rapid gelation upon contact with tear fluid, sufficient mechanical strength to resist tear drainage, excellent transparency to avoid interference with vision, non-irritancy, sterility, isotonicity, appropriate pH, and prolonged drug release characteristics. The formulation should also possess adequate mucoadhesive properties to improve retention on the ocular mucosal surface while maintaining patient comfort. The gel formed should not produce blurred vision or foreign body sensation and should be easily removed by normal tear turnover after complete drug release.The incorporation of nanoparticles into ocular in situ gels has further revolutionized ophthalmic drug delivery. Nanoparticles serve as drug reservoirs capable of protecting the encapsulated drug from degradation while providing controlled and sustained drug release. When dispersed within an in situ gel matrix, nanoparticles combine the advantages of nanotechnology with prolonged ocular residence offered by the gel system. This dual-delivery strategy enhances drug penetration across the corneal epithelium, increases therapeutic efficacy, reduces dosing frequency, minimizes systemic absorption, and improves patient compliance. Chitosan nanoparticles, PLGA nanoparticles, lipid nanoparticles, and nanoemulsions are among the most extensively investigated nanoparticulate systems for ocular applications. In antibacterial therapy, ciprofloxacin hydrochloride-loaded chitosan nanoparticles incorporated into in situ gels have demonstrated prolonged drug release, enhanced antibacterial activity, and improved corneal permeation compared with conventional eye drops34.
Ocular in situ gels offer numerous advantages over conventional ophthalmic dosage forms. These include prolonged precorneal residence time, enhanced corneal permeability, sustained and controlled drug release, reduced frequency of administration, improved patient compliance, minimized drug wastage through tear drainage, reduced systemic side effects, greater bioavailability, improved therapeutic outcomes, and increased formulation stability.Despite these advantages, ocular in situ gel systems also possess certain limitations. The formulation process requires careful optimization of polymer concentration to achieve appropriate gelation without excessive viscosity. High polymer concentrations may produce blurred vision, ocular discomfort, or foreign body sensation. Environmental conditions such as storage temperature and pH may influence formulation stability. Sterility must be maintained throughout manufacturing and storage, and long-term stability studies are essential to ensure consistent gelation behavior and drug release characteristics (2–4). Over all, ocular in situ gel technology represents one of the most promising advancements in ophthalmic drug delivery. By combining the ease of administration associated with conventional eye drops and the prolonged retention characteristics of ophthalmic gels, these systems significantly improve ocular bioavailability and therapeutic efficacy. The incorporation of nanocarriers, particularly chitosan nanoparticles loaded with ciprofloxacin hydrochloride, further enhances sustained drug release, ocular penetration, and antimicrobial effectiveness. Consequently, nanoparticle-loaded ocular in situ gels have attracted considerable research interest as an effective strategy for the management of bacterial conjunctivitis and other anterior segment ocular diseases, offering the potential for improved clinical outcomes and enhanced patient adherence35.
3.1 AIM
3.2 OBJECTIVES
METHODS
4.1 PREFORMULATION STUDIES
4.1.1. ANALYSIS OF DRUG
4.1.1.1. Physical appearance of the drug
The physical appearance of the drug including state, colour, and crystallinity, was observed visually56.
4.1.1.2 Identification of the drug by IR spectroscopic analysis
FTIR spectrometry was primarily used to characterize the crystalline forms by analysing the position and intensity of characteristic peaks. FTIR spectra were recorded using an FTIR spectrometer equipped with the ATR technique, over a wavenumber range of 4000 to 400 cm⁻¹. In the ATR method, the sample was pressed against a high refractive-index prism, allowing infrared light to undergo total internal reflection within the prism and interact with the sample surface. The resulting spectrum was then compared with a reference spectrum to confirm the structural identity57.
4.1.1.3. Differential scanning calorimetry
The thermal profile of ciprofloxacin hydrochloride was analysed using differential scanning calorimetry. A 4 mg sample was sealed in an aluminium pan and heated under a nitrogen atmosphere from 25°C to 320°C at a rate of 10°C/min, and the corresponding thermogram was recorded58.
4.1.1.4 Determination of Melting Point
Capillary melting point method: A small quantity of drug was placed in a sealed capillary tube, which was positioned alongside a thermometer. The assembly was immersed in liquid paraffin and gradually heated until the drug began to melt. The temperature at which melting occurred was noted as the melting point59.
4.1.1.5 Saturation solubility study
The saturation solubility of ciprofloxacin hydrochloride was determined in distilled water and stimulated tear fluid using the shake flask method. 5 mL of each solvent were placed in separate vials, and an excess quantity of drug was added to achieve supersaturation. The mixtures were shaken in a water bath shaker for 24 hours, followed by centrifugation. The supernatant was suitably diluted and analyzed using a UV Visible spectrophotometer at 271 nm60.
4.1.1.6 Loss on drying
1g of pure drug was accurately weighed into a pre-weighed crucible. The sample was dried in an oven at 60°C for 3h and reweighed. The percentage loss on drying was calculated using the formula61:
Loss on drying =(initial weight-final weight )/(initial weight)×100
4.1.1.7. Analytical method for estimation of drug
a) preparation of simulated tear fluid (pH 7.4)
Dissolved 0.670g of NaCL,0.200g of NaHCO3, and 0.008g of CaCL2 in 80 ml water. The physiological pH of tear is around 7.4 so pH of the solution adjusted to 7.4 using either 0.1N NaOH or 0.1N HCL. Then volume made up to 100ml using distilled water.
b) Determination of λmax of ciprofloxacin HCL
10mg of ciprofloxacin HCL was weighed into a 100ml volumetric flask and dissolve small quantity of drug with 0.1N HCL then make up to 100ml (100µg/ml) stock solution A.1ml was pipetted out and transferred into 10 ml volumetric flask and made up to 10ml (10µg/ml) stock solution B. The absorption spectrum was recorded by using UV-visible spectrophotometer at 277nm.
c)preparation of calibration curve of ciprofloxacin hcl in simulated tear fluid pH (7.4)
10mg ciprofloxacin HCL was accurately weighed into 100 ml volumetric flask and disslove it and make upto the volume upto 100 ml with simulated tear fluid to obtain stock solution (100µg/ml).From the stock solution 10ml was pipetted out and made upto 100ml to obtain concentration equivalent to (10µg/ml)From the solution 0.2ml was pipetted out and made up to 10 ml to obtain 2µg/ml solution .Similarly transferred the accurately measured aliquots into a series of 10ml volumetric flask to obtain concentrations of 4,6,8,and 10µg/ml.The absorbance of the solutions were analysed spectrophotometrically at 271nm using simulated tear fluid as blank62,63.
4.1.2 ANALYSIS OF EXCIPIENTS
4.1.2.1 Physical appearance
The physical appearance of chitosan and tripolyphosphate was observed visually.
4.1.2.2 Identification of excipient by FTIR spectroscopic analysis
The infrared spectra of chitosan and tripolyphosphate were obtained using ATR-FTIR spectroscopy in the range 4000–400 cm⁻¹ and compared with reference spectrum.
4.1.3 DRUG EXCIPIENT COMPATIBILITY STUDY
4.1.3.1 IR spectroscopic analysis of physical mixture
The compatibility between the drug and various excipients was assessed using IR spectroscopy through peak matching. Physical mixtures of the drug with different excipients were analyzed spectroscopically, and the resulting peaks were compared to the standard. The spectrum was examined for any appearance or disappearance of significant and minor peaks64,65,66.
4.2 PREPARATION OF CIPROFLOXACIN HCL LOADED CHITOSAN NANOPARTICLES
Ciprofloxacin hydrochloride-loaded chitosan nanoparticles were prepared by ionic gelation method. chitosan was used as the polymer and sodium tripolyphosphate (TPP)as the crosslinking agent.
4.2.1 IONIC GELATION METHOD67
Preparation of chitosan solution:
Preparation of TPP solution
Formation of nanoparticles
Purification
Drying
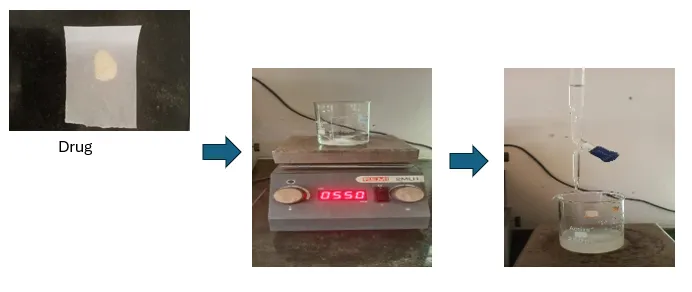
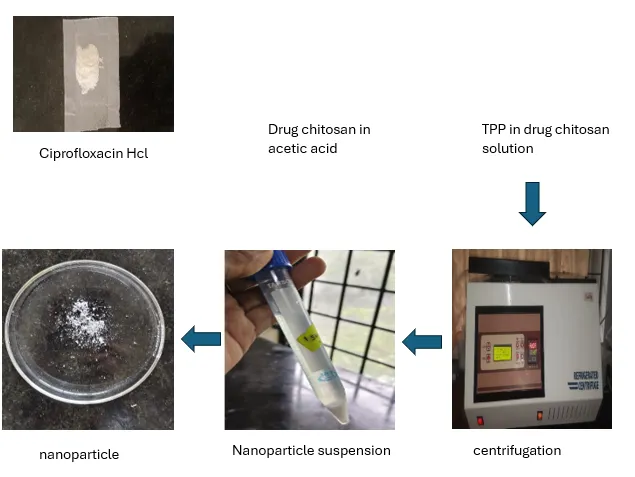
Figure 4.1: Preparation of Ciprofloxacin Incorporated Nanoparticles
4.3 OPTIMIZATION OF CIPROFLOXACIN HCL LOADED CHITOSAN NANOPARTICLES
The influence of process variables on particle size and percentage drug encapsulation during the preparation of ciprofloxacin loaded chitosan nanoparticle was evaluated using Design of Experiments (DoE).
4.3.1. Development of Experimental design (DoE)
Stat-Ease Design-Expert software version -13 was used to develop the experimental design. The software suggested a Central Composite Design (CCD), and the selected constraints are summarized in the table below.
| Variables | constraints | |
|---|---|---|
| Independent variables | Lower limit | Upper limit |
| Chitosan concentration (%) | 0.1 | 0.3 |
| Tripolyphosphate concentration (%) | 0.05 | 0.15 |
| Dependent variable | goal | |
| Particle size(µm) | minimize | |
| Entrapment efficiency(%) | maximize | |
4.3.2 Analysis of the experimental design using DoE
The obtained data were analyzed separately using various tools, including data transformation, fit summary, f (x) models, and ANOVA. Various diagnostic plots were also used to detect or identify any variations in the response by any of the selected combinations of input parameters.
4.3.3. Optimization of the formula using DoE
The best formulation was determined using the Design Expert Stat Ease software trial version. A central composite design was used. All 13 developed formulations were subjected to evaluations like particle size determination and encapsulation efficiency. Counter plots were drawn, and the optimized formulation was selected69.
4.3.4. Confirmation of the formulation after optimization
Numerical and graphical optimization tools were applied to validate the formulation. Criteria for factors and responses were established based on the study objectives. Different combinations of factors and responses were analyzed using suggested solutions, counter plots, and overlay plots to confirm the optimized formulation.
4.4 EVALUATION OF OPTIMIZED CHITOSAN NANOPARTICLE
4.4.1. Determination of particle size, polydispersity index and zetapotential70
The particle size, polydispersity index and zeta potential of the developed ciprofloxacin nanoparticle were evaluated by the dynamic light scattering method using the Zeta sizer device (HORIBA SZ-100
4.4.2 Entrapment efficiency
The Entrapment efficiency of the prepared nanoparticle was determined by an indirect method, in which nanoparticle were separated from the aqueous medium containing unentrapped nanoparticle by ultracentrifugation at 10000 rpm for 10 min at 4°C using a cooling ultracentrifuge. Then the free nanoparticle in the supernatant was determined at λmax 271 nm using a UV spectrophotometer.
EE (%) =(total amount of drug-unentrapped drug)/(total amount of drug)×100
4.4.3. Scanning electron microscopy
The surface morphology of optimized chitosan nanoparticle was examined using scanning electron microscopy (SEM). The samples were mounted on a copper sample holder, sputter-coated with gold, followed by carbon, and then analyzed for surface characteristics71.
4.4.4. Drug content determination
To determine the drug content, a known quantity of nanoparticle corresponding to 10 mg of drug was dissolved in 10 mL of ethanol and simulated tear fluid pH 7.4 (1:1) mixture and sonicated for 2 hour for complete extraction .the absorbance was measured at 271 nm using a UV–Visible spectrophotometer72.
4.4.5. In vitro drug release study
In vitro drug release study of optimized nanoparticle were carried out in simulated tear fluid pH 7.4 by dialysis bag method. the optimized ciprofloxacin loaded nanoparticle equivalent to 10mg of ciprofloxacin were filled into the dialysis bag and immersed in 50ml of release media, magnetically stirred at 200rpm and maintained at body temperature of 37±0.5℃, throughout the experiment.at selected time intervals (1,2,3,4,5,6,8,12,24h)5ml aliquots of release media were withdrawn from the beaker and replace with an equal volume of fresh medium to maintain sink conditions. the concentration of ciprofloxacin hcl in the samples was determined by uv spectrophotometry at 271nm73.
4.5. FORMULATION OF THERMOREVERSIBLE IN SITU FORMING PLAIN GEL
Cold method
Poloxamer 407 was accurately weighed and gradually added to cold distilled water (5-10 °C) under continuous magnetic stirring to achieve concentrations of 15–20% w/v. The mixture was sealed and refrigerated at 5°C overnight until a clear solution was obtained.
4.5.1. Determination of Gelation Temperature of plain gel
The gelation temperature was determined using the test tube tilt technique. A thin-walled tube containing 1 mL in situ gel was placed in a water bath at 4 ºC. the temperature of the water bath was increased slowly in increments of 2ºC and left to equilibrate for 5 minutes at each new setting. The formulation transformed from a free flowing liquid (sol) to a non-flowing gel-like substance when the tube was inverted. This temperature was identified as the gelation temperature.
4.6. FORMULATION OF GEL INCORPORATED WITH CIPROFLOXACIN NANOPARTICLES
The gel formulation containing ciprofloxacin nanoparticles was prepared using the cold method. Accurately weighed Poloxamer 407 was dispersed in distilled water with agitation to produce an 18% w/v solution. The partially dissolved solution was refrigerated for 24 h until complete dissolution. nanoparticles equivalent to 10mg were dispersed in the Poloxamer solution and mixed uniformly74,75.
4.7. EVALUATION OF IN SITU FORMING DEPOT
4.7.1. Determination of gelation temperature
The gelation temperature was determined by tube inversion method. 1 ml aliquot of the sample was transferred into test tubes and it was placed in a water bath at 4ºC. The temperature of water bath was increased slowly in increments of 2°C and left to equilibrate for 5 minutes at each new setting. The samples were then examined for gelation, which was occurred when the meniscus would no longer move upon tilting the test tube through 90º. The temperature at which gel formation occurred was noted.
4.7.2. Determination of gelation time
About 1 mL of formulation was taken in a test tube and placed in a thermostatically controlled water bath at the gelation temperature. The time required for sol-to-gel conversion was recorded when no flow occurred upon inversion.
4.7.3. Determination of pH
A digital pH meter was used to measure the pH. 5 mL aliquot was taken, and the electrode was immersed in the solution. After equilibration for 1 min, the steady reading was recorded. The measurement was performed in triplicate.
4.7.4. Viscosity
Viscosity was determined using a Brookfield viscometer. Measurements were performed in both solution and gel states. For gels, a small sample adapter was used at 30 rpm, while for solutions, a T-bar spindle (Helipath, No. 96) was used at 80 rpm76.
4.7.5. Drug content
The drug content of the in-situ gel formulation was determined by accurately measuring 1 mL of the sample equivalent to 10 mg of ciprofloxacin. The weighed sample was first dissolved in a STF–ethanol (1:1) mixture. The solution was sonicated for 2 hours to ensure complete extraction, appropriately diluted with Simulated tear fliud (pH7.4), and then filtered. The absorbance of the resulting solution was measured at 271 nm using a UV–Visible spectrophotometer, and the drug content was calculated from the standard calibration curve77.
4.7.6 IR Spectroscopic analysis of nanoparticle-loaded insitu gel
The spectrum of optimized thermoreversible in situ forming gel containing nanoparticle of ciprofloxacin was determined by FTIR spectroscopy and compared with the spectrum of pure drug to verify the interaction profile of the drug with the excipients78.
4.7.7. Differential scanning colorimetry
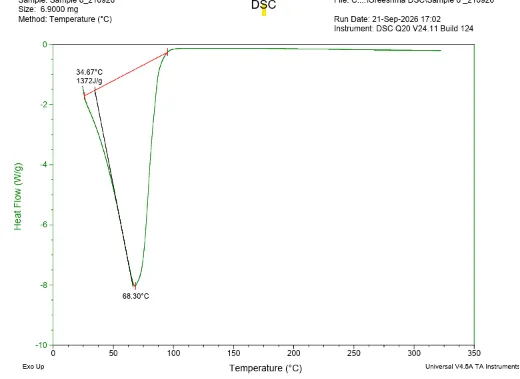
DSC was used to evaluate the thermal stability of the final formulation. The sample was placed in an aluminium pan and dried under a nitrogen stream. Thermal behaviour was studied in the temperature range of 25–320 °C, with a heating rate of 10 °C/min. The corresponding DSC thermogram was then obtained79.
4.7.8. In vitro drug release from thermoreversible in-situ forming gel
The in vitro drug release study was performed using a dialysis membrane. The dialysis bag was pre-soaked in simulated tear fluid for 12 hours to ensure proper wetting. nanoparticle-loaded in situ gel formulation equivalent to 10 mg of was placed inside the bag, and both ends were securely tied. The bag was then immersed in 50ml of simulated tear fluid (Ph7.4)maintained at 37 ± 0.5 °C. The receptor medium was continuously stirred at 200 rpm using a magnetic stirrer. At predetermined 24-hour intervals, 5 mL of the release medium was withdrawn and immediately replaced with an equal volume of fresh simulated tear fluid to maintain sink conditions. The collected samples were analyzed for drug content by measuring absorbance at 271 nm using a UV spectrophotometer.
IN VITRO DRUG RELEASE KINETICS STUDIES OF IN-SITU GEL
The results of in vitro drug release profiles obtained for the formulated sustained release in situ gel were fitted into four models of data treatment as follows:
1. Cumulative percentage drug released versus time (Zero order kinetic model)
2. Log cumulative percentage drug remaining versus time (First order kinetic model)
3. Cumulative percentage of drug released vs square root of time (Higuchi's model)
4. Log cumulative percentage drug released versus log time (Korsmeyer-Peppas)
Zero-order kinetics
Zero-order release kinetics is represented by the following mathematical equation
At = A0 – K0 t.
Where,
At = Cumulative amount of drug released at time t.
A0 = Initial drug concentration
K0 t= 2 order rate constant (hr-1)
If the data is plotted as cumulative percentage drug release against time and the resulting graph is linear, this indicates that the data follows zero-order release kinetics, with a negative slope equal to k0
First- order kinetics
The first-order drug release model can be expressed by the following equation
Log C = Log C0- Kt/2.303
Where,
C = Amount of drug remaining at time 't'.
C0 = Initial amount of drug.
K= Rate constant in 1st order (hr-1)
If data is depicted as the logarithm of the cumulative percentage of drug remaining versus time and results in a straight line, this indicates that the release follows Best order kinetics. The constant & can be calculated by multiplying 2.303 by the slope of the line.
Higuchi's model
Drug released from the matrix devices can be described by the following Higuchi's classical diffusion equation. Q = (Dδ/τ (2A-δCs) Cs t] 0.5
Where, Q = Drug released at t
D = Drug diffusion coefficient in matrix
A = Total drug amount in unit volume of matrix
Cs= Drug solubility in diffusion medium
δ = Porosity (matrix)
τ = Tortuosity (matrix)
t = The time (hrs) at which Q is increased.
The equation may be simplified if one assumes that D, C, and A are constant. Then the equation becomes,
Q = K t 1/2
As the data is given according to the equation, ie, cumulative drug released versus the square root of time, resulting in a straight line indicating that the release of drug was by a diffusion mechanism, and the slope is K.
Korsmeyer Peppas model
The rate of release from the delayed release polymer matrices can be described as follows, proposed by Korsmeyer et al.
Q =Ktn
Where, Q= the % of drug released at 't'.
K = Kinetic constant
n= The diffusion exponent indicative of the release mechanism.
In the above model, the value of n shows the release mechanism of the drug.
| Diffusion exponent | Diffusion mechanism |
|---|---|
| <0.45 | Fickian mechanism |
| 0.45<n<0.89 | Non-fickian mechanism |
| 0.89 | Case 2 transport |
| 1 | Super case 2 transport |
4.7.9 Ex vivo permeation study
The ex vivo drug permeation study was carried out using freshly isolated goat cornea mounted at one end of the diffusion tube,and then it was immersed in 100ml of STF maintained at 37±0.5℃ on a magnetic stirrer to simulate ocular physiological conditions.The insitu gel was positioned on the epithelial side of the cornea,and aliquots were withdrawn from the receptor compartment at predetermined intervals.an equal volume of fresh STF was replaced immediately to maintain sink conditions, and the collected samples were analyzed spectrophotometrically at 271nm to quantify the drug content80.
4.7.10 Antibacterial study
The antibacterial activity of ciprofloxacin hydrochloride-loaded chitosan nanoparticles (CP-CSNPs) and CP-CSNP-loaded in situ gel was evaluated by the agar well diffusion method against Staphylococcus aureus. Sterile agar plates were prepared and inoculated uniformly with standardized bacterial suspensions. Wells of about 6–8 mm diameter were made aseptically and equal volumes of the test formulations were added. Ciprofloxacin HCl was used as the reference, while blank insitu gel and ciprofloxacin hcl in situ gel served as controls. The plates were incubated under appropriate conditions for the respective organisms. After incubation, the zone of inhibition (ZOI) around each well was measured in mm. The experiment was performed in triplicate, and results were expressed as mean ± SD81.
RESULTS AND DISCUSSION
5.1 PREFORMULATION STUDIES
5.1.1 ANALYSIS OF DRUG
5.1.1.1 physical appearance of drug
The appearance of the drug was observed visually. Ciprofloxacin was found to be pale yellow, odorless and crystalline powder and complies with the reported description of the drug
5.1.1.2. Identification by IR spectrophotometric analysis
The identification of the pure drug sample was carried out using IR spectroscopy in the range of 400-4000cm-1. The obtained spectrum of ciprofloxacin HCL was compared with the reference spectrum.
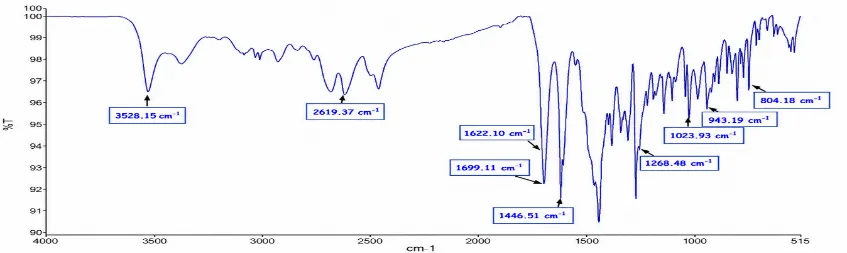
Figure 5.1: FTIR Spectrum of Ciprofloxacin Hydrochloride
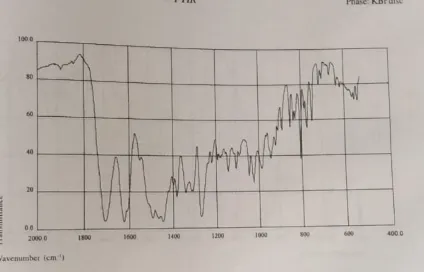
Figure 5.2: Reference FTIR Spectrum of Ciprofloxacin Hydrochloride as per IP
Table 5.1: Spectroscopic Peaks of Ciprofloxacin Hydrochloride
| Wave number (cm-1) | Functional group |
|---|---|
| 3528 | -NH stretching |
| 2619 | O-H stretching |
| 1699 | C=0 stretching |
| 1622 | C=C stretching |
| 1446 | C-H stretching |
| 1307 | C-H stretching |
| 1268 | C-O stretching |
The IR spectrum of the pure drug sample and the reference spectrum are shown in fig.5.1 and 5.2.all the major peaks present in the spectrum of the pure drug sample were compared with that of the spectrum in the reference.it verified the authenticity of the procured drug sample.
5.1.1.3 Differential scanning calorimetry (DSC)
DSC thermogram of ciprofloxacin hydrochloride showed endothermic peak at 319℃ and exothermic peak at 139℃,which complies with the melting point range of ciprofloxacin HCL as per standards, and it confirmed the identity and purity of drug sample.
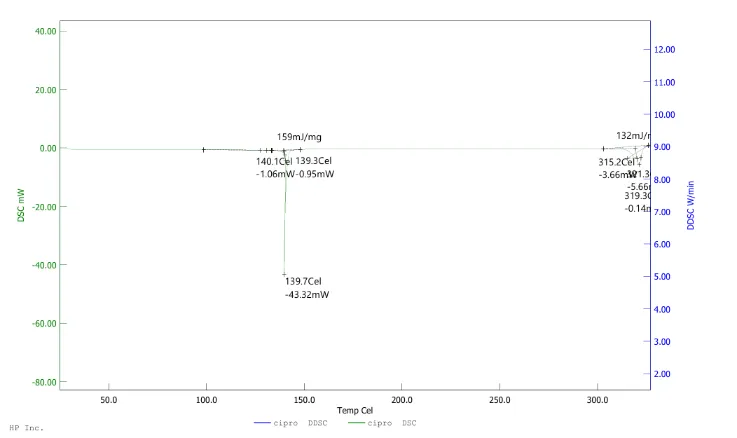
Figure 5.3: DSC Thermogram of Ciprofloxacin HCL
5.1.1.4. Determination of melting point
The melting point was determined by the capillary method.the average melting point was found to be 316℃, which complies with the reference range of melting point.this confirms the identity of the drug sample
Table 5.2: Melting Point of Ciprofloxacin HCL
| Trial no | Melting point (℃) | Average melting point (℃) (N=3, mean ±SD) |
|---|---|---|
| 1 | 316 | 316.3±0.6 |
| 2 | 314 | |
| 3 | 319 |
5.1.1.5 Determination of saturation solubility
The solubility of ciprofloxacin HCL was determined by distilled water and simulated tear fluid (pH 7.4). the result of the solubility study is given in table 5.3.
Table.no.5.3 saturation solubility of ciprofloxacin HCL
| Sl.no | Solvents | Solubility (mg/ml) (N=3, mean±SD) |
|---|---|---|
| 1 | Distilled water | 24.6±0.05 |
| 2 | Simulated tear fluid | 6.4±0.05 |
5.1.1.6 loss on drying
The percentage loss on drying was found to be 0.022%. thus it was found to be within the IP limit.
5.1.1.7 determination of λmax of ciprofloxacin hcl
The 10ug/ml solution of ciprofloxacin in simulated tear fluid was scanned by uv-visible spectroscopy between 200-400nm.the wavelength was found to be 277nm,and that was used for further spectrophotometric evaluations
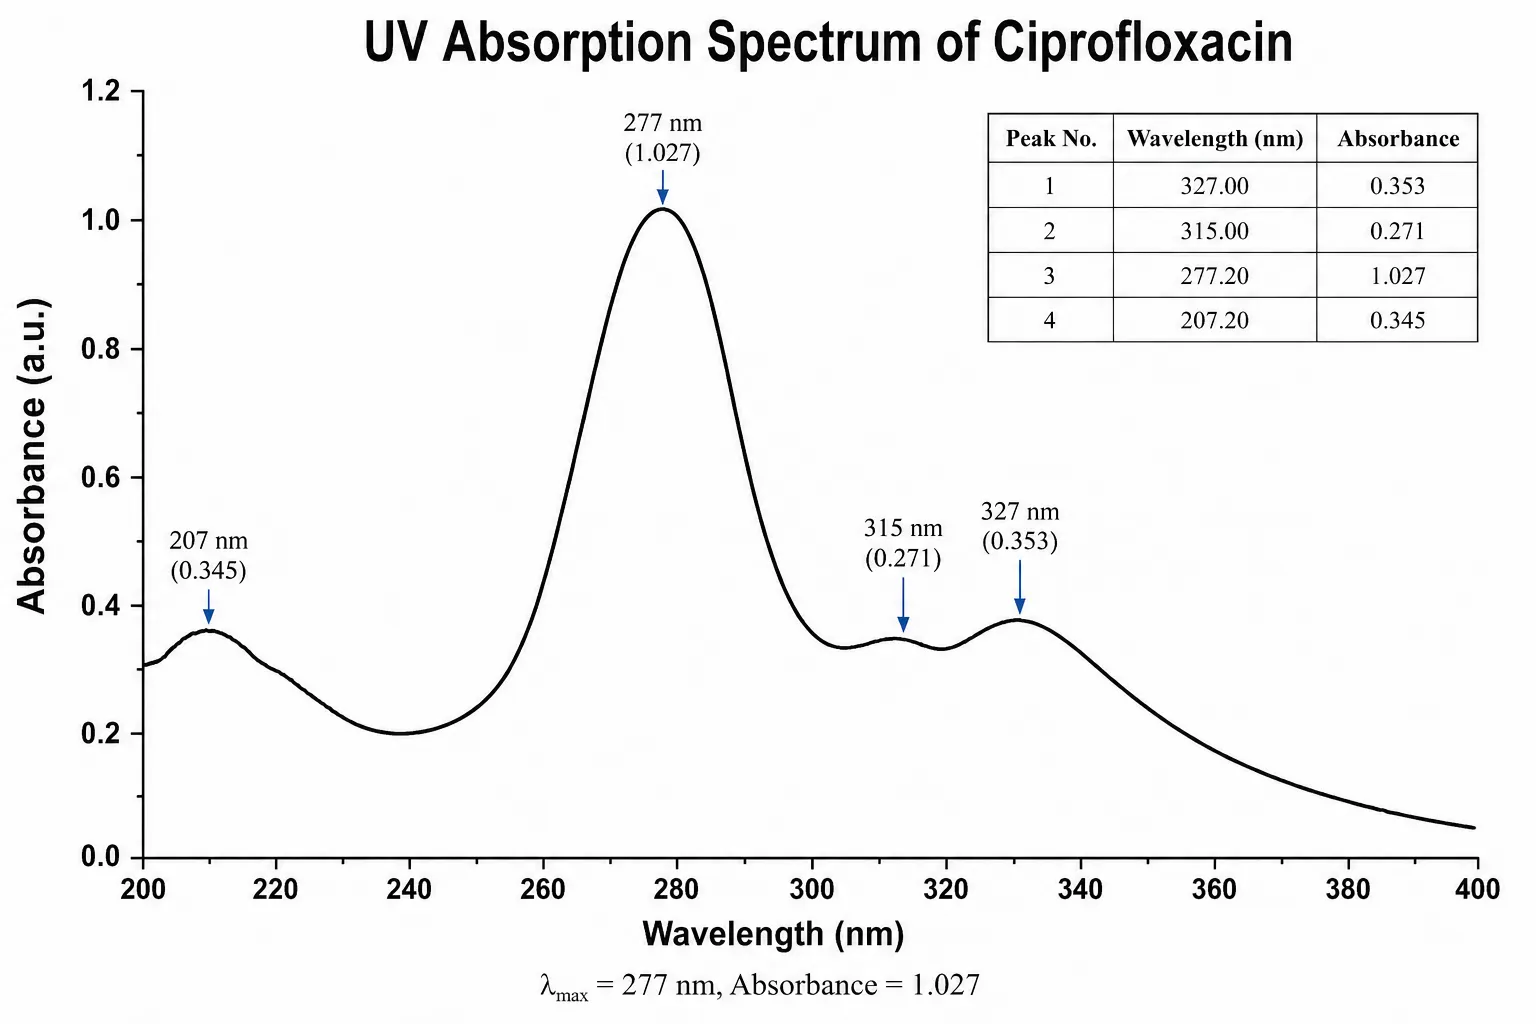
Figure 5.4: UV Spectrum of Ciprofloxacin HCL
5.1.1.8 Preparation of calibration curve of ciprofloxacin hcl in simulated tear fluid (7.4 pH)
[Figure - see the formatted PDF]
Figure 5.5: Calibration Plot of Ciprofloxacin HCL in Simulated Tear Fluid pH 7.4
the plot of ciprofloxacin hcl concentration vs absorbance exhibited linearity in the range of 0-10ug/ml at 271nm with a correlation coefficient (R2) of 0.9974 indicating a strong linear relationship between concentration and absorbance.
Table 5.4: Concentration and Absorbance Obtained for Calibration Plot of Ciprofloxacin HCL in Simulated Tear Fluid pH 7.4
| Concentration (µg/ml) | Absorbance |
|---|---|
| 2 | 0.245 |
| 4 | 0.429 |
| 6 | 0.665 |
| 8 | 0.905 |
| 10 | 1.027 |
5.1.2.1 CHITOSAN
a. Physical appearance
The appearance of chitosan was observed visually.it was found to be white to off-white, solid flakes and it complies with the reported description of chitosan.
b.ldentification by IR spectroscopic analysis
The identification of chitosan was carried out using IR spectroscopy in the range of 400-4000cm-1.the the obtained spectrum of chitosan was compared with the reference spectrum,and it shows all the characteristic peaks in the relevant region,which confirms the identity of chitosan.
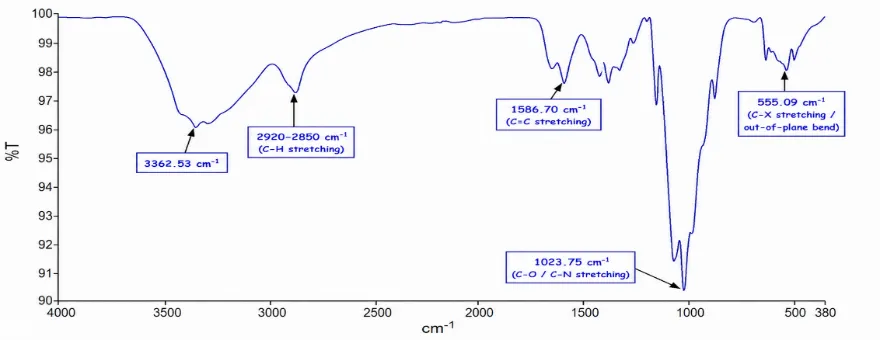
Figure 5.6: FTIR Spectrum of Chitosan
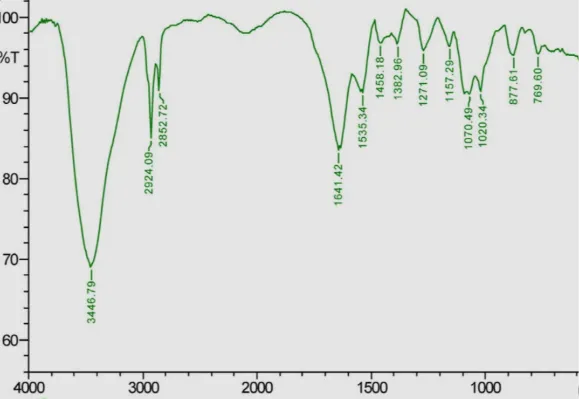
Figure 5.7: Reference Spectrum of Chitosan
Table 5.5: Spectroscopic Peak of Chitosan
| Wave numbercm-1 | Functional group |
|---|---|
| 3362 | 0-H |
| 2920 | C-H |
| 1586 | C=C |
| 1023 | C-N |
5.2.1.2 TRIPOLYPHOSPHATE
a. physical appearance
the appearance of tripolyphosphate was observed visually.it was found to be odorless,white crystalline powder and it complies with the reported description of tripolyphosphate.
b.Identification by IR spectroscopic analysis
The identification of tripolyphosphate was carried out using IR spectroscopy in the range of 400-4000cm-1.the the obtained spectrum of tripolyphosphate was compared with the reference spectrum,and it shows all the characteristic peaks in the relevant region,which confirms the identity of tripolyphosphate.
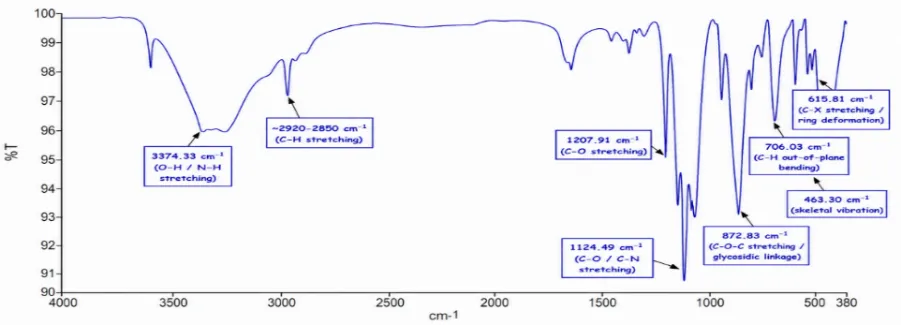
Figure 5.8: FTIR Spectrum of Tripolyphosphate
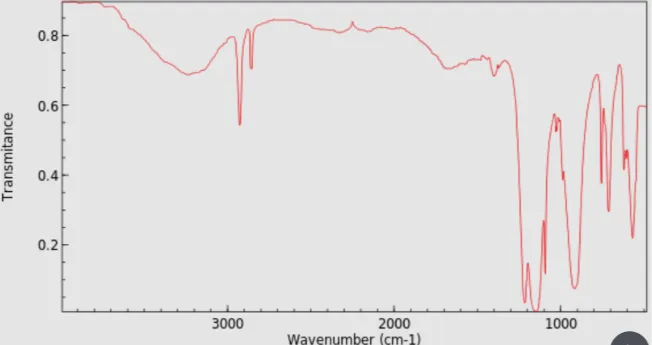
Figure 5.8: Reference Spectrum of Tripolyphosphate
Table.no.5.6 spectroscopic peak of tripolyphosphate
Table 5.7: FTIR Analysis of the Physical Mixture
| Wave numbercm-1 | Functional group |
|---|---|
| 3374 | O-H stretching |
| 2920 | C-H stretching |
| 1207 | C-O stretching |
| 1124 | C-N stretching |
| 872 | C-O-C stretching |
| 706 | C-H stretching |
| 615 | C-X stretching |
5.1.3.1.IR spectroscopic analysis of physical mixture
| Wave number | Functional group |
|---|---|
| 3376 | O-H stretching |
| 2928 | C-H stretching |
| 2855 | C-H stretching |
| 1699 | C=O stretching |
| 1622 | C=O stretching |
| 1447 | C-H bending |
| 1267 | C-N stretching |
| 1209 | C-O stretching |
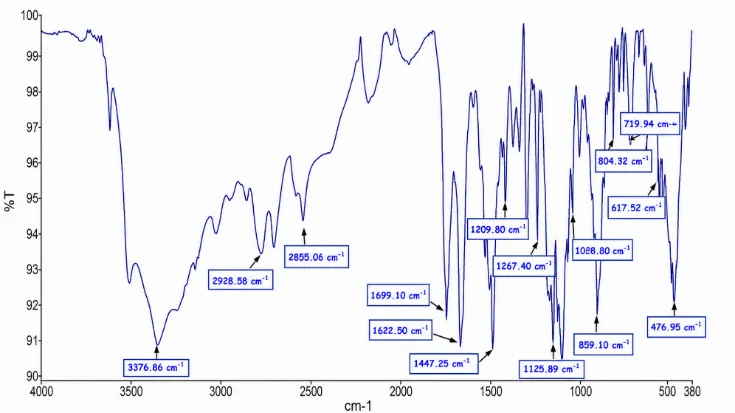
Figure 5.9: FTIR Spectrum of the Physical Mixture
All the major characteristic IR peaks of ciprofloxacin HCL were retained in the spectrum of the physical mixture with chitosan and tripolyphosphate,with out significant shifts or disappearance.this confirmed the absence of chemical interaction between the drug and excipients,indicating compatibility.
5.2 PREPARATION OF CIPROFLOXACIN LOADED NANOPARTICLE
Ciprofloxacin hydrochloride loaded chitosan nanoparticles were prepared by the ionic gelation method as described in figure 4.1
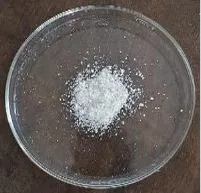
Fig.no:5.10 ciprofloxacin incorporated nanoparticles
5.3 OPTIMIZATION OF CIPROFLOXACIN HCL LOADED NANOPARTICLES
5.3.1 Development of experimental design (DoE)
All 13 batches proposed by the central composite design (CCD)were prepared and evaluated for particle size and entrapment efficiency.
5.3.2 Analysis of the experimental design using DoE
The responses were analysed separately to determine the need for data transformation,the best-fit polynomial model,significant terms,regression coefficients,model equations,and signal adequacy.model performance was further evaluated using contour plots and 3D response surface plots.
Table 5.8: Central Composite Design Data for Optimization of Nanoparticles
| Factor 1 | Factor 2 | Response 1 | Response 2 | ||
|---|---|---|---|---|---|
| Std | Run | A:chitosan(%) | B:tripolyphosphate(%) | particle size(µm) | entrapment efficiency(%) |
| 1 | 13 | 0.1 | 0.05 | 234 | 55.2 |
| 2 | 10 | 0.3 | 0.05 | 340 | 72.3 |
| 3 | 7 | 0.1 | 0.15 | 233 | 58.2 |
| 4 | 6 | 0.3 | 0.15 | 380 | 75.4 |
| 5 | 9 | 0.1 | 0.1 | 243 | 60.2 |
| 6 | 4 | 0.3 | 0.1 | 373 | 77.2 |
| 7 | 2 | 0.2 | 0.05 | 255 | 62.4 |
| 8 | 11 | 0.2 | 0.15 | 270 | 69.3 |
| 9 | 1 | 0.2 | 0.1 | 263 | 72.5 |
| 10 | 12 | 0.2 | 0.1 | 261 | 71.3 |
| 11 | 8 | 0.2 | 0.1 | 262 | 73.8 |
| 12 | 5 | 0.2 | 0.1 | 266 | 73.1 |
| 13 | 3 | 0.2 | 0.1 | 265 | 72 |
A. Effect of independent factors upon particle size
Table 5.9: ANOVA Data for Response Surface Quadratic Model for Particle Size
| Source | Sum of Squares | df | Mean Square | F-value | p-value | |
|---|---|---|---|---|---|---|
| Model | 29959.17 | 5 | 5991.83 | 411.56 | < 0.0001 | significant |
| A-chitosan | 24448.17 | 1 | 24448.17 | 1679.28 | < 0.0001 | |
| B-TPP | 486.00 | 1 | 486.00 | 33.38 | 0.0007 | |
| AB | 420.25 | 1 | 420.25 | 28.87 | 0.0010 | |
| A² | 4331.86 | 1 | 4331.86 | 297.54 | < 0.0001 | |
| B² | 96.03 | 1 | 96.03 | 6.60 | 0.0371 | |
| Residual | 101.91 | 7 | 14.56 | |||
| Lack of Fit | 84.71 | 3 | 28.24 | 6.57 | 0.0503 | not significant |
| Pure Error | 17.20 | 4 | 4.30 | |||
| Cor Total | 30061.08 | 12 |
The Model F-value of 411.56 implies the model is significant. There is only a 0.01% chance that an F-value this large could occur due to noise.P-values less than 0.0500 indicate model terms are significant. In this case A, B, AB, A², B² are significant model terms. Values greater than 0.1000 indicate the model terms are not significant. If there are many insignificant model terms (not counting those required to support hierarchy), model reduction may improve your model.The Lack of Fit F-value of 6.57 implies there is a 5.03% chance that a Lack of Fit F-value this large could occur due to noise.
B. Diagnostic plot of particle size
• Box-cox plot
[Figure - see the formatted PDF]
Figure.no5.11 plot of box-cox power transform of the particle size of ciprofloxacin HCL nanoparticles
• Predicted vs actual
[Figure - see the formatted PDF]
Fig.no : 5.12plot of predicted vs actual value of particle size of ciprofloxacin HCL nanoparticle
Predicted vs. Actual: The Predicted versus actual plot revealed that the model statistics were satisfying.
Model plots of particle size
[Figure - see the formatted PDF]
• Contour plot
Fig.no5.13 contour plot of factor A vs B on particle size
• 3D surface plot
[Figure - see the formatted PDF]
Figure 14: 3D Response Surface Plot of Factor a vs B on Particle Size
B) Effect of independent factors upon entrapment efficiency
Table 5.10: ANOVA Data for Response Surface Quadratic Model for Encapsulation Efficiency
| Source | Sum of Squares | df | Mean Square | F-value | p-value | |
|---|---|---|---|---|---|---|
| Model | 596.32 | 5 | 119.26 | 52.07 | < 0.0001 | significant |
| A-chitosan | 438.61 | 1 | 438.61 | 191.51 | < 0.0001 | |
| B-TPP | 28.17 | 1 | 28.17 | 12.30 | 0.0099 | |
| AB | 0.0025 | 1 | 0.0025 | 0.0011 | 0.9746 | |
| A² | 14.15 | 1 | 14.15 | 6.18 | 0.0418 | |
| B² | 72.23 | 1 | 72.23 | 31.54 | 0.0008 | |
| Residual | 16.03 | 7 | 2.29 | |||
| Lack of Fit | 12.30 | 3 | 4.10 | 4.39 | 0.0933 | not significant |
| Pure Error | 3.73 | 4 | 0.9330 | |||
| Cor Total | 612.36 | 12 |
The Model F-value of 52.07 implies the model is significant. There is only a 0.01% chance that an F-value this large could occur due to noise.P-values less than 0.0500 indicate model terms are significant. In this case A, B, A², B² are significant model terms. Values greater than 0.1000 indicate the model terms are not significant.The Lack of Fit F-value of 4.39 implies there is a 9.33% chance that a Lack of Fit F-value this large could occur due to noise.
Diagnostic plot of entrapment efficiency
Box-Cox Plot for Power Transforms: The Box-Cox value of lambda one further confirmed that data transformation to any other scale is not required.
• Box-cox plot
[Figure - see the formatted PDF]
Fig.no5.15 plot of box-cox power transform of entrapment efficiency of ciprofloxacin HCL nanoparticles
[Figure - see the formatted PDF]
Figure 5.15: Plot of Predicted vs Actual Value of Entrapment Efficiency of Nanoparticle
• Predicted vs actual
Predicted vs. Actual: The predicted versus actual plot revealed that the model statistics were satisfying.
Model plot of entrapment efficiency
• Contour plot
[Figure - see the formatted PDF]
Figure 5.17: Contour Plot of Factor a vs B on Entrapment Efficiency
3D response surface
[Figure - see the formatted PDF]
Figure 5.18: 3D Response Surface Plot of Factor Avs B on Entrapment Efficiency
5.3.3. optimization of the formula using DoE
5.3.3.1 Numerical optimization
Numerical optimization was carried out by defining the required criteria for input parameters and expected responses.the input parameters considered were chitosan concentration and tripolyphosphate concentration.for the responses,the goals were set within the range of 233-380nm for particle size and 55.2-77.2 for entrapment efficiency.based on these conditions,the software suggested 13 formulations that met the optimization criteria
| Name | Goal | Lower Limit | Upper Limit | Lower Weight | Upper Weight | Importance |
|---|---|---|---|---|---|---|
| A: chitosan | Is in range | 0.1 | 0.3 | 1 | 1 | 3 |
| B: TPP | Is in range | 0.05 | 0.15 | 1 | 1 | 3 |
| particle size | Minimize | 233 | 380 | 1 | 1 | 3 |
| entrapment efficiency | Maximize | 55.2 | 77.2 | 1 | 1 | 3 |
Solution for optimization
The software suggested different solutions of which the formulation with the highest desirability was selected as the optimum
Graph IC: AL Optimization by Overlay Plot
| Number | chitosan | TPP | particle size | entrapment efficiency | Desirability | |
|---|---|---|---|---|---|---|
| 1 | 0.200 | 0.100 | 264.828 | 72.090 | 0.881 | Selected |
The same criteria used in numerical optimization were applied in graphical optimization. An overlay plot was constructed to visualize the relationship between the input parameters and responses. The optimized formulation, lying within the yellow region of the overlay plot, was selected as it showed the desired particle size and entrapment efficiency.
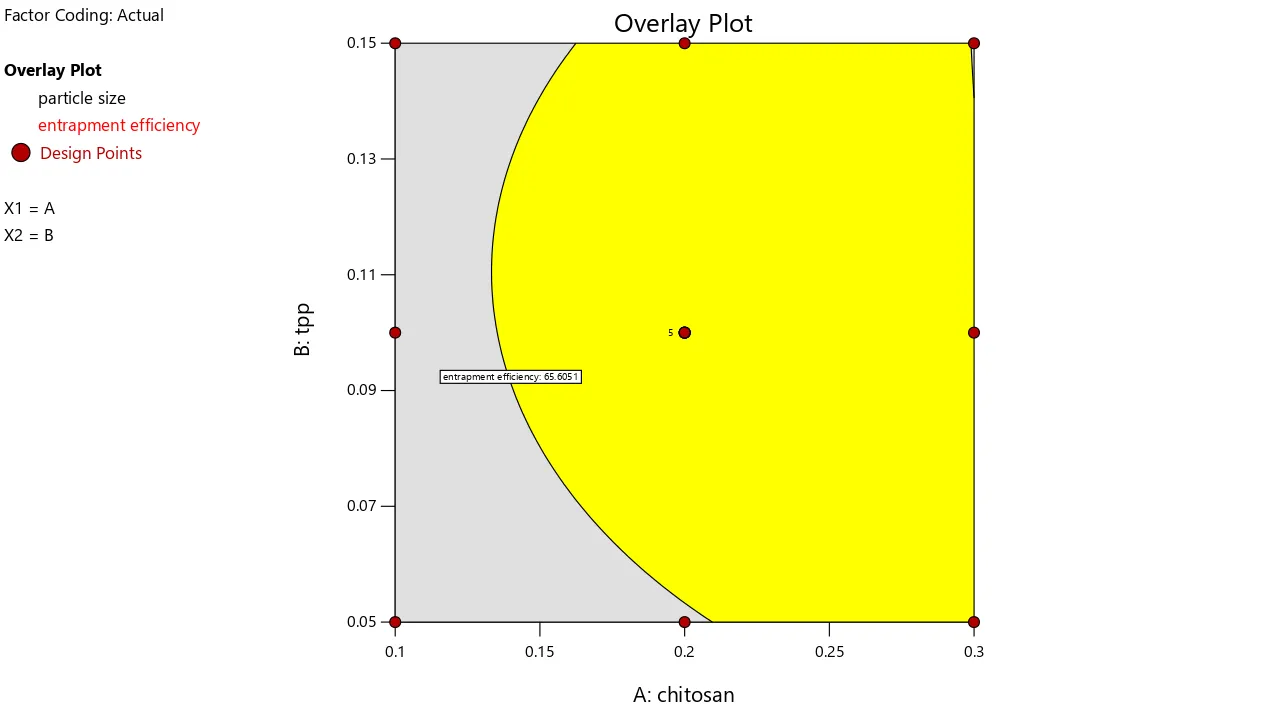
Figure 5: Graphical Optimization by Overlay Plot
5.4 EVALUATION OF OPTIMIZED CIPROFLOXACIN LOADED CHITOSAN NANOPARTICLES
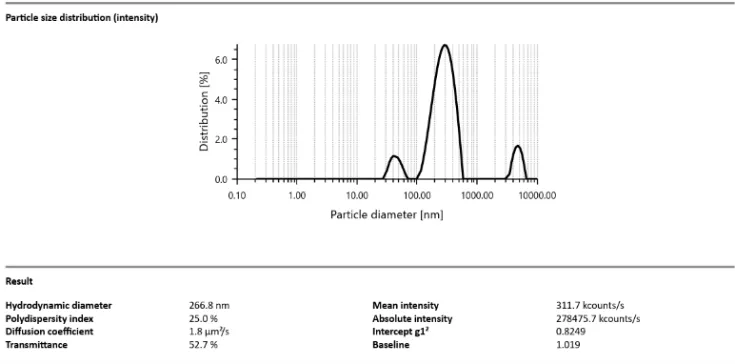
5.4.1 determination of particle size polydispersity index
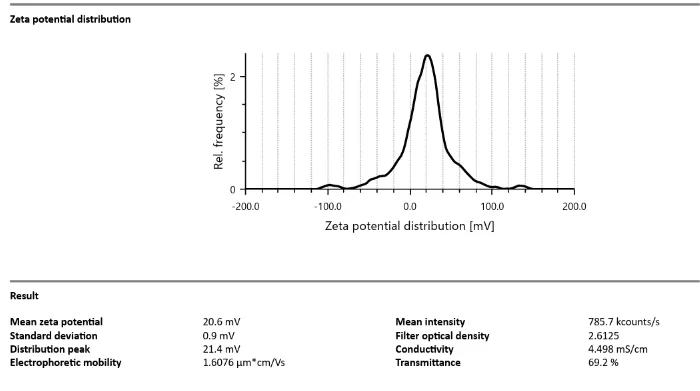
Determination of zata potential
5.4.3 Entrapment efficiency Entrapment efficiency of optimized nanoparticles was found to be 71.05%
5.4.3 SEM image of experimentally obtained nanoparticle
The morphology of the optimized ciprofloxacin hcl loaded nanoparticles was examined by scanning electron microscopy (SEM).the images confirmed that the nanoparticles were in the nm size range and exhibited a spherical shape with smooth surfaces.
[Figure - see the formatted PDF]
5.4.4 drug content determination
The drug content of nanoparticles was found to be 35.5%
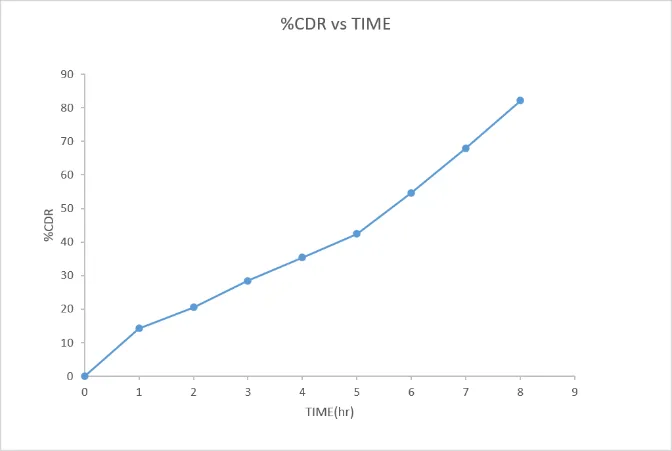
5.4.5 in vitro drug release study
| TIME | %CDR (N=3,mean ±SD) |
|---|---|
| 0 | 0 |
| 1 | 14.291 |
| 2 | 20.513 |
| 3 | 28.498 |
| 4 | 35.426 |
| 5 | 42.472 |
| 6 | 54.654 |
| 7 | 67.993 |
| 8 | 82.141 |
5.5 FORMULATION OF THERMOREVERSIBLE IN SITU GEL
Poloxamer 407 solution 15-20 (%w/v) were prepared and gelation temperature was determined by the tube-tilting method.
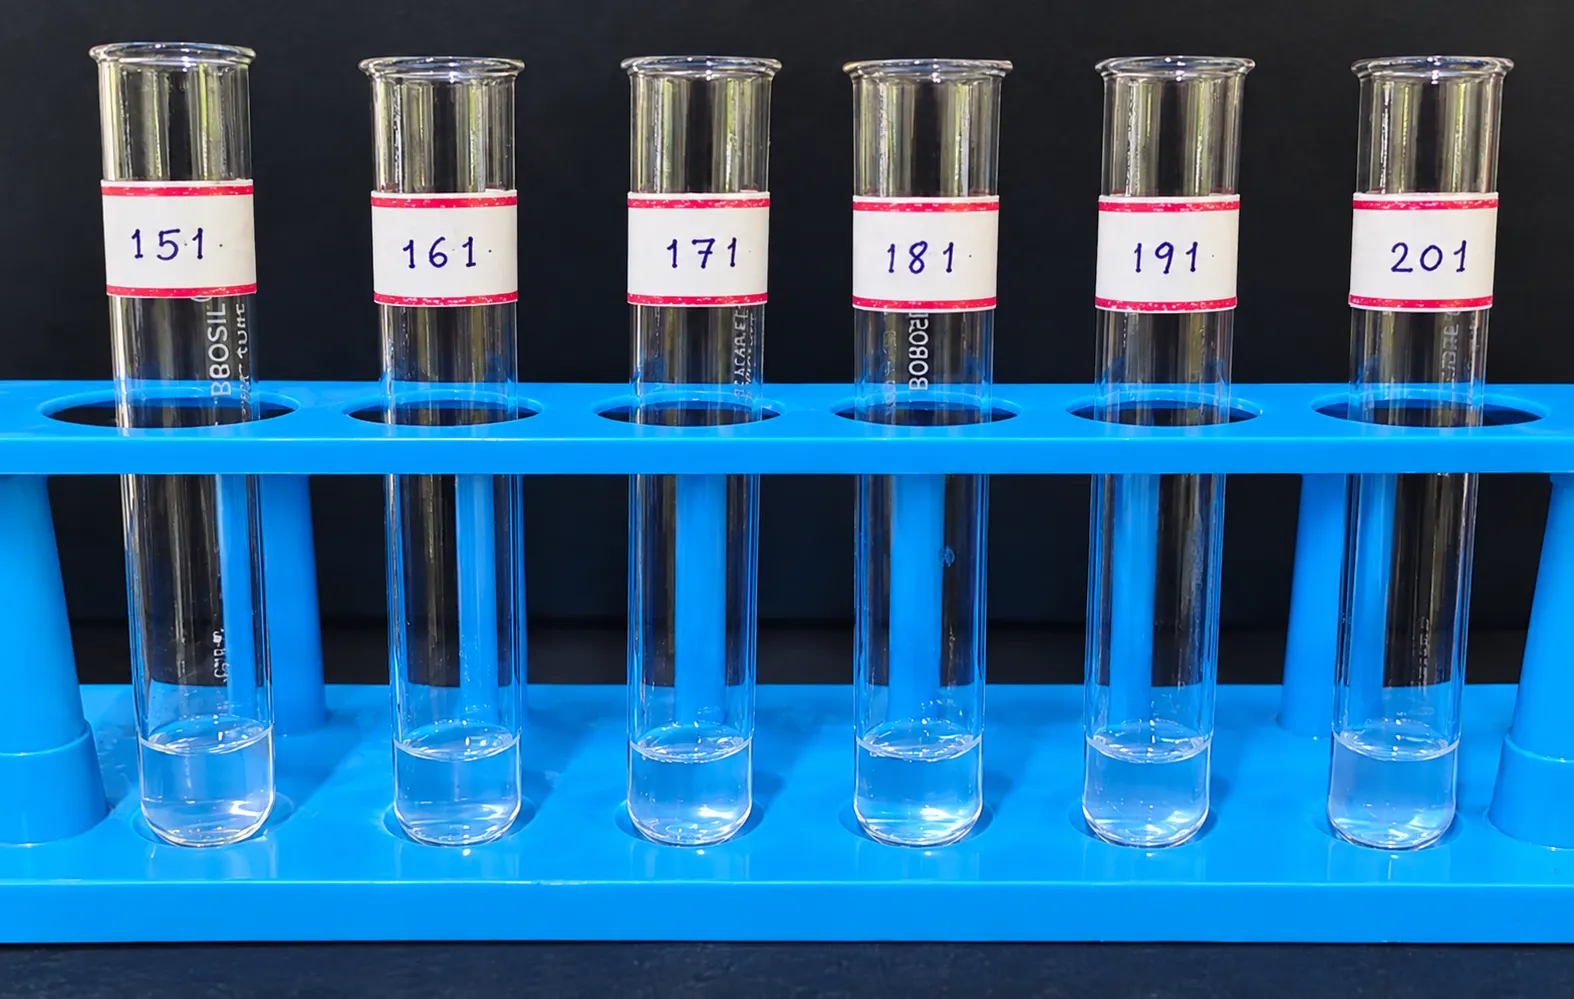
5.5.1 determination of gelation temperature of poloxamer 407
| SI.NO | Formulation code |
Concentration of poloxamer 407 solution(%) | Gelation temperature(℃) (N=3,mean ±SD) |
|---|---|---|---|
| 1 | P1 | 15 | 45.2±0.1 |
| 2 | P2 | 16 | 41.83±0.06 |
| 3 | P3 | 17 | 38.53±0.12 |
| 4 | P4 | 18 | 36.58±06 |
| 5 | P5 | 19 | 35.2±0.1 |
| 6 | P6 | 20 | 30.2±0.2 |
It indicates that gelation temperature was dependent on the concentration of polymer 407.the requirement in the formulation was to obtain a thermoreversible insitu forming ocular gel around 32-35℃.from the various formulations,P5 showed a gelation temperature of 35.2±0.1℃,which was ideal for the preparation of thermoreversible insitu gel.hence P5 was selected for further preparation.
5.6 formulation of insitu gel incorporated with ciprofloxacin nanoparticle
Nanoparticle equivalent to 10mg of ciprofloxacin hcl were dispersed in 1 ml of P5 formulation,resulting in the final insitu gel shown in figure 5.30.
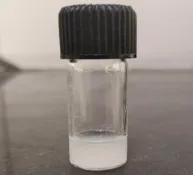
5.7 EVALUATION OF INSITU GEL INCORPORATED WITH CIPROFLOXACIN HCL NANOPARTICLE
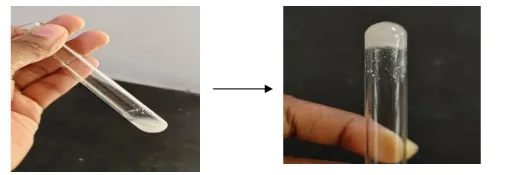
5.7.1.Determination of gelation temperature of insitu gel
| Formulation code | Gelation temperature(℃) | Average (n=3,mean±SD) |
|---|---|---|
| P5 | 34.2 | 35.36±0.31℃ |
| 35.6 | ||
| 36.3 |
The result suggested that the incorporation of ciprofloxacin hcl did not significantly alter the gelation temperature.
5.7.2. determination of gelation time of insitu gel
| Formulation code | Gelation time (sec) |
|---|---|
| P5 | 66 |
The formulation formed a gel after 66 seconds upon being placed at its gelation temperature.
5.7.3 determination of Ph
Measurements were performed in three independent trials under identical conditions.the results are summarized in table
| Trials | pH | Average(n=3,mean ±SD) |
|---|---|---|
| 1 | 6.9 | 7.2±0.2 |
| 2 | 7.2 | |
| 3 | 7.5 |
The ph of the formulation was found to be which was in the acceptable ph range for ocular drug delivery
5.7.4 Determination of viscosity
| Formulation code | Viscosity of insitu gel solution | Viscosity of gel |
|---|---|---|
| P5 | 130±4.1 | 6454±4.5 |
5.7.5 Drug content
The drug content of in situ gel formulation was found to be 83%
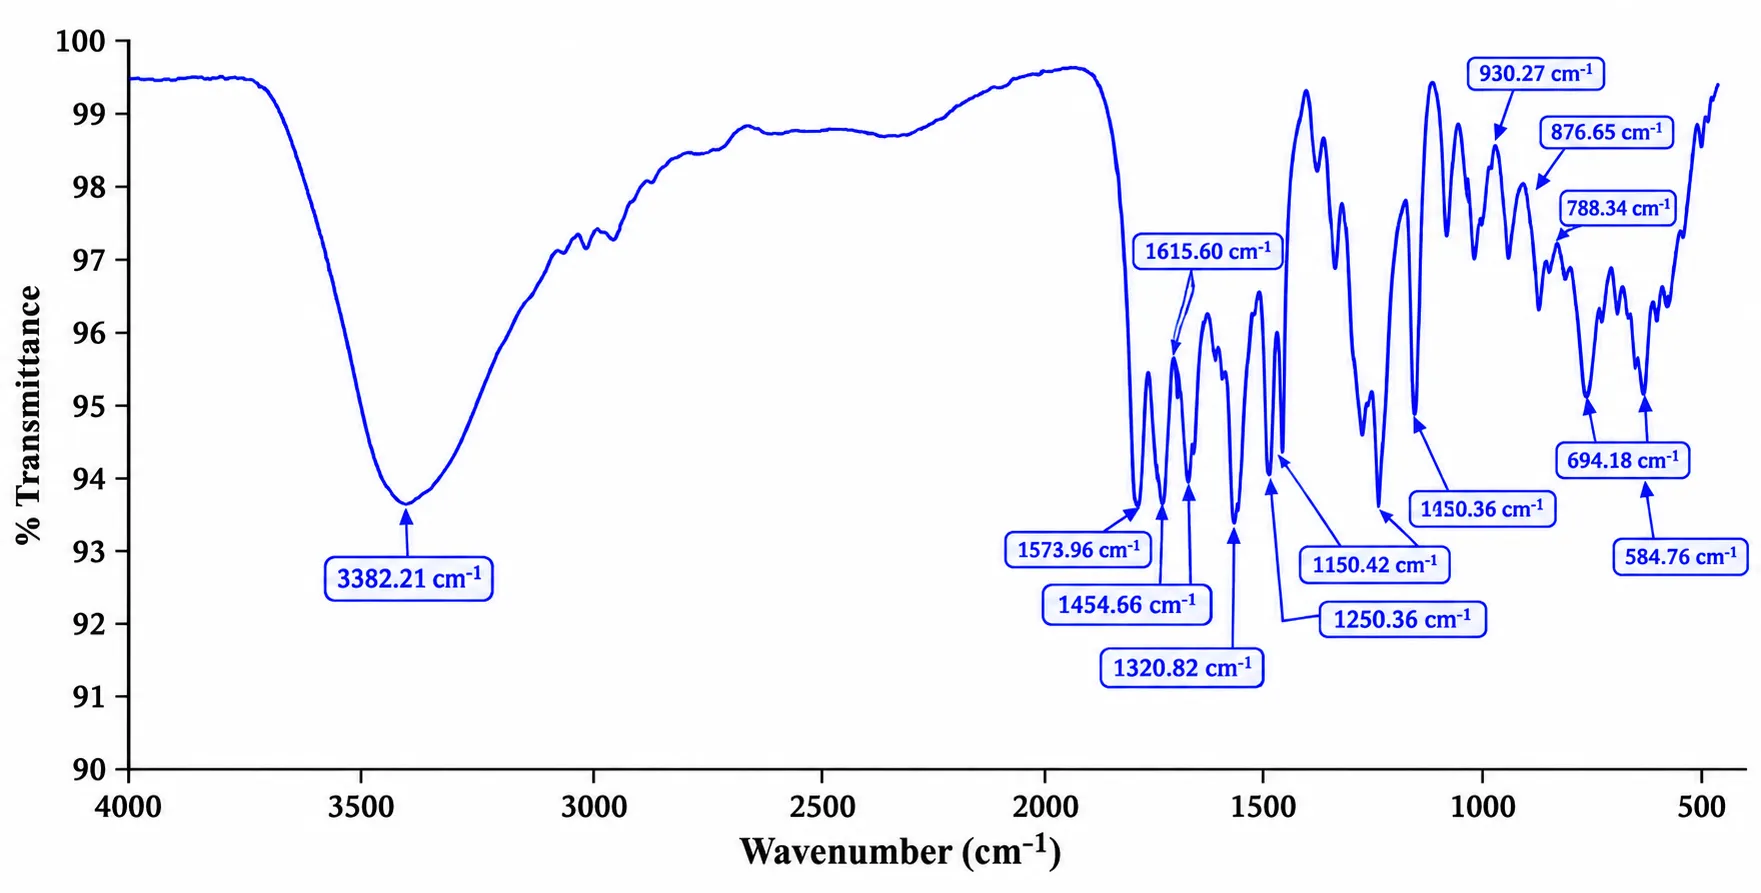
5.7.6 FTIR spectroscopic analysis of nanoparticle loaded insitu gel
5.7.7 Differential scanning colorimetry
5.7.8 In vitro drug release from insitu gel
| Time (hr) | %CDR |
|---|---|
| 0 | 0 |
| 1 | 14.29 |
| 2 | 20.51 |
| 3 | 28.49 |
| 4 | 35.42 |
| 5 | 42.47 |
| 6 | 54.65 |
| 7 | 67.99 |
| 8 | 82.14 |
[Figure - see the formatted PDF]
IN VITRO DRUG RELEASE KINETICS STUDY OF INSITU GEL
| time | log time | square root of time | %CDR | LOG %CDR | %CDR REMAINING | LOG %CDR REMAINING TO BE ABSORBED |
|---|---|---|---|---|---|---|
| 0 | 0 | 0 | 0 | 0 | 100 | 2 |
| 1 | 0 | 1 | 3.400335 | 0.5315217 | 96.599665 | 1.98497562 |
| 2 | 0.30103 | 1.414213562 | 9.969012 | 0.9986521 | 90.030988 | 1.954392016 |
| 3 | 0.477121 | 1.732050808 | 19.26968 | 1.2848745 | 80.73032 | 1.907036674 |
| 4 | 0.60206 | 2 | 28.07286 | 1.4482867 | 71.92714 | 1.856892792 |
| 5 | 0.69897 | 2.236067977 | 32.49581 | 1.5118274 | 67.50419 | 1.82933073 |
| 6 | 0.778151 | 2.449489743 | 50.20603 | 1.7007559 | 49.79397 | 1.697176753 |
| 7 | 0.845098 | 2.645751311 | 65.15997 | 1.8139809 | 34.84003 | 1.54207852 |
| 8 | 0.90309 | 2.828427125 | 78.48576 | 1.8947909 | 21.51424 | 1.332726009 |
| Zero order | First order | Higuchi model | Korsmeyer-peppas model |
|---|---|---|---|
| R2 | R2 | R2 | R2 |
| 0.961 | 0.8605 | 0.7955 | 0.9954 |
5.7.9 Ex vivo permeation study
[Figure - see the formatted PDF]
Fig no:34exvivo permeation study of insitu gel
Table 23: Ex Vivo Permeation Study of Insitu Gel
| Time(hr) | %CDR |
|---|---|
| 0 | 0 |
| 1 | 8.084 |
| 2 | 10.74 |
| 3 | 20.34 |
| 4 | 41.07 |
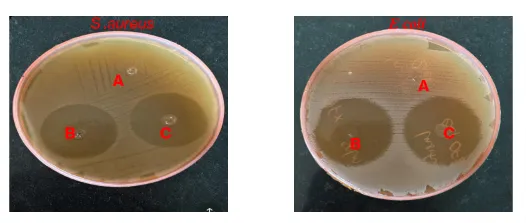
Figure 5.35: Invitro Antibacterial Activity of Cpx Insitu Gel, Cpx Marketed and Control Against E Coli and Staphylococcus Aureus
5.7.10 antibacterial activity
Insitu gel shows a large, clear zone of inhibition of 3.1mm in s. aureus and 3.4mm in E coli indicating that ciprofloxacin HCL successfully diffused out of the nanoparticle-loaded insitu gel and effectively inhibited E. coli and s. aureus bacteria. The zone of inhibition diameter against S. aureus (3.1±0.2mm) and E coli(3.4±1.2mm) was higher than that of CPX drop (2.9±0.1mm) and (2.7±0.5mm) respectively.
SUMMARY AND CONCLUSION
The present study was undertaken to formulate, optimize and evaluate a ciprofloxacin hydrochloride-loaded chitosan nanoparticle incorporated thermoreversible in situ gel for enhanced ocular drug delivery in bacterial conjunctivitis. Ciprofloxacin hydrochloride was selected as the antibacterial drug, while chitosan and sodium tripolyphosphate were used for nanoparticle preparation by the ionic gelation method and Poloxamer 407 was used as the thermoreversible gelling polymer.
Preformulation studies confirmed that ciprofloxacin hydrochloride was a pale-yellow, crystalline solid. The drug exhibited a λmax of 277 nm and showed saturation solubility of 13.6 ± 0.05 mg/mL in distilled water and 11.4 ± 0.05 mg/mL in simulated tear fluid. The average melting point determined by the capillary method was 316°C, while DSC showed an endothermic peak at 319°C. FTIR analysis showed the characteristic functional groups of ciprofloxacin hydrochloride. FTIR analysis of the drug, chitosan, sodium tripolyphosphate and their physical mixture showed retention of the major drug peaks with negligible changes, indicating compatibility between the drug and excipients. Ciprofloxacin hydrochloride-loaded chitosan nanoparticles were optimized using a central composite statistical design with chitosan concentration and sodium tripolyphosphate concentration as independent variables. Particle size and entrapment efficiency were selected as the responses. The optimized formulation contained 0.2% chitosan and 0.1% sodium tripolyphosphate, with a predicted particle size of 264.828 nm and predicted entrapment efficiency of 72.09%, with a desirability of 0.881. Experimental evaluation of the optimized nanoparticles showed a particle size of 266.8 nm, PDI of 0.25 and zeta potential of +20.6 mV. The entrapment efficiency was 71.05% and drug content was 35.5%. SEM analysis confirmed nanoparticles in the nanometre range with a spherical morphology. The nanoparticle formulation showed progressive drug release, reaching 82.14% at 8 hours The optimized nanoparticles were subsequently incorporated into a thermoreversible Poloxamer 407 in situ gel. Plain Poloxamer 407 formulations were evaluated at concentrations ranging from 15–20% w/v, and the 19% w/v formulation was selected because it exhibited gelation close to physiological ocular temperature. The optimized nanoparticle-loaded in situ gel exhibited a gelation temperature of 35.36 ± 0.31°C and a gelation time of 66 seconds. The formulation showed a pH of 7.2 ± 0.2, solution viscosity of 130 ± 4.1 and gel viscosity of 6454 ± 4.5, with a drug content of 83%. FTIR analysis showed the major characteristic peaks of ciprofloxacin hydrochloride with negligible changes, indicating compatibility and stability of the drug within the formulation. DSC analysis showed disappearance of the characteristic crystalline drug peak and the presence of the polymeric peak, suggesting conversion of the drug to an amorphous state within the polymeric matrix.
The in vitro drug-release study of the nanoparticle-loaded in situ gel demonstrated sustained drug release, with approximately 78.5% drug release at 8 hours. Release kinetic analysis showed that the Korsmeyer–Peppas model provided the best fit with an R² value of 0.9954. The release exponent (n = 1.4886) indicated Super Case-II transport, suggesting that drug release was predominantly associated with polymer relaxation, swelling and erosion of the gel matrix. The ex vivo permeation study using goat cornea demonstrated approximately 41.07% drug permeation at 4 hours, indicating that the formulation was capable of permeating the corneal membrane. Antibacterial evaluation demonstrated zones of inhibition of 3.1 ± 0.2 cm against Staphylococcus aureus and 3.4 ± 1.2 cm against Escherichia coli. These zones were higher than those observed with the marketed ciprofloxacin eye drops, which showed zones of 2.9 ± 0.1 cm and 2.7 ± 0.5 cm against S. aureus and E. coli, respectively.
In conclusion, the ciprofloxacin HCl-loaded chitosan nanoparticle incorporated thermoreversible in situ gel was successfully formulated and evaluated. The optimized formulation showed suitable physicochemical properties, sustained drug release up to 8 hours, 41.07% ex vivo corneal permeation at 4 hours, and good antibacterial activity against S. aureus and E. coli. Thus, the developed formulation represents a promising approach for prolonged ocular drug retention and effective treatment of bacterial conjunctivitis.
REFERENCES


Kadeeja P. S., Dr. Geetha V. S., Greeshma V. P., Afeefa K. A., Sajin K. C., Formulation, Optimization and Evaluation of Antibacterial Nanoparticle-Loaded in Situ Gel for Enhanced Ocular Drug Delivery, Int. J. of Pharm. Sci., 2026, Vol 4, Issue 11, 1280-1315. https://doi.org/10.5281/zenodo.24002532
 10.5281/zenodo.24002532