

We use cookies to ensure our website works properly and to personalise your experience. Cookies policy
Department of Pharmaceutical Analysis, St. Mariam College of Pharmacy, Tirunelveli, Tamilnadu, India.
Sodium benzoate is widely used as an antimicrobial preservative in pharmaceutical and cosmetic preparations, making its quantitative control important for product quality. The present study aimed to develop and validate a simple, economical UV–Visible spectrophotometric method for estimating sodium benzoate in a cold cream formulation. A sodium benzoate stock solution was prepared in distilled water and serially diluted to obtain working standards. The ultraviolet absorption spectrum was examined over 200–400 nm, and a wavelength in the 225–227 nm region was identified as the absorption maximum; 227 nm was selected for quantitative measurements. A calibration curve was constructed over 2.5–20 µg/mL using absorbance measurements at 227 nm. The calibration data gave the regression equation y = 0.060195x + 0.081951, with an R² value of 0.9903. The developed method was applied to the cold cream sample, and the sodium benzoate content was estimated as 0.0175% w/w. Accuracy was evaluated by standard addition at 80%, 100%, and 120% levels, with individual recoveries ranging from 98.69% to 100.75% and an overall mean recovery of 99.71%. The findings indicate that the proposed UV–Visible spectrophotometric procedure is straightforward, rapid, economical, and suitable for routine estimation of sodium benzoate in cold cream formulations, subject to completion of the remaining validation parameters required for formal analytical-method validation.
Pharmaceutical and cosmetic preparations that contain water are susceptible to microbial contamination, making the appropriate selection and control of preservatives an important aspect of product quality. Sodium benzoate is a widely used benzoate preservative with activity that is influenced by the formulation environment, particularly pH. Its broad use in food, pharmaceutical, and cosmetic products has also led to continued interest in reliable analytical procedures for its determination. 1,2,3
Ultraviolet–Visible (UV–Visible) spectrophotometry is a convenient analytical technique for quantitative measurements when the analyte absorbs in the ultraviolet or visible region. The technique is comparatively simple, economical, and suitable for routine laboratory use. In pharmaceutical analysis, calibration-based UV methods can provide a practical alternative when a rapid determination is required. 4,5
The present work was undertaken to develop a simple UV–Visible spectrophotometric procedure for the quantitative determination of sodium benzoate used as a preservative in a cold cream formulation. The study included determination of the analytical wavelength, preparation of a calibration curve, estimation of sodium benzoate in the formulation, and evaluation of accuracy by standard-addition recovery studies.
DRUG PROFILE
SODIUM BENZOATE

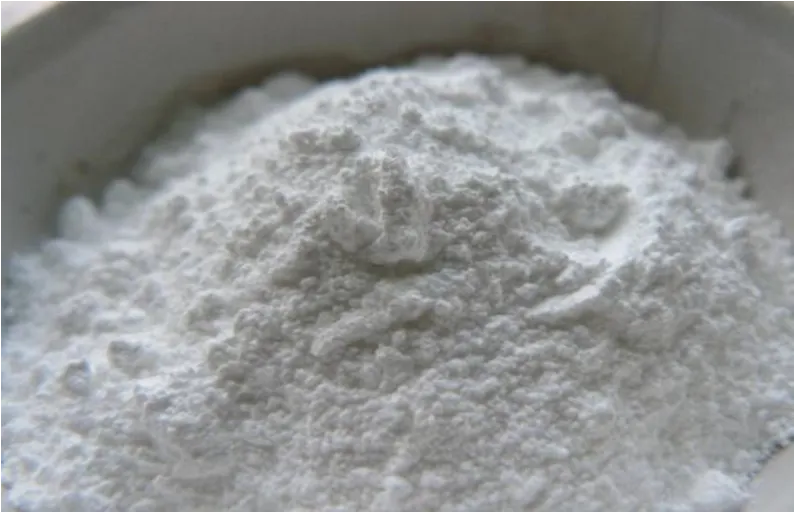
Molecular formula:C7H5O2Na
Molecular weight :144.10 g/mol.
Physical state: Freely soluble in water, sparingly soluble in ethanol.
MATERIALS AND METHODS
Study design and materials
The study used sodium benzoate as the analytical standard and a laboratory-prepared cold cream formulation containing sodium benzoate as preservative. The formulation described in the supplied final copy contained borax (0.4 g), beeswax (10 g), liquid paraffin (25 g), rose water q.s., sodium benzoate (0.1 g), and distilled water q.s. The source document does not specify the study site or experimental year; these details should be inserted from the laboratory record before submission.
Preparation of standard solution
A 100 mg quantity of sodium benzoate was accurately weighed and dissolved in 100 mL of distilled water to obtain a nominal stock solution. A working solution was prepared by diluting 10 mL of the stock solution to 100 mL with distilled water. Serial dilutions corresponding to 2.5, 5, 10, 15, and 20 µg/mL were prepared for calibration.
Determination of absorption maximum
The standard sodium benzoate solution was scanned over 200–400 nm using a UV–Visible spectrophotometer. The absorption maximum was observed in the approximately 225–227 nm region. A wavelength of 227 nm was selected for quantitative analysis, consistent with the measurement used for the reported calibration data.
Calibration curve
The absorbance of the sodium benzoate standards at 227 nm was recorded. A plot of absorbance against concentration was prepared, and linear regression was applied to obtain the calibration equation.
Preparation of cold cream
The oil phase was prepared by heating liquid paraffin and beeswax in a borosilicate glass beaker at approximately 75 °C. In a separate vessel, borax, distilled water, and sodium benzoate were heated to approximately the same temperature to obtain the aqueous phase. The aqueous phase was gradually incorporated into the heated oil phase with vigorous mixing until a smooth cream was formed. Rose oil was added as fragrance, and the cream was worked on a slab using geometric mixing to obtain a uniform consistency.
Sample preparation and UV analysis
For the quantitative determination reported in the supplied final copy, 0.2 g of the cold cream sample was transferred to a volumetric flask and treated with 20 mL of 0.1 N sodium hydroxide. One millilitre of the prepared solution was further diluted with 10 mL of distilled water. The solution was filtered through a 0.45 µm syringe filter before measurement. Absorbance was measured at 225–227 nm, with 227 nm used for the reported quantitative result. Sodium benzoate concentration was calculated from the regression equation.
Tabulate the Regression Data
To calculate the slope (m) & intercept (b) using the least-squares method. Compute the necessary statistical components (Σx, Σy, Σx², & Σxy) from the raw data.
Table 1: Regression Data
|
Std |
x (µg/ml) |
(y) Abs |
x² |
xy |
|
Std 1 |
2.5 |
0.184 |
6.25 |
0.46000 |
|
Std 2 |
5.0 |
0.399 |
25.00 |
1.9950 |
|
Std 3 |
10.0 |
0.731 |
100.00 |
7.3100 |
|
Std 4 |
15.0 |
1.012 |
225.00 |
15.1800 |
|
Std 5 |
20.0 |
1.244 |
400.00 |
24.8800 |
|
Sum (Σ) |
52.5 |
3.570 |
756.25 |
49.825 |
Number of points (n) = 5
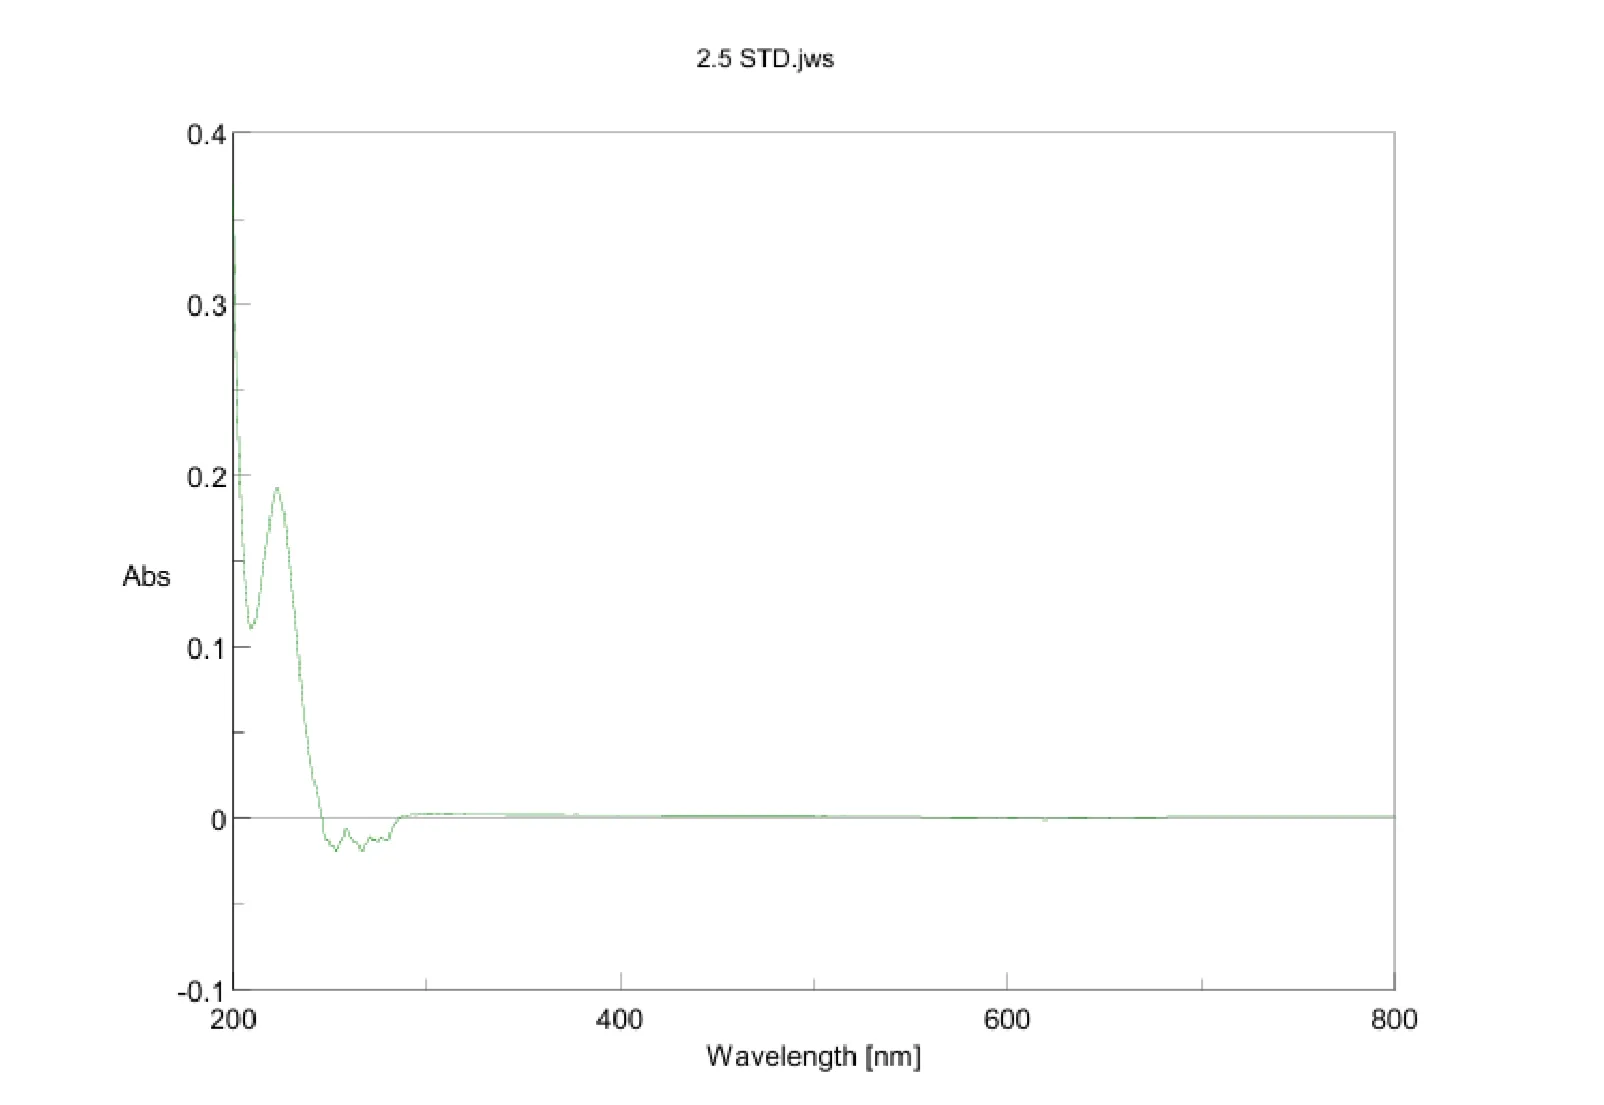
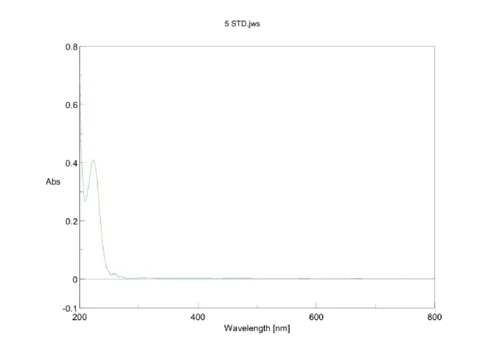
Figure 1: Standard 1 (2.5Μg/ml) Figure 2: Standard 2 (5Μg/ml)
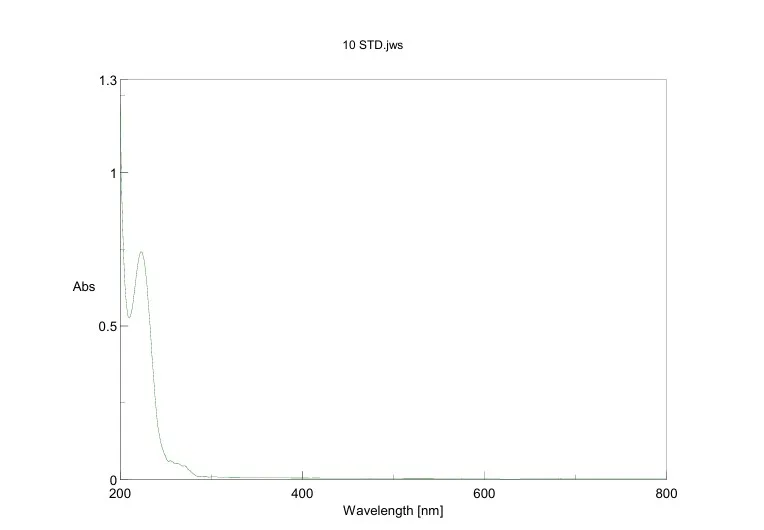
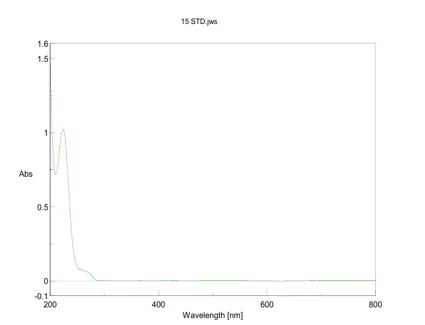
Figure 3: Standard 3 (10Μg/ml) Figure 4: Standard 4 (15Μg/ml)
Sample Dilution:
UV - Analysis:
1. Filter the sample solution using 0.45 µg syringe filter to remove any residual particulate matter.
2. Calibration curve (10-15ppm).
3. Measure the absorbance 225-227 nm using UV-Vis spectrophotometer.
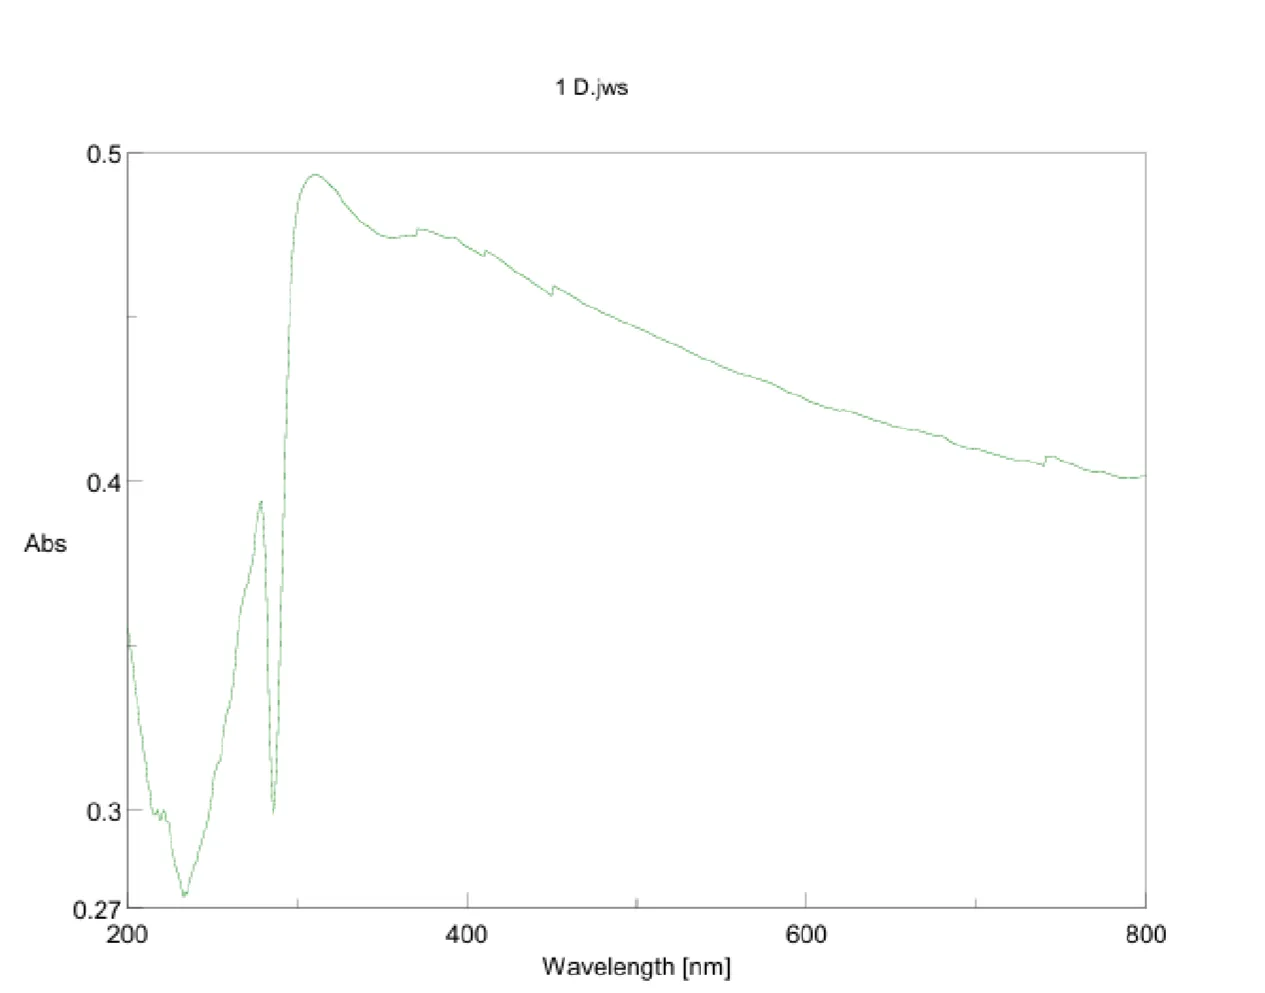
Figure 5: Sample Graph
Calculations
1. Calculate the slope (m)
The slope represents the sensitivity of spectrophotometer system. Use the linear regression formula.

[𝛴(𝑥²) − (𝛴𝑥) ²]
Substitute the calculated values into the formula:
m = [5 (49.825) − (52.5) (3.570)]
[3781.25 2756.25]
m = 61.7 / 1025 = 0.060195
2. Calculate the Intercept (b)
The y-intercept represents the background absorbance (or) baseline threshold of the blank solution. Use the intercept formula:
b = (Σy − m Σx) / n
Substitute the calculated values and unrounded slope into the formula:
b = [3.570 = (0.06019512 × 52.5)]
5
b = (3.570 − 3.160244)
5
b = 0.409756 / 5 = 0.081951
Slope m = 0.06020
y intercept b = 0.08195
3. Calculate the Concentration:
Using standard calibration curve equation (A = m C + b) we rearrange the formula to isolate Concentration (C):
C = (A − b)
m
Where:
Measured Absorbance A = 0.293
Slope m = 0.06020
Intercept b = 0.08195
Substitute the values using the precise unrounded regression numbers from data:
C = (0.293 − 0.08195122)
0.060195
C = 0.21104 / 0.06019 = 3.50 µg/ml
4. Apply the Percent weight/weight (% w/w)
% w/w = [Mass of sod. benzoate (g) / Initial wt. (g)] × 100
Substitute values:
% w/w = (0.000035061 g / 0.2 g) × 100
% w/w = 0.0001753 × 100 = 0.0175%
% Conc of sod. benzoate in sample = 0.0175% (Acceptable limit)
5. Total mass in 10ml soln
Total mass = Conc × Final volume
Total mass = 3.5061 µg/ml × 10 = 35.061 µg
Convert micrograms to grams (÷ 1,000,000):
35.061 µg = 0.000035061 gm
The regression equation was expressed as A = mC + b, where A is absorbance, C is sodium benzoate concentration, m is the slope, and b is the intercept. The concentration of sodium benzoate in the sample solution was calculated from C = (A − b)/m. The reported sample absorbance was 0.293, giving an estimated concentration of approximately 3.50 µg/mL and a calculated sodium benzoate content of 0.0175% w/w.
Method validation
Linearity and Accuracy
Accuracy was evaluated by the standard-addition method at 80%, 100%, and 120% levels, using three independent replicates at each level. Percentage recovery was calculated as the ratio of measured concentration to true concentration multiplied by 100. The source document also states that intraday precision was assessed; however, the numerical precision dataset was not included in the supplied final copy and is therefore not reported as a numerical result in this manuscript.
RESULTS
Wavelength selection and linearity
Scanning of sodium benzoate in the UV region showed maximum absorption in the approximately 225–227 nm region. The quantitative wavelength was selected as 227 nm. The absorbance increased progressively from 0.184 to 1.244 as the standard concentration increased from 2.5 to 20 µg/mL. Linear regression of the five calibration points produced the equation y = 0.060195x + 0.081951, with R² = 0.9903.
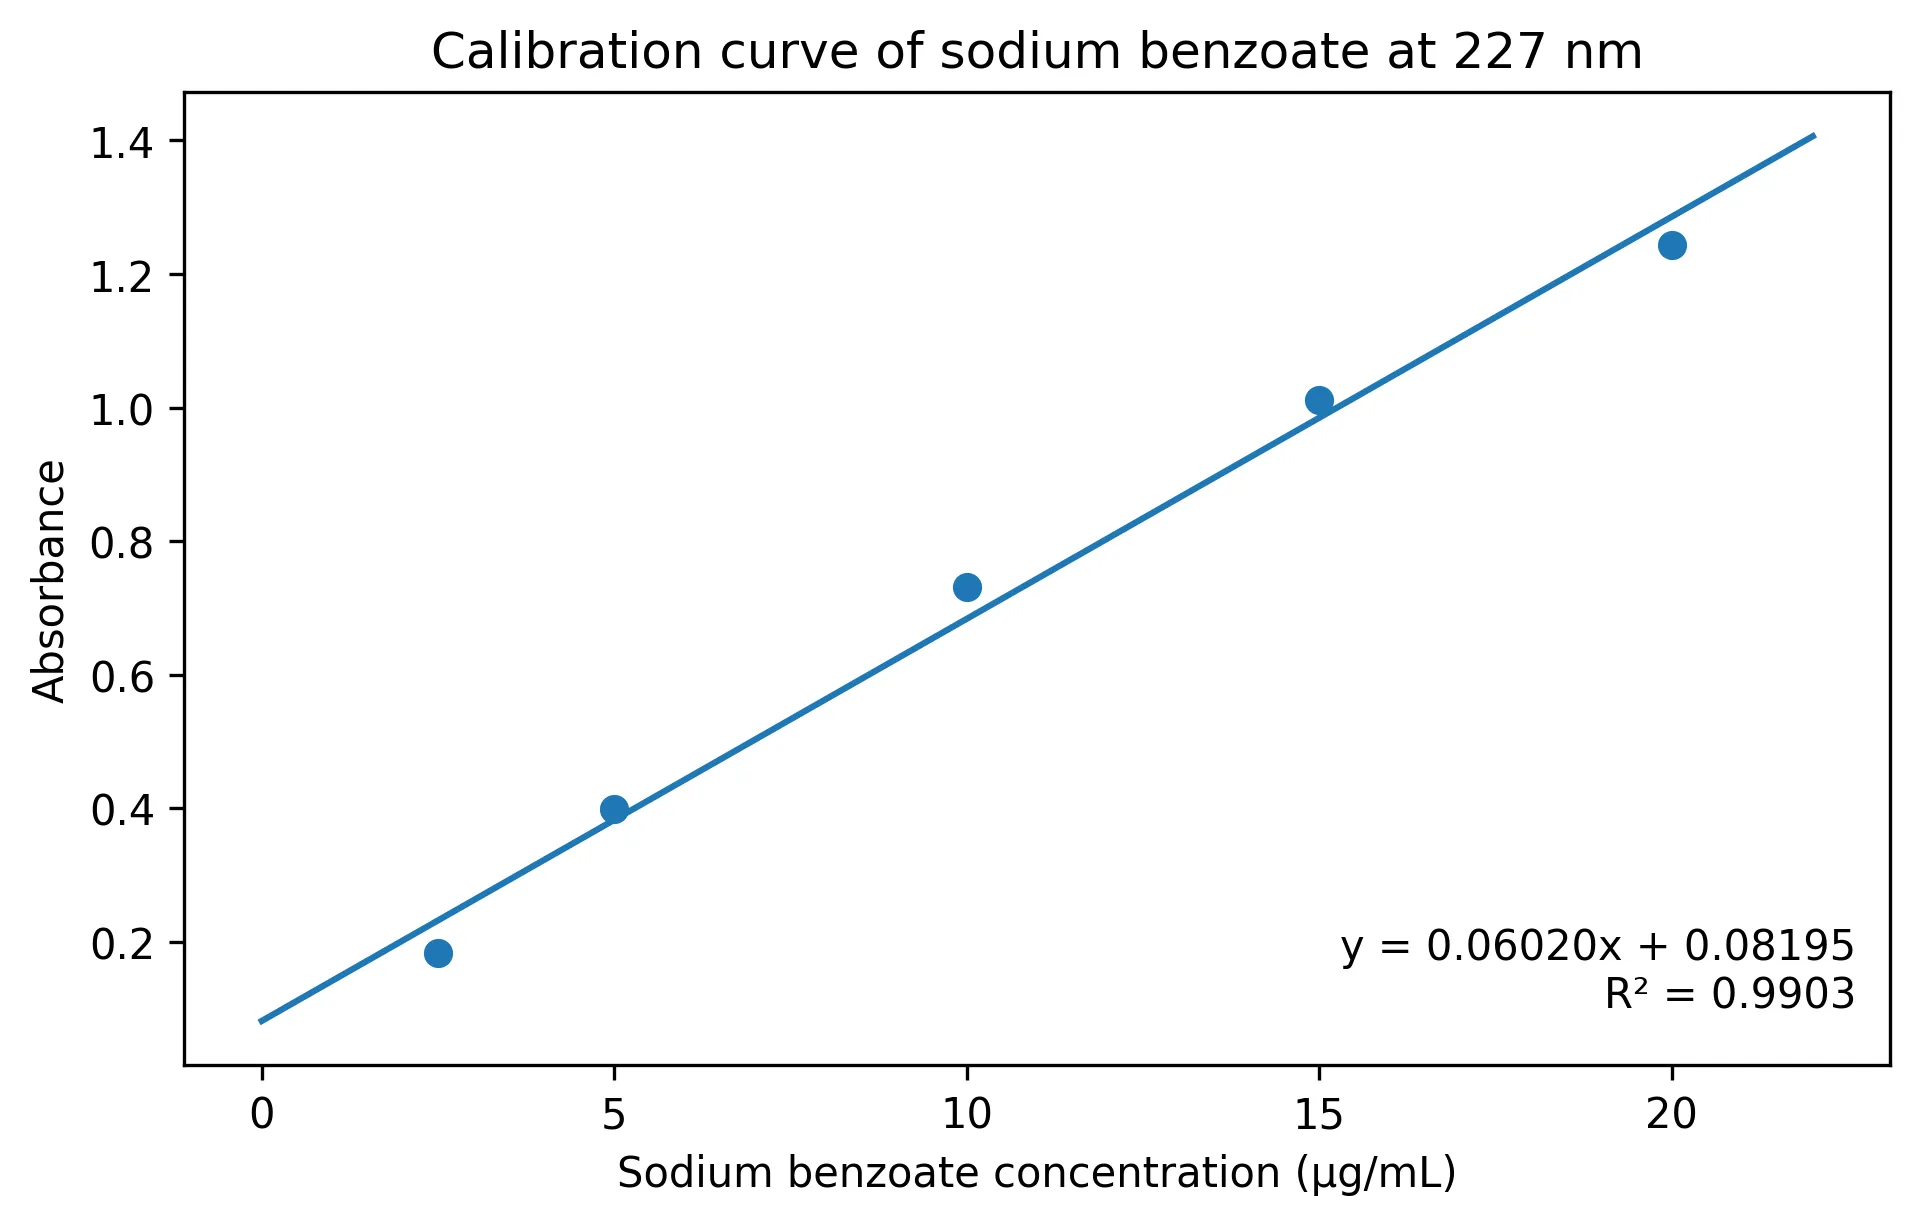
Figure 6: Calibration Curve of Sodium Benzoate at 227 nm.
Accuracy of sodium benzoate in cold cream
The reported absorbance of the prepared cold cream sample was 0.293. Using the calibration equation, the calculated concentration was approximately 3.50 µg/mL. Based on the dilution and sample-weight calculations presented in the source document, the sodium benzoate content of the cold cream was estimated as 0.0175% w/w.
Table 2: Accuracy/recovery results for sodium benzoate.
|
Addition level |
Replicate |
True concentration (µg/mL) |
Found concentration (µg/mL) |
Recovery (%) |
|
80% |
R1 |
1.60 |
1.595 |
99.69 |
|
80% |
R2 |
1.60 |
1.612 |
100.75 |
|
80% |
R3 |
1.60 |
1.579 |
98.69 |
|
100% |
R1 |
2.00 |
1.994 |
99.70 |
|
100% |
R2 |
2.00 |
2.011 |
100.55 |
|
100% |
R3 |
2.00 |
1.978 |
98.90 |
|
120% |
R1 |
2.40 |
2.410 |
100.42 |
|
120% |
R2 |
2.40 |
2.393 |
99.71 |
|
120% |
R3 |
2.40 |
2.376 |
99.00 |
Recovery values for the nine determinations ranged from 98.69% to 100.75%. The mean recovery calculated from the reported individual values was 99.71%. The recovery results therefore indicate close agreement between the added and measured sodium benzoate concentrations under the reported experimental conditions.
DISCUSSION
The study demonstrates the practical use of UV–Visible spectrophotometry for quantitative estimation of sodium benzoate in a cold cream matrix. Sodium benzoate is an established preservative, and its antimicrobial activity is affected by the chemical environment of the formulation. Previous literature has described its widespread use and the importance of suitable analytical procedures for its determination. 1,2,5,6
The calibration experiment showed an increasing absorbance response with increasing sodium benzoate concentration across the 2.5–20 µg/mL range. The regression equation, y = 0.060195x + 0.081951, and R² of 0.9903 indicate a strong linear relationship within the tested range. The method therefore provided a usable calibration model for estimating sodium benzoate in the prepared sample.
The estimated sodium benzoate content of the cold cream was 0.0175% w/w. Accuracy assessment by standard addition produced recoveries close to 100% at all three investigated levels. These results support the suitability of the procedure for the tested formulation. The method also has practical advantages because UV–Visible instruments are commonly available in pharmaceutical analysis laboratories and the measurement procedure is relatively straightforward.
CONCLUSION
A UV–Visible spectrophotometric procedure was developed for the estimation of sodium benzoate in a cold cream formulation. Quantitative analysis was performed at 227 nm using a calibration range of 2.5–20 µg/mL. The calibration model showed an R² value of 0.9903, while standard-addition studies gave recoveries of 98.69–100.75%, with a mean recovery of 99.71%. The sodium benzoate content of the analysed cold cream was estimated as 0.0175% w/w. On the basis of the supplied experimental results, the method is simple and economical and can be useful for routine estimation of sodium benzoate in the tested formulation. Thus, the developed method has the advantage of being solvent free, cost effective and involving relatively simple sample preparation. The developed validated method can be useful for the routine quality control analysis of Sodium Benzoate in cosmetics with desired precise and accuracy.
ACKNOWLEDGEMENT
We extend our heartfelt gratitude to our institutional support.
CONFLICT OF INTEREST
The authors declare no conflict of interest
REFERENCES

Sudha N., Imman Aghin M., Malini S., Mohammed Safeek D., Selva K., Sumathi M., Qunatitative Deter-mination of Sodium Benzoate by UV- Spectroscopy and Evaluation of Preservative , Int. J. of Pharm. Sci., 2026, Vol 4, Issue 10, 2122-2129. https://doi.org/10.5281/zenodo.23364301
 10.5281/zenodo.23364301