

We use cookies to ensure our website works properly and to personalise your experience. Cookies policy
Vidya Niketan college of pharmacy lakhevadi Indapur.
For the determination of metformin hydrochloride in tablet form, a straightforward and reliable UV spectrophotometric technique has been created and validated. The spectrophotometric measurement of metformin hydrochloride is carried out at 232 nm, utilizing distilled water as the solvent. In the range of 2–10 µg/mL, it followed Beer's law. The drug recovery percentage for the suggested procedure was between 102 and 105%, demonstrating that the tablet excipients had no impact. For regular measurement of metformin hydrochloride in, the suggested approach was proven to be reliable and precise. The biguanide class of oral antihyperglycemics, known as metformin hydrochloride, reduces both basal and postprandial plasma glucose levels in patients with type 2 diabetes by increasing glucose tolerance. Methanol, pH4, and pH7 buffer readily dissolved metformin. Methanol was selected as the solvent. 237 nm is the wavelength at which the drug absorbs the lightest. The drug's optical property was determined to have Beer's law limits of 1-10 ?g/ml, a correlation coefficient of 0.9989, a standard error of 0.012089, and a molar absorbance of 37058.33. Utilizing methanol as a solvent, UV spectroscopy was used to examine the medication sample, and it was discovered that the average drug concentration in the formulation was 100.4%. Accuracy studies were found to have a % RSD of 99.7±0.352. The %RSD for accuracy was found to range from 0.0209 to 0975. The percentage recovery of robustness was discovered to be 99.17±0.1636 and 99.69±0.5953. The tablet formulation's pH breakdown studies were found to be less at pH 6-8. On metformin tablet preparation, the force breakdown tests were carried out. By employing 0.1N Noah, hydrolysis was used to degrade stress at an alkaline pH. The rate of stress degradation was determined to be 8.07% in 60 minutes and 11.95% in 90 minutes. Using 3N hcl, hydrolysis was used to cause stress degradation under acidic conditions, and product degradation was found to be 78% after 60 minutes and 75% after 90 minutes. Using a temperature of 700 c, dry heat-induced breakdown was found to be 22% after 48 hours. Product breakdown was discovered to be 16% over 15 minutes of oxidative deterioration using hydrogen peroxide. Photolytic breakdown was 24% after 3 hours and 18% after 6 hours
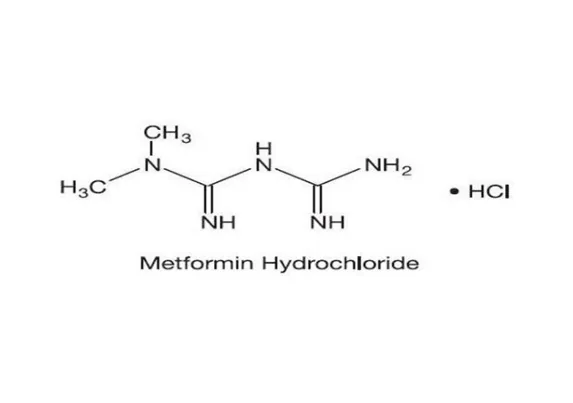
The hypoglycaemic medication metformin hydrochloride (Figure 1) is a white crystalline powder that is hygroscopic and easily water-soluble. It is also known as 1, 1-dimethylbiguanide hydrochloride. The Indian Pharmacopoeia [1] officially states this. It lowers triglyceride and LDL cholesterol levels, doesn't cause weight gain, and may even help some people lose weight. In individuals with type II diabetes mellitus, it is the only antidiabetic that may be linked to a lower risk of cardiovascular issues. The World Health Organization Model List of Essential Medicines only includes metformin as one of two oral antidiabetics. A comprehensive literature review reveals that just a handful of techniques, such HPLC and GC, have been used to quantify metformin hydrochloride in biological fluids and medicinal preparations.
The goal of the current research was to create a straightforward, quick, affordable, and reliable UV spectrophotometric approach for identifying drugs in pharmaceutical formulations. A proven UV spectrophotometric technique for quantifying Metformin hydrochloride in tablet and bulk dosage forms is detailed in this study. According to the International Conference on Harmonization (ICH) criteria, the suggested approach was optimized and verified.Metformin hydrochloride (MET) is a member of the biguanide family of oral antihyperglycemics that lowers both basal and postprandial plasma glucose in patients with type 2 diabetes by improving glucose tolerance. The chemical formula for metformin hydrochloride is (N, Dimethyl imido dicarboximide diamide hydrochloride). By enhancing peripheral glucose uptake and usage, metformin lowers hepatic glucose output, reduces glucose absorption in the intestine, and boosts insulin sensitivity. The chemical makeup of Metformin Hydrochloride was studied in 1-2. The Metformin hydrochloride content of biological fluids and medicinal preparations has been assessed using a variety of Spectrophotometric6-8 and HPLC3-5 methods. The UV Spectrophotometric approach for determining the medication from the tablets is part of the official procedure. A straightforward, quick, affordable, and repeatable approach for analysing Metformin in its dosage forms is required. However, UV spectroscopy was not utilized in any documented method for the forced degradation studies of Metformin hydrochloride. Therefore, the aim of the current study is to investigate the force deterioration in conjunction with the pH degradation. validated in accordance with ICH (Q2A1995) standards9 Induced degradation experiments can also aid in pharmaceutical development in areas like formulation development, manufacturing, and packaging, where understanding chemical behaviour may be used to enhance a drug product.
The existing regulatory advice offers helpful descriptions and broad remarks regarding degradation studies10. According to the International Conference on Harmonization (ICH) standards 11–12, stress testing is intended to ascertain the inherent stability of the molecule by creating a degradation pathway in order to pinpoint the possible degradation products and confirm the stability-indicating capability of the analytical technique employed. To identify a new pharmaceutical material, Q1A (R2)13 and (Q1B)14 of the ICH guidelines stability testing of new drug compounds and products must be subjected to stress testing. It implies that the temperature effect, proper oxidation, photolysis, and susceptibility should be included in the degradation products produced under the diverse circumstances.
METHODS AND MATERIALS
Instruments: The absorbance was measured using a dual beam spectrophotometer (Shimadzu-UV-2450 with a 10mm path length and a changeable slit width). reagents and chemicals
EXPERIENTIAL WORK
Absorption by the Instrument Using UV Probe software version 2 with a Shimadzu Model 1700 UV-Visible spectrophotometer, spectral measurements were performed with a spectral bandwidth of 1 nm and wavelength accuracy of 0.3 nm. The automatic wavelength correction was done with a pair of 5 cm matched quartz cells.
chemicals
The metformin HCl (MET) used as a gift sample was given by Aribindo pharmaceuticals, India. Qualigen fine chemicals Ltd. of India provided the methanol. Double distillation produced the water that was utilized.
Making a standard stock solution
To create a standard metformin stock solution of 1 mg/ml, 10 mg of the medication was dissolved in methanol, and the volume was brought up to 10 ml.
Early solubility test of the medication
At a temperature of 28±1 C, the drug's solubility was ascertained. Various solvents, including distilled water, methanol, ethanol, acetonitrile, isopropyl alcohol, dimethyl sulfoxide, dimethyl formamide, 0.1 N HCl, chloroform, acetonitrile, and buffer solutions at pH 4, 7, and 9.2, were used to dissolve a small amount of standard medication. The findings are shared.
Choosing a Solvent
Metformin was discovered to be soluble in a variety of solvents chosen for the solubility studies, including distilled water, methanol, and pH 4 and pH 7 buffers. Methanol was chosen as the solvent for the current study.
Choosing the wavelength of analysis and the point of maximum absorption
Drug was diluted appropriately from the standard stock solution at a concentration of 10 µg/ml, and the resulting solutions were analyzed between 200 and 400 nm. The absorption spectrum that was produced was then derivatized for zero-order spectroscopy. The drugs were analyzed using this zero-order spectrum. The absorption maximum was discovered to be at 237 nm, which may be used for more research.
making stock solutions
The standard Metformin 100mg was weighed, transferred to a 100 ml volumetric flask, and dissolved in 25 ml of methanol. To produce a solution with 1000 μg/ml (Stock solution A), the flask was shaken, and the volume was brought up to the mark with methanol. Pipette 5 mL from this stock solution A and put it into a volumetric flask of size 50 mL. To create a solution with 100 μg/ml (Stock solution B), the volume was brought up to the mark using methanol.
Choosing the Range of Analytical Concentration
Appropriate aliquots of 1, 2, 3, 4, and 5 mL were pipetted from the regular Metformin stock solution B into 10 mL volumetric flasks, and methanol was used to dilute the samples in order to produce working standard solutions with concentrations ranging from 1 to 10 g/mL. The absorbance of these solutions was measured at 237 nm. The analytical concentration range for the standard solution was determined to be 1–10 g/ml, and optical characteristic and linearity data were collected using overlaid spectra.
Metformin calibration curve
The right amounts of aliquots from standard Metformin stock solution B were moved to volumetric flasks of varying volumes, all of which had a 10 ml capacity. Methanol was used to adjust the volume to the target level, resulting in concentrations of 2, 4, 6, 8, and 10 μg/ml. The absorbance value of each solution was measured at 232 nm, using methanol as a blank. The regression equation and correlation coefficient for the absorbance value are determined and displayed.
PROPOSED METHOD VALIDATION
Linearity:
The analytical method's linearity in accordance with ICH criteria was its capacity to produce test results that are precisely proportional to analyte concentration in samples within a specified range. Several aliquots …
Investigations into pH deterioration
The drug's pH effect was achieved using 0.1N Hydrochloric acid, 2N Hydrochloric acid, 0.1N Sodium Hydroxide, and 2Hydroxide solution. The 100 µg/ml drug solutions at pH values between 0 and 14 were made according to the method outlined in table 7, and they were left to stand for four hours. The last step was to measure the absorbances at 237 nm. The equation provided was used to calculate the K value for first order kinetics.
K = (2.303/t) log (Co/C)
Where,
K = the rate constant of the first order,
Initial drug concentration is represented by Co.
The final drug concentration is represented by C.
The findings were presented in a table.
Degradation Research
According to the International Conference on Harmonization (ICH) guidelines on stability testing of new drug compounds and products, stress testing must be performed in order to determine the intrinsic stability profile of the active ingredient. The goal of this study was to use the methodology created to carry out stress degradation investigations on Metformin hydrochloride. Hydrolysis-induced stress degradation under acidic circumstances In a 10 ml volumetric flask, 1 ml of 3 N HCl was combined with 3 ml of a 1000 μg/ml stock solution of Metformin, and the volume was brought to the mark using methanol. After that, the volumetric flask was maintained at ambient temperature for 90 minutes. The solution was pipetted out of this flask, neutralized, and diluted with methanol at a concentration of 30 μg/ml after a 60-minute interval to bring the volume up to 10 ml. The cuvette was used to obtain this solution. The blank was prepared by diluting a 0.5 mL solution of 3N HCl and a 0.5 mL solution of 3N NaOH with methanol in a 10 mL volumetric flask. The aforementioned method is repeated after 90 minutes, but this time only 1 ml of the solution is pipetted out of the flask.
Hydrolysis-induced stress degradation under alkaline conditions
In a 10 ml volumetric flask, 1 ml of 0.1 N NaOH was added to 3 ml of a stock solution of Metformin, and the volume was brought up to the mark with methanol. The volumetric flask was maintained at room temperature for 90 minutes. The dilutions were performed to obtain the desired concentration (20μg/ml), and 1 ml of solution was pipetted out from this flask after a 60-minute time interval, neutralized, and diluted with methanol to a total volume of 10 ml. The answer was subsequently carried in cuvette. The blank consisted of 0.5 ml of a 0.1N HCl solution and 0.5 ml of a 0.1N NaOH solution, both of which were diluted in 10 ml of volumetric flask using methanol. Then, following 90 minutes, the aforementioned procedure was repeated after pipetting out 1 ml of solution from the flask. degradation caused by dry heat The metformin sample was put in a petri dish and heated in an oven at 70°C for 48 hours. The sample, which weighed 10 mg, was diluted with methanol to a volume of 10 ml after 48 hours. The UV-VIS Analysis was conducted in cuvette using the proper concentration (20 g/mL) obtained through dilutions of this solution.
Oxidative deterioration
1 ml of 30% w/v of hydrogen peroxide was added to 1.5 ml of the stock solution of metformin (1000 ug/ml) in a 10 ml volumetric flask, and the volume was completed to the mark using methanol. After that, the volumetric flask was maintained at room temperature for fifteen minutes. One millilitre of the 30% w/v hydrogen peroxide solution was maintained overnight in a volumetric flask containing 10 millilitres of the solution as a blank. To get rid of the extra hydrogen peroxide, both solutions were heated in a boiling water bath. Lastly, the necessary concentration of 30 μg/mL was attained by performing 15-minute dilutions from the stock solution. The solution was then analysed in UV after being placed in a cuvette.
Photolytic deterioration In a photostability chamber, a sample of Metformin was exposed to a near ultraviolet lamp, producing an illumination of at least 1.2 million lux hours. The volume of a 10 mg sample was increased to 10 ml by dissolving it in methanol. Using methanol, the proper dilution (30μg/ml) was made from this solution and then placed in a cuvette for UV analysis.
OUTCOMES AND DISCUSSION
Methanol, pH4 buffer, and pH7 buffer all readily dissolved Metformin. Methanol was selected as the solvent. The drug's highest absorption occurs at 237 nm. Beer's law limits the optical properties of the drug to between 1 and 10 μg/ml, the molar absorbance is 37058.33, the correlation coefficient is 0.9989, and the standard error is 0.012089. The average concentration of the medicine in the formulation was determined to be 100.4% using UV spectroscopy, which employed methanol as a solvent for the drug sample analysis. Accuracy studies showed a % RSD of 99.7% with a 0.352% margin of error. The accuracy's %RSD was determined to be between 0.0209 and 0975. The recovery of resilience was determined to be 99.17±0.1636% and 99.69±0.5953%. The pH deterioration studies of the tablet formulation were determined to be lower at pH 6–8. The force deterioration investigations of metformin tablet formulation were conducted using 0.1 N NaOH for Stress degradation by hydrolysis under alkaline conditions. The results were 21% for 60 minutes and 18% for 90 minutes. Using 3N HCl and hydrolysis under acidic conditions, the product degradation caused by stress deterioration was found to be 22% for 60 minutes and 22% for 90 minutes. The deterioration caused by dry heat was
Using a temperature of 700°C, the experiment was completed in 16% over 48 hours. Hydrogen peroxide was used to perform oxidative degradation, and after 15 min.
Table 1: Degradation in percentage
|
Sr.No |
Degradation condition |
% Degradation |
|
1. |
PH degradation |
25% |
|
2. |
Stress degradation in acidic condition |
18% |
|
3. |
Stress degradation in alkaline condition |
27% |
|
4. |
Oxidative degradation |
16% |
|
5. |
Dry heat degradation |
22% |
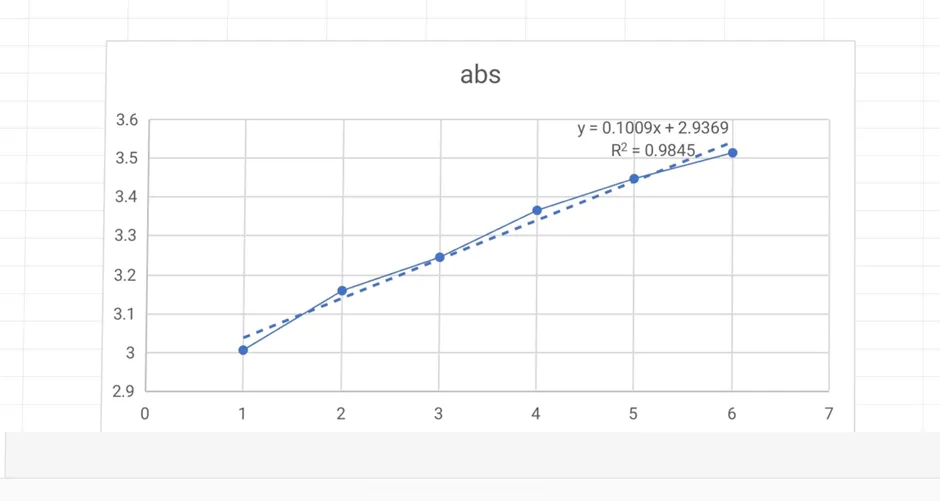
Uv Linearity Graph Of Metformin Hcl
Table 2: Linearity and range
|
Sr.No |
Concentration |
Peak area(Observation) |
|
1 |
10 |
3.0065 |
|
2 |
20 |
3.1486 |
|
3 |
30 |
3.2464 |
|
4 |
40 |
3.3645 |
|
5 |
50 |
3.4487 |
|
6 |
60 |
3.5148 |
Table 3: Calibration data
|
Sr.No |
concentration |
Peak area (Observation) |
Peak area (Predictable) |
Redusial |
|
1 |
10 |
3.0065 |
3.0378 |
-0.0313 |
|
2 |
20 |
3.1486 |
3.1387 |
+0.0099 |
|
3 |
30 |
3.2464 |
3.2396 |
+0.0068 |
|
4 |
40 |
3.3645 |
3.3405 |
+0.0240 |
|
5 |
50 |
3.4487 |
3.4414 |
+0.0073 |
|
6 |
60 |
3.5148 |
3.5423 |
-0.0275 |
Table 4: Regression parameter
|
Parameter |
Value |
|
Slope |
0.1009 |
|
intercept |
2.9369 |
|
Correlation coefficient |
0.9845 |
|
Standard deviation |
0.0204 |
5: Sensitivity Parameter
|
Parameter |
Formula |
Value |
|
LOD |
3.3 × σ/ S |
3.3 |
|
LOQ |
10 × σ/S |
10.1 |
Table 6: LOD and LOQ
|
Parameter |
Value |
|
LOD |
3.3 µg/mL |
|
LOQ |
10.1 µg/mL |
Table 7: Precision
|
Parameter |
Value |
|
concentration |
20µg/mL |
|
Number of samples |
6 |
|
Mean peak area |
3.3633 |
|
Standard deviation |
0.00726 |
|
%RSD |
0.216% |
REFERENCES
Merck & Co. Inc. 2001:998.
and phenformin in human blood and IJPCBS 2013, 3(3), 546-553 ISSN: 2249-9504-553 by Narasimha Rao et al. by RP-HPLC, urine. J. Biomed. Appl. Chromatog
Merck & Co. Inc. 2001:998.
and phenformin in human blood and IJPCBS 2013, 3(3), 546-553 ISSN: 2249-9504-553 by Narasimha Rao et al. by RP-HPLC, urine. J. Biomed. Appl. Chromatog


Gaikwad Sanjana, Gavhane Akshay, Dhale Chaitali, Analytical method validation of metformin HCL by UV, Int. J. of Pharm. Sci., 2026, Vol 4, Issue 5, 7179-7186, https://doi.org/10.5281/zenodo.20406057
 10.5281/zenodo.20406057