

We use cookies to ensure our website works properly and to personalise your experience. Cookies policy
Pachamuthu College of Pharmacy, Dharmapuri.
Raman spectroscopy are analytical instrumentation and analytical technique. Raman spectroscopy is a non-destructive chemical analysis technique which provides detailed information. It is based upon the interaction of light with the chemical bonds. The spectroscopic techniques used for qualitative and quantitative purpose. The qualitative analysis can be performed by using measuring the intensity of scattered radiation. The Raman spectroscopy is used in the forensic analysis of different types of inks in a questioned document, and it is used in characterizing trace amounts of body fluids. The Raman spectroscopy is the analysis of the drug above and related illness. Importance of Raman spectroscopy in pharmaceutical analysis, Raman spectroscopy has been an indispensable analytical tool in pharmaceutical industry and pharmaceutical analysis departments. It is extensively used for the identification and characterization of the Active Pharmaceutical Ingredients (API), excipients and finished pharmaceutical products. When a monochromatic light interacts with a molecule. In most photon is scattered in elastically of (Rayleigh scattering) while a small fraction undergoes inelastic scattering (Stokes and Anti-Stokes) due to energy exchange with molecular vibration. Anti-stokes (?? + ?m), Rayleigh (??), Stokes (?? ? ?m). Source used is a laser source in the Raman spectrometry. There is high intensity of the fine laser is used for Raman spectroscopy. Quality by design in drug manufacturing ensures the raw materials in purity and the final products in quality. Drug formulation includes additives and coating to product active ingredients from degradation, maximizing shelf life as the period a drug maintains over 90% potency
Raman spectroscopy are analytical instrumentation and analytical technique. It is availability of commercial instrumentation at moderate cost. Raman Spectroscopy is a non-destructive chemical analysis technique which provides detailed information about chemical structure, phase and polymorphy, crystallinity and molecular interactions. It is based upon the interaction of light with the chemical bonds within a material. C.V Raman and Krishnan discovered the Raman spectroscopy in 1928. The visible of the wavelength of a small fraction of a radiation is scattered by a certain compounds (or) molecule differs from the incident beam and the shift in wavelength depends on the chemical structure of a molecules is responsible for the scattering. C.V Raman was awarded the 1931 Nobel Prize in discovery and systematic exploration. Although can be striking similarities b/w Raman spectra and IR spectra. But differ kinds of groups that are IR spectra and Raman spectra active techniques complementary. But further than. Competitive techniques IR spectroscopy is compared than Raman spectroscopy most important advantages of the water usually for best solvents. In additions of Raman spectroscopy signal are visible usually in the visible (or) near IR region is used as the glass (or) quartz cells. This eliminates the need to use materials like sodium chloride, which are easily affected by atmospheric humidity. In these advantages of Raman spectroscopy was not widely used by the scientists (or) chemists.
But 1960 after introduced the laser source, easily after readily handling of the instrumentations. This technique based on light scattering, monochromatic radiation exposure to sample. The monochromatic laser beam illuminates the samples resulting in scattered lights from photons. Each photon is in different frequency and vibrational mode. The spectroscopic techniques used for qualitative and quantitative purpose. The qualitative analysis can be performed and by using measuring the frequency scattered radiation. Quantitative analysis can be performed by measuring the intensity of scattered radiation. When a monochromatic light is scattered by molecules, a small fraction of the scattered light is observed to have a different frequency from that of the irradiating light. It is known as the Raman effect. Vibrations that are active in Raman may be inactive in the infrared and vice versa. A unique feature of Raman scattering is that each line has a characteristic polarization, and polarization data provide additional information related to molecular structure. The Raman spectroscopy is used in the forensic analysis of different types of inks in a questioned document and is used in characterizing trace amounts of body fluids. The describing the application of the infrared (IR) and Raman spectroscopy (RS) to the identification of the explosives. IR spectroscopy is a complementary technique to Raman spectroscopy and is a discussed in many cases of completeness. The Raman spectroscopy in the analysis of the drugs of abuse and related illicit compounds. Importance of Raman spectroscopy in pharmaceutical analysis. Raman spectroscopy has been an indispensable analytical tool in pharmaceutical industry and pharmaceutical analysis departments. It is a due to its accuracy, speed, and a versatility. Raman spectroscopy is extensively used for the identification and characterisation of the Active Pharmaceutical Ingredients (API), excipients and finished pharmaceutical products. Raman spectroscopy is widely used and applying is raw materials identification, quality control, process monitoring and quality assurance is during pharmaceutical manufacturing.
In recent years, Raman spectroscopy has importance in Process Analytical Technology (PAT) and Quality by design (QbD) approaches. Machine Learning (ML) with Raman spectral analysis has enhanced data interpretation, accelerated pharmaceutical research, improved analytical accuracy and quality assessment. Raman spectroscopy emerged a powerful, indispensable, reliable, and analytical technique in modern pharmaceutical analysis, quality assurance, regulatory compliance, and patient safety.
Principle:
Raman spectroscopy is an analytical instrumentation. It is a scattering technique. In based on the Raman effect. Frequency of a small fraction of the scattered radiation is but different
from frequency of monochromatic incident radiation. Raman spectroscopy: Sample (or) substance is illuminated with a monochromatic laser light (or) beam which are interacts with the molecules of samples and scattered light. The scattered of light having a frequency different from that have incident light, is used is a Raman spectrum. The spectral arise due to inelastic collision between the incident monochromatic radiation and molecules of samples. When monochromatic radiations are strikes at the sample. It scatters in an all directions after interacting with the sample molecules. The Rayleigh scattering as only a small fraction of scattered radiation and the constitutes Raman scattering. When the frequency is incident radiation is higher than frequency of the scattered radiation, Stokes line appears in Raman spectrum. But when frequency of incident radiation is lower than frequency of scattered radiation is low, anti-Stokes lines appear in a Raman spectrum. The scattered radiation is usually measured at the right angle.
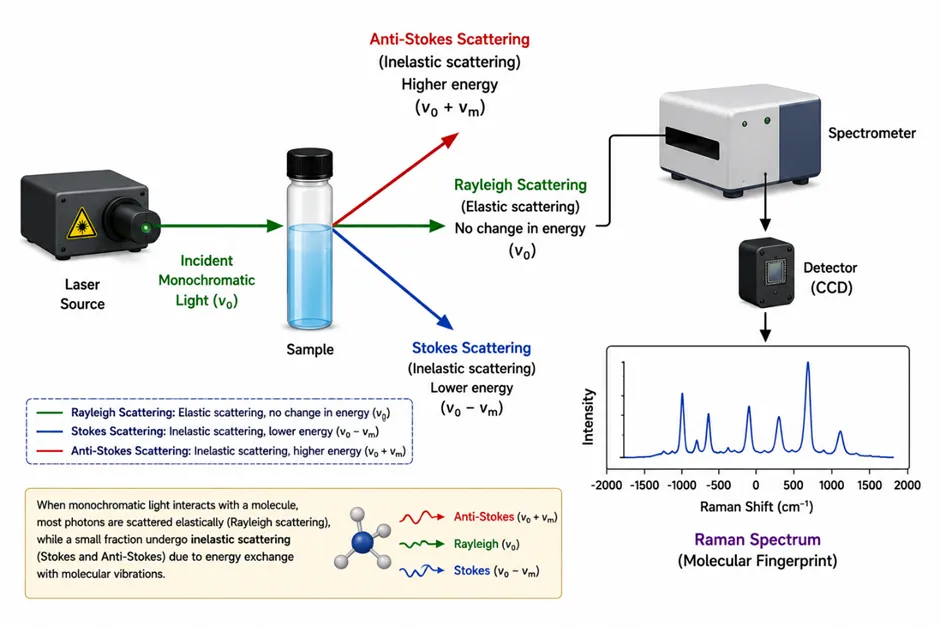
Figure 1 Basic Principle of Raman Spectroscopy
While anti-Stokes bands are measured by fluorescing samples. Because the fluorescing causes in interference with Stokes bands. The Raman shifts do not depend on wavelength of incident radiation. Raman scattering depends on wavelength of incident radiation. Since Raman scattering the due to water is low. The water is ideal solvent for dissolving samples. The glass can be used for the optical components for Raman spectrophotometer. A Raman spectrum is presented as intensity versus wavelength shift. Raman spectra can be recorded over a range of 4000-10cm⁻¹(10⁻¹). The normal modes of vibration in organic molecules occurs range in 4000-400Δcm⁻¹. Depending on spectrophotometer design and optical components. Raman spectra cover the wavenumber between 400-5Δcm⁻¹ and 4000-3800Δcm⁻18. A Raman spectrum is significantly simpler than (IR) Infrared. Mercury arc lamp was used as the light source in Raman spectrophotometer in early days. In nanometre’s is 435.8nm line called low pressured mercury arc lamp used in a light source until 1960. The Laser sources become available in late 1960's and completely replaced the light sources of mercury arc lamps. The Laser light is provided in stable and intense beam of radiation. Wide range of lasers such as the Argon ion laser (488 and 514.5 nm), Krypton ion laser (530.9 and 647.1 nm), He-Ne (6328 nm), Nd: YVO₄ diode lasers (532nm). Can be used as light source in Raman spectrophotometer. Thermoelectrically cooled photomultiplier tubes and photodiode array detectors were used in early models of dispersive Raman spectrophotometers. Advances in instrumentation and technology replace these detectors with more sensitive charge transfer devices (CTDs) such as charge-coupled devices (CCDs) and charge-injection devices (CIDs). These devices act as a detector and use in the form of arrays. In CTD’s arrays, photo site converts the incoming optical signal into charge which is integrated and transferred to readout devices. Multichannel CCD detectors are used with laser wavelengths of less than 1 lm while single element low band-gap semiconductor such as Germanium (Ge) or Indium–Gallium–Arsenic (In GaAs) detectors are used with laser wavelengths of greater than Commercial Fourier Transform-Raman spectrophotometers (FT-Raman) were introduced in late 1980’s to improve the detection system capable of overcoming the limitations of CCD and other detectors for operating in the near-IR region when using 1064 nm laser excitation. FT-Raman spectrophotometer uses a Michelson interferometer and continuous wave laser such as Nd–YAG which emits the radiation at 1064 nm. In GaAs and germanium (Ge) detectors are operated at cryogenic temperatures to reduce noise and thus raise the signal-to-noise ratio. Cryogenic temperature is a temperature at which molecular motion comes as close as theoretically possible to ceasing completely. At cryogenic temperature, materials are as close to a static and highly ordered state as is possible. Since water absorbs in the 1000 nm region, aqueous samples cannot be analysed by FT-Raman spectrophotometer. Depending on the area of use, Raman spectrophotometers can be categorized into two broad classes: lab-based spectrophotometers and in-field, in-situ or down-field use Raman spectrophotometers which include portable and hand-held devices or remote or stand-off systems. The basic principle is same in each case and these systems are differentiated by versatility of an instrument and size and relative cost of its components. More compact components are used in on-site Raman spectrophotometers. Benchtop, handheld, portable, remote or stand-off Raman spectrophotometers are available for on-site analysis and research purpose. Low sensitivity due to weak Raman scattering is the major problem associated with this technique. However, sensitivity can be enhanced using Resonance Raman Spectroscopy (RRS) and Surface Enhanced Raman Spectroscopy (SERS). In RRS, frequency of incident radiation matches with an electronic transition of molecule and because of this match, much more intense Raman spectrum is obtained. SERS was first reported in 1974 by Fleishman and colleagues. SERS is a modified technique in which sample is adsorbed on a colloidal metallic surface (silver, gold or copper) and thereby improves the intensity of Raman signals and quenches the fluorescence caused by cutting agents, diluents and matrices. The combination of RRS and SERS techniques (i.e. Surface Enhanced Resonance Raman spectroscopy (SERRS) can amplify the sensitivity up to ten orders of magnitude as compared to Raman spectroscopy. In conventional Raman spectroscopy, concentration of solutions must be high. Fluorescence can also be reduced by exciting the sample with near IR laser such as Nd–YAG at 1064 nm. First Raman microspectrophotometer was developed in France in 1976. In Raman micro spectroscopy, Raman spectrophotometer is interfaced to an optical microscope which enables both visual and spectroscopic examinations as either as single point, mapping or imaging measurements. Microscope is used to focus the laser beam onto the sample. Raman micro spectrophotometry enables the visual inspection of sample and facilitates spectroscopic analysis of a limited amount of sample or a selected small region within a sample. Sample size of about · 5 lm can be examined by Raman microspectrophotometer equipped with short wavelength visible laser. Coupling of Raman spectrophotometer to microscope and advent of portable and handheld Raman spectrometers improve the application space of this technique. In-situ analysis is possible nowadays without any sample pretreatment. Portable Raman spectrophotometers are useful for the examination of large or very fragile objects and artefacts. The incorporation of short wavelength lasers in Raman spectrophotometers opens the doors for use of telecommunications-type optical fibres such as remote-fibreoptics probes which can be operated over long distances (>10 m in some instances) and are well suited for in-situ or on-site analysis of samples. These Fiber optic probes can also be used to record the Raman spectrin locations remote from the sample site and thereby prevent the exposure of investigator to hazardous environment.
Theoretical Aspects of Raman Spectroscopy:
It is based on the Raman Effects, which occurs when the light strikes a molecule and interacts with its electron cloud and bonds. In the case of spontaneous Raman scattering, a photon elevates the molecule from its ground state to a temporary virtual energy state. As the molecule returns to it’s a ground state. It does so in a different rotational state. This transition results in a change in energy, causing the emitted photon’s frequency to shift from the original excitation frequency. For a molecule to display a Raman Effect there must be a change in its molecular polarization potential or a deformation of the electron cloud relative to the vibrational coordinate. The extent of this change in polarizability directly influences the intensity of the Raman scattering. A typical Raman spectrum spans a spectral range of 0-3500 cm-1. The position and intensity of vibrational bands are indicative of the molecular movements and the atoms involved in the chemical bonds, their arrangement, and their surrounding environment. Consequently, specific sub molecular groups generate bands within distinct spectral regions, forming the empirical foundation for interpreting vibrational spectra. Raman spectroscopy has a variety of conventional application
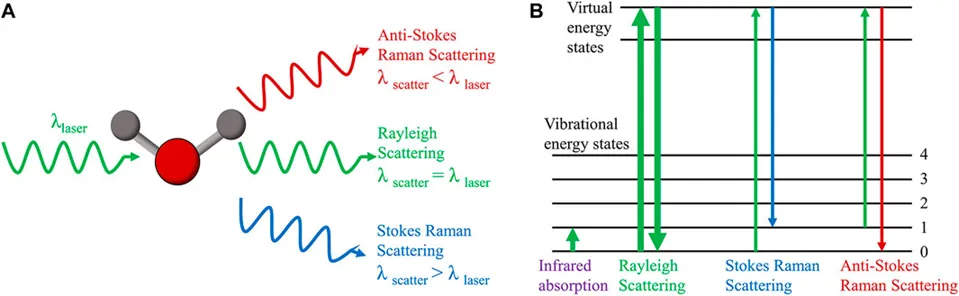
Figure 1 Basic principles of Raman and Rayleigh scattering
Instrumentation Of Raman Spectroscopy
Instrumentation for modern Raman spectroscopy consists of a laser source, a sample illumination system, and a suitable spectrometer as illustrated. The performance requirements for these components are high stringent than for the molecular spectrometers we have already described, however, because of the inherent weakness of the Raman scattering signal compared
|
Figure 3 Raman spectroscopy block diagram |
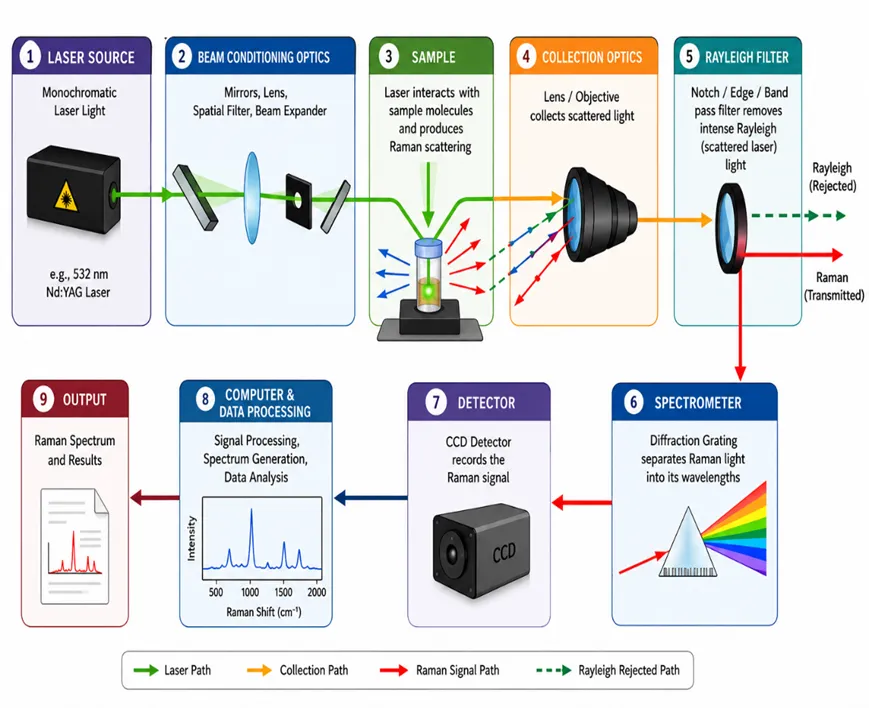
Figure 3 Raman spectroscopy block diagram
Laser Source
The sources used in the Raman spectrometry are nearly always lasers used. There is high intensity. Five of the most common lasers used for the Raman spectroscopy are listed Table 1.
Table 1
|
Laser type |
Wavelength nm |
|
Argon ion |
488.0 or 5145 |
|
Krypton ion |
5309 or 647. |
|
Helium Heon |
632.8 |
|
Diode |
785 |
|
Nd-YAG |
1064 |
The Argon and krypton ion sources that emitted in the blue and green regions of the spectrum. The last two sources are the He–Ne, which emit in near-IR radiation are finding more use as excitation sources. Neon-IR sources have two major advantages in short wavelength lasers. The first source is high power (up to 50 W) without causing photodecomposition of the sample. Nd–YAG laser, and its frequency transforms Raman spectrometers, is particularly effective in eliminating fluorescence. The two lines of the diode lasers at 785 and 830 nm.
Sample Illumination System
Sample handling for Raman spectroscopic measurements is simpler than IR spectroscopy. The glass can be used for windows, lenses, and other optical compounds. In addition, the laser source is easily focused on the small area via the sample, and the emitted radiation is efficiently focused on the slit of a spectrometer. A common sample for non-absorbing liquid samples is an ordinary glass melting-point capillary.
It is divided into three types.
(a) Gas samples.
(b) Liquid sample.
(c) Solid samples.
(a) Gas Samples
The gases are normally contained in glass tubes, 1–2 cm in diameter and 1 mm thick. The gases can be sealed in small capillary tubes. For the weak scatterers, an external multiple-pass setup with mirrors can be used. The resulting Raman scattering is perpendicular to the sample tube and to the excitation laser beam is then focused on the entrance slit of the spectrometer by a large Lens.
(B) Liquid Samples
Liquids can be sealed in ampoules, glass tubes, or capillaries for illuminating liquids. Capillaries can be as small as 0.5–0.01 mm bore and 10 mm long. The spectra of nanolitres volumes of sample can be obtained with capillary cells. A large cylindrical cell, such as that illustrated can be used to reduce local heating, particularly for absorbing samples. The laser beam is focused to an area near the wall to minimize absorption of the incident beam. Further reduction of localized heating is often achieved by rotating the cell. A major advantage of sample handling in Raman spectroscopy compared with IR arises because water is a weak Raman scatterer but a strong absorber of IR radiation. Thus, aqueous solutions can be studied by Raman spectroscopy but only with difficulty by 1R. This advantage is particularly important for biological and inorganic systems and in studies dealing with water pollution.
(C) Solid Samples.
Raman spectra of solid samples are often acquired by filling a small cavity or capillary with the sample after it has been ground to a tine powder. Polymers can usually be examined directly with no sample pretreatment. In some cases, KBr pellets like those used in IR spectroscopy are employed. Dilution with KBr can reduce decomposition of the sample produced by local heating.
Optical Components
Bottom of Form
Spectrometers
Until the early 1980s, Raman spectrometers were similar in design and used the same type of components as the classical UV -visible dispersing instruments described in Section 130-3. Most spectrometers employed double-grating systems to minimize the amount of stray and Rayleigh-scattered radiation reaching the transducer. Photomultipliers served as transducers. Now, however, most Raman spectrometers being marketed are either Fourier transform instruments equipped with cooled germanium transducers or multichannel instruments based on charge-coupled devices.
Detectors
A sensitive, low capturing Raman scattered light. Cooled CCD cameras are typically preferred for UV-NIR excitation, though they are often the most expensive component. For certain applications, point or basic array detectors are more cost provide limited spectral information spectroscopy traditionally uses a single FT spectrometer, offering lower sensitivity than systems with cooled CCDs and dispersive spectrometers. Recent advancements in Indium Phosphide (InP) /Indium Gallium Arsenide Phosphide (InGaAsP) array detectors may improve IR-excited Raman spectroscopy.
Types Of Raman Spectroscopy
Uses a near-IR laser (usually 1064 nm) with Fourier transform detection instead of dispersive optics. This avoids fluorescence interference, which is common in pharmaceutical samples.
The excitation wavelength matches an electronic transition of the molecule (like a chromophore), greatly enhancing signal intensity (10³–10⁶ fold) for that specific group.
Sample is adsorbed onto a roughened metal surface (gold, silver, or nanoparticles), giving huge signal enhancement useful for trace analysis of drugs.
Combines Raman with a confocal microscope for depth-resolved, spatially precise measurements useful for mapping drug distribution in tablets or tissues.
Combines SERS-type enhancement with an AFM/STM tip, giving nanoscale spatial resolution used for single-molecule level analysis.
Collects signal from points offset from the laser's entry point, allowing analysis through packaging or tablet coatings without opening the sample useful for non-invasive pharmaceutical screening.
(e.g., detecting counterfeit drugs through blister packs).
ADVANTAGES
(a) Non-destructive Analysis: Raman spectroscopy allows for the analysis of samples without altering or damaging them, making it ideal for sensitive materials like pharmaceuticals, artworks, or biological samples.
(b) Minimal Sample Preparation: Unlike other techniques, Raman spectroscopy often requires little to no sample preparation, saving time and reducing the risk of introducing errors.
(c) High Spatial Resolution: The Raman microscopy enables too the study of materials at the micron scale, providing detailed spatial information about the chemical composition and structure of heterogeneous samples.
(d) Wide Applicability: Raman spectroscopy can be applied to the broad range of the materials, including powders, solids, liquids and gases, in a variety of environments, from high-pressure systems to biological tissues.
(e) Chemical Fingerprinting: It provides unique molecular "fingerprints" based on vibrational modes, which allows to identification of the substances with high specificity and sensitivity.
Limitations
Application
Raman spectroscopy is increasingly being utilized across various sectors of the pharmaceutical industry. Like infrared (IR) spectroscopy, it delivers insights into fundamental vibrational bands, particularly within the fingerprint region, which ensures a high level of specificity in analytical processes. This technique serves as an excellent complement used to established analytical methods of such as nuclear magnetic resonance (NMR), mass spectrometry (MS), and elemental analysis. The potential of Raman spectroscopy in pharmaceuticals is substantial. It enables the swift identification of compounds within drug mixtures, active ingredients, and excipients, facilitates the detection of contaminants, aids in the characterization of formulated products, and enhances the understanding of blending processes in pharmaceutical formulations. The following section provides a detailed overview of the applications of Raman spectroscopy in pharmaceuticals and other domains.
Applications In Pharmaceuticals
Comparison Of Raman with Ir Spectroscopy
|
S. No |
Raman Spectroscopy |
IR Spectroscopy |
|
1 |
It is due to the scattering of light by the vibrating molecules |
It is the results of absorption of light by vibrating molecules |
|
2 |
The vibration is Raman active if it causes a change in polarizability Symmetric bands are active |
Vibration is IR active if there is change in dipole moment. Asymmetric bands are active |
|
3 |
The molecule need not possess a permanent dipole moment. |
The vibration concerned should have a change in dipole moment during vibration. |
|
4 |
Water can be used as a solvent as it does not absorb Visible or NIR |
Water cannot be used due to its intense absorption of IR, there is no single solvent suitable throughout complete IR range. |
|
5 |
Sample preparation is not very elaborate; Sample can be in any state. Glass can be used as material of construction |
Sample preparation is elaborate. Glass cannot be used. Na, K, Ag, Ca salts are used. |
|
6 |
Give an indication of covalent character in the molecule |
Give an indication of ionic character in the molecule. |
|
7 |
Incident radiation is from Visible or near IR region(800-2500nm) |
Incident radiation is from mid IR range (2.5-50 micron) |
|
8 |
Majorly used for quantitative analysis, and also in qualitative analysis |
Majorly used for qualitative analysis and with the limited extent in quantitative analysis |
|
9 |
Spectra are simpler than IR |
IR spectra are more complex |
|
10 |
Cost of instrumentation is very high |
Comparatively inexpensive |
CONCLUSION
Raman spectroscopy is a power full analytical technique Its non destructine nature, minimal sample preparation rapid analysis. The Raman spectroscopy is widely used for identification and characterization of compound, polymorphic analysis.
Although limitations such as weak Raman scattering, fluorescence interference, and the relatively high cost of advanced instrumentation may restrict its applications, recent developments have significantly improved its sensitivity and analytical performance. Techniques such as Surface-Enhanced Raman Spectroscopy (SERS), Raman microscopy, portable Raman instruments, and advanced data-processing methods have further expanded its applications.
Overall, Raman spectroscopy continues to be an important complementary analytical technique, particularly when combined with other spectroscopic and chromatographic methods. With continuing advancements in instrumentation, chemometrics, artificial intelligence, and miniaturized systems, Raman spectroscopy is expected to play an increasingly important role in rapid, sensitive, and non-destructive analysis in pharmaceutical research and quality control.
REFERENCES

A.Prakash, Raman Spectroscopy Principles, Instrumentation, Recent Advances and Pharmaceutical Applications – A Review, Int. J. of Pharm. Sci., 2026, Vol 4, Issue 8, 2491-2502, https://doi.org/10.5281/zenodo.21934438
 10.5281/zenodo.21934438