

We use cookies to ensure our website works properly and to personalise your experience. Cookies policy
Avanthi Institute of Pharmaceutical Sciences, Hyderabad, Telangana 501510
Cleaning validation is an essential requirement in pharmaceutical manufacturing to ensure the effective removal of drug residues from equipment surfaces and to minimize the risk of cross-contamination. The present study aimed to develop and validate a rapid, simple, accurate, and cost-effective UV spectrometric method for the determination of ibuprofen residues on pharmaceutical equipment surfaces. Ibuprofen exhibited maximum absorbance at 222 nm, and methanol was selected as the optimum solvent due to its excellent solubility and analytical compatibility. The method demonstrated linearity over the concentration range of 2–12 µg/mL with a correlation coefficient (R²) of 0.9998. Validation was carried out in accordance with ICH Q2(R2) guidelines. The method showed excellent specificity, accuracy (mean recovery 99.95%), repeatability and intermediate precision (%RSD 0.26%), robustness, and solution stability. The calculated LOD and LOQ were 0.155 µg/mL and 0.468 µg/mL, respectively, indicating high analytical sensitivity. Swab recovery from SS 316L stainless steel surfaces was 99.52%, confirming the efficiency of the sampling procedure. The developed method was found to be reliable, reproducible, and suitable for routine cleaning validation of ibuprofen residues in pharmaceutical manufacturing facilities. Its simplicity, rapid analysis, and low operational cost make it an attractive alternative for routine quality control laboratories.
Pharmaceutical manufacturing requires stringent control of equipment cleanliness to prevent cross-contamination, carryover of active pharmaceutical ingredients (APIs), and potential alteration of the quality, safety, and efficacy of subsequently manufactured products. During manufacturing operations, residues of APIs may remain on product-contact surfaces despite routine cleaning procedures. If these residues are not adequately removed, they may be transferred to subsequent batches and compromise product quality. Consequently, cleaning validation is an essential component of pharmaceutical quality assurance and provides documented evidence that an established cleaning procedure consistently reduces equipment residues to predetermined acceptable limits [18–21].
The analytical procedure used for cleaning validation is a critical component of the overall validation strategy. It must be sufficiently specific, sensitive, accurate, precise, and reproducible to detect and quantify residual drug at or below the established acceptance limit. Appropriate validation of the analytical procedure is therefore necessary to demonstrate its suitability for the intended purpose. The principles described in ICH Q2(R1) and the updated ICH Q2(R2) provide a framework for establishing analytical performance characteristics such as specificity, linearity, accuracy, precision, detection capability, and robustness [3,4]. Pharmacopoeial standards, including the United States Pharmacopeia, British Pharmacopoeia, and Indian Pharmacopoeia, further provide general requirements relevant to pharmaceutical quality control and analytical testing [19–21].
Ibuprofen, a non-steroidal anti-inflammatory drug (NSAID), is widely used for its analgesic, antipyretic, and anti-inflammatory properties. Its pharmacological activity is primarily associated with inhibition of cyclooxygenase-mediated prostaglandin synthesis, thereby reducing inflammation, pain, and fever [5,10,11]. The extensive use of ibuprofen in pharmaceutical manufacturing makes the control of its residues on shared manufacturing equipment particularly important where subsequent products may be manufactured on the same processing surfaces. Reliable detection of trace ibuprofen residues is therefore necessary to demonstrate the effectiveness of cleaning procedures and minimise the risk of cross-contamination.
Several analytical approaches have been reported for the determination of ibuprofen. Spectrophotometric procedures have been described for the estimation of ibuprofen in pharmaceutical preparations, demonstrating the applicability of ultraviolet-visible spectrophotometry as a simple and accessible quantitative technique [1,9]. Chromatographic procedures, particularly RP-HPLC, have also been reported for ibuprofen determination either alone or in combination with other pharmaceutical ingredients [2]. Although chromatographic techniques generally provide high selectivity and sensitivity, their application to routine cleaning validation may involve greater operational complexity, solvent consumption, analysis time, and instrumentation requirements. For laboratories requiring rapid screening and routine assessment of equipment surfaces, a suitably validated UV spectrometric procedure can offer a practical alternative when the analyte exhibits adequate ultraviolet absorbance and potential matrix interference is appropriately controlled.
The selection of an appropriate sampling strategy is equally important in cleaning validation. Swab sampling provides a direct approach for recovering residual drug from defined equipment surfaces and is particularly useful for evaluating difficult-to-clean and representative product-contact locations. The analytical method must therefore demonstrate adequate recovery from the relevant surface material in addition to satisfactory performance in solution. Establishing acceptable recovery and validating the complete sampling and analytical procedure strengthens the reliability of residue measurements and provides greater confidence in the effectiveness of the cleaning process [18,23–25].
Although ibuprofen can be quantified by established spectrophotometric and chromatographic techniques, there is a need for a rapid, economical, and adequately validated UV spectrometric procedure specifically applicable to cleaning-validation samples. Such a method could reduce analytical turnaround time and resource requirements while supporting routine monitoring of pharmaceutical equipment.
Accordingly, the present study was undertaken to develop and validate a rapid UV spectrometric method for the determination of ibuprofen residues on pharmaceutical equipment surfaces. The proposed procedure was evaluated for critical analytical characteristics, including specificity, linearity, accuracy, precision, sensitivity, robustness, and solution stability, with particular emphasis on recovery from stainless-steel surfaces. The developed method is intended to provide a reliable and practical analytical tool for routine cleaning-validation studies and assessment of residual ibuprofen on pharmaceutical manufacturing equipment.
2. MATERIALS & METHODS
Chemicals and Reagents
Ibuprofen reference standard was obtained from an authenticated pharmaceutical source and used for preparation of standard and validation solutions. Methanol of analytical grade was selected as the extraction solvent based on preliminary solubility and spectrophotometric suitability studies. Purified water was used wherever required. All reagents were of analytical grade and were used without further purification.
Instrumentation
UV spectrometric measurements were performed using a double-beam UV–Visible spectrophotometer equipped with matched quartz cells and operated with appropriate instrument-control software. An analytical balance with suitable sensitivity was used for weighing the reference standard. Ultrasonication was employed to facilitate dissolution and extraction of ibuprofen. Stainless-steel 316L plates representative of pharmaceutical equipment contact surfaces were used for surface-recovery experiments.
Selection of Solvent and Analytical Wavelength
Preliminary studies were performed using purified water, ethanol, acetonitrile, and methanol to identify a suitable solvent for ibuprofen extraction and spectrophotometric analysis. Methanol provided satisfactory solubility and a stable analytical response and was therefore selected as the extraction and dilution solvent. The ultraviolet absorption spectrum of ibuprofen was recorded over the appropriate wavelength range, and the wavelength showing maximum absorbance with a stable baseline and adequate sensitivity was selected for quantitative analysis. The maximum absorption wavelength was established as 222 nm and used throughout the analytical procedure.
Preparation of Standard Stock Solution
An accurately weighed quantity of ibuprofen reference standard was transferred into a volumetric flask and dissolved in methanol with the aid of sonication. After complete dissolution, the solution was diluted to volume with the same solvent to obtain a stock solution of known concentration. Appropriate aliquots of the stock solution were subsequently diluted with methanol to prepare working standard solutions for method development and validation.
Preparation of Calibration Standards
A series of ibuprofen standard solutions covering the concentration range of 2–12 µg/mL was prepared by suitable dilution of the stock solution with methanol. The absorbance of each solution was measured at 222 nm against methanol as the blank. A calibration curve was constructed by plotting absorbance against the corresponding concentration of ibuprofen. Linear regression analysis was performed, and the regression equation and correlation coefficient were determined.
Cleaning-Validation Surface Preparation
Stainless-steel 316L plates were selected as representative pharmaceutical equipment surfaces. Before use, the plates were thoroughly cleaned to remove any pre-existing contaminants and allowed to dry. A defined surface area was marked on each plate to ensure consistent application and recovery of the test substance.
A known quantity of ibuprofen standard solution was uniformly applied to the predetermined surface area and allowed to dry under controlled conditions. The contaminated plates were subsequently subjected to the established swab-recovery procedure. Blank surface samples were processed in parallel to verify the absence of background interference.
Swab Sampling Procedure
A suitable pharmaceutical-grade swab was moistened with methanol and used to recover the ibuprofen residue from the defined stainless-steel surface. The surface was systematically swabbed using horizontal and vertical strokes to maximise recovery of the deposited residue. The swab was then transferred into a suitable container containing a measured volume of methanol.
The swab was extracted by vigorous agitation and sonication to transfer the recovered ibuprofen into the solvent. The extract was allowed to equilibrate and was subsequently analysed spectrophotometrically at 222 nm. Appropriate blank swabs and solvent blanks were processed using the same procedure to account for any contribution from the sampling materials or extraction solvent.
Determination of Swab Recovery
Swab recovery was evaluated by applying known quantities of ibuprofen to the stainless-steel 316L surface followed by the complete sampling and extraction procedure. Recovery was calculated by comparing the experimentally recovered amount with the amount initially applied to the surface.
The percentage recovery was calculated using:
% Recovery = (Recovered amount / Applied amount) × 100
The recovery study was performed at appropriate concentration levels to establish the efficiency and reproducibility of the sampling procedure. The experimentally obtained recovery from the stainless-steel surface was approximately 99.52%, demonstrating efficient recovery of ibuprofen under the established conditions.
Analytical Method Validation
The developed UV spectrometric procedure was validated according to the principles described in ICH Q2(R1) and with consideration of the updated analytical procedure validation framework described in ICH Q2(R2). The method was evaluated for specificity, linearity, accuracy, precision, sensitivity, robustness, and solution stability.
Specificity
Specificity was assessed by analysing methanol, blank swab extracts, and ibuprofen standard solutions. The absorbance response at 222 nm was examined to confirm that the solvent and sampling materials did not produce significant interference with the determination of ibuprofen.
Linearity
Linearity was established over the concentration range of 2–12 µg/mL. Each concentration was analysed under identical experimental conditions, and the corresponding absorbance values were recorded. The calibration plot was generated by plotting absorbance versus concentration, and linear regression analysis was performed to determine the slope, intercept, and correlation coefficient.
Accuracy
Accuracy was evaluated by recovery studies using known quantities of ibuprofen added to the analytical matrix at selected concentration levels. For cleaning-validation applications, the recovery experiment incorporated the complete procedure, including surface application, drying, swab sampling, extraction, and spectrophotometric measurement. Percentage recovery and relative standard deviation (%RSD) were calculated.
Precision
Repeatability was evaluated by analysing replicate preparations of ibuprofen at the selected analytical concentration under identical conditions. Intermediate precision was assessed by repeating the procedure on different occasions and, where applicable, by different analysts. Precision was expressed as %RSD of the measured concentrations.
Limit of Detection and Limit of Quantitation
The sensitivity of the method was established by determining the limit of detection (LOD) and limit of quantitation (LOQ). These parameters were calculated from the standard deviation of the response and the slope of the calibration curve using:
LOD = 3.3σ/S
LOQ = 10σ/S
where σ represents the standard deviation of the response and S represents the slope of the calibration curve. The experimentally established LOD and LOQ were approximately 0.155 µg/mL and 0.468 µg/mL, respectively.
Robustness
Robustness was investigated by introducing deliberate small variations in selected analytical conditions, including detection wavelength and other relevant spectrophotometric parameters. The influence of these changes on absorbance response and calculated concentration was evaluated. The method was considered robust when the deliberate variations did not produce a significant change in analytical performance.
Solution Stability
The stability of prepared ibuprofen standard and sample solutions was evaluated by storing the solutions under the intended laboratory conditions and analysing them at predetermined intervals. The results were compared with freshly prepared solutions to determine any significant change in absorbance or calculated concentration.
Calculation of Surface Residue
The amount of ibuprofen recovered from the sampled surface was calculated from the calibration equation and corrected, where appropriate, for the extraction volume and sampling area. The residue level was expressed in terms of the amount of ibuprofen recovered per unit surface area. The obtained residue value was compared with the predefined cleaning-validation acceptance limit to determine whether the equipment surface met the established cleanliness requirement.
Statistical Analysis
All measurements were performed using replicate determinations, and the results were expressed as mean ± standard deviation wherever applicable. Precision and variability were assessed using percentage relative standard deviation (%RSD). The analytical results were interpreted in accordance with predefined validation criteria and applicable pharmaceutical quality-control requirements.
3. RESULTS AND DISCUSSION
Solubility Studies
Table 1: Solubility of Ibuprofen in Different Solvents
|
Sr. No. |
Solvent |
Solubility |
Observation |
|
1 |
Purified Water |
Practically insoluble |
Turbid solution with undissolved particles |
|
2 |
Methanol |
Freely soluble |
Clear and transparent solution |
|
3 |
Ethanol |
Freely soluble |
Clear solution with complete dissolution |
|
4 |
Acetonitrile |
Soluble |
Clear solution |
|
5 |
0.1 N Sodium Hydroxide |
Freely soluble |
Complete dissolution due to salt formation |
|
6 |
0.1 N Hydrochloric Acid |
Slightly soluble |
Slight turbidity observed |
Method Development
Table 2: Method Development Trials for UV Spectrometric Analysis of Ibuprofen
|
Trial No. |
Parameter Evaluated |
Condition Studied |
Observation |
Inference |
|
1 |
Solvent |
Purified Water |
Poor solubility with turbid solution |
Not suitable |
|
2 |
Solvent |
Ethanol |
Good solubility with satisfactory absorbance |
Acceptable |
|
3 |
Solvent |
Acetonitrile |
Good solubility but relatively expensive solvent |
Less preferred |
|
4 |
Solvent |
Methanol |
Complete dissolution with clear solution and stable absorbance |
Selected |
|
5 |
Wavelength |
220 nm |
Good absorbance but lower than λmax |
Not selected |
|
6 |
Wavelength |
222 nm |
Highest absorbance with well-defined peak |
Selected |
|
7 |
Wavelength |
224 nm |
Slight decrease in absorbance |
Not selected |
|
8 |
Working Concentration |
10 µg/mL |
Stable absorbance within linear range |
Selected |
|
9 |
Sample Extraction |
Sonication for 10 min |
Complete extraction with clear solution |
Selected |
|
10 |
Cuvette |
Quartz (1 cm path length) |
Stable and reproducible absorbance |
Selected |
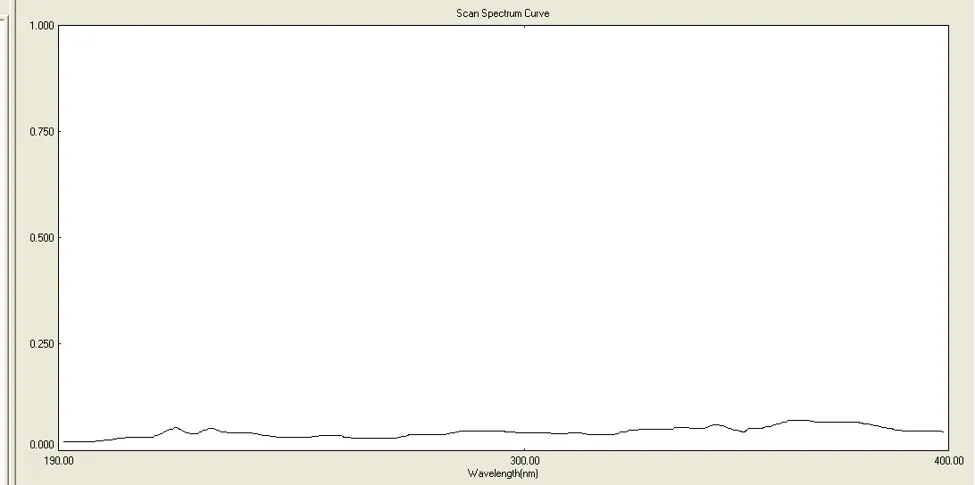
Fig. 1. UV Absorption Spectrum Trail-1
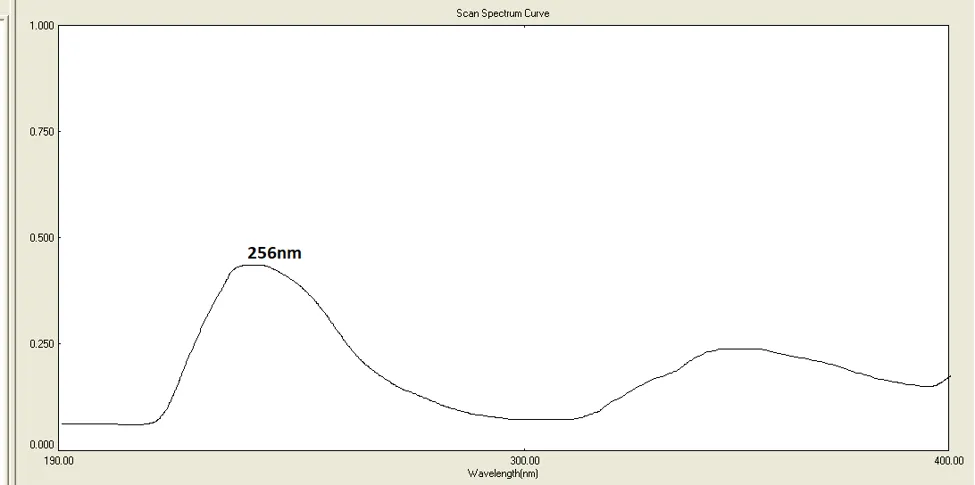
Fig. 2. UV Absorption Spectrum Trail-2
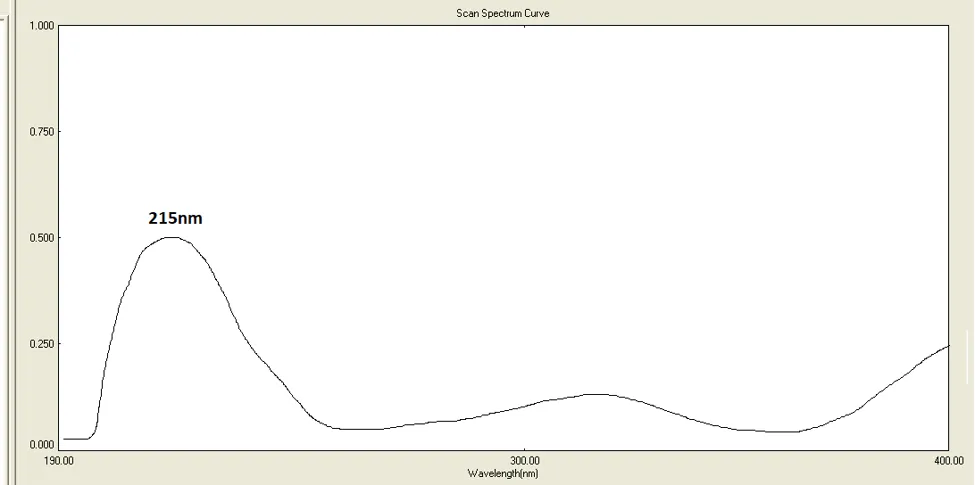
Fig. 3. UV Absorption Spectrum Trail-3
was selected as the optimized solvent for the proposed UV spectrometric method.
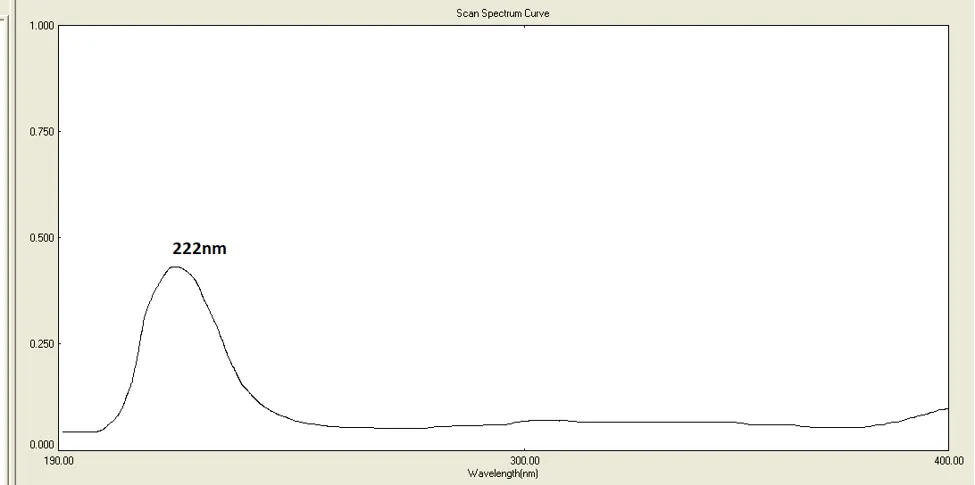
Fig. 4. UV Absorption Spectrum Trail-4
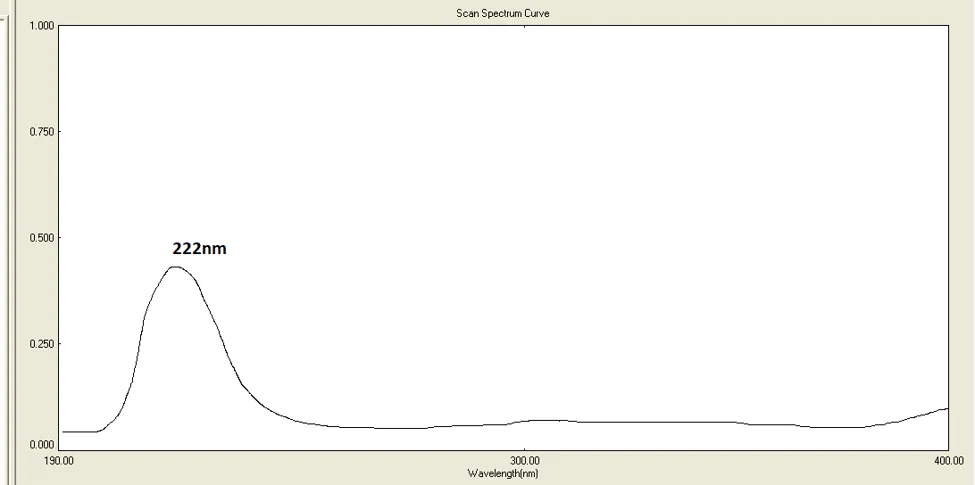
Fig. 5. UV Absorption Spectrum Trail-8
Table 2: Optimized Analytical Conditions
|
Parameter |
Optimized Condition |
|
Analytical Technique |
UV-Visible Spectrophotometry |
|
Solvent |
Methanol |
|
Detection Wavelength (λmax) |
222 nm |
|
Working Concentration |
10 µg/mL |
|
Cell Type |
Quartz Cuvette (1 cm Path Length) |
|
Extraction Technique |
Sonication |
|
Sonication Time |
10 minutes |
|
Blank Solution |
Methanol |
|
Sample Surface |
SS 316L Stainless Steel Plate |
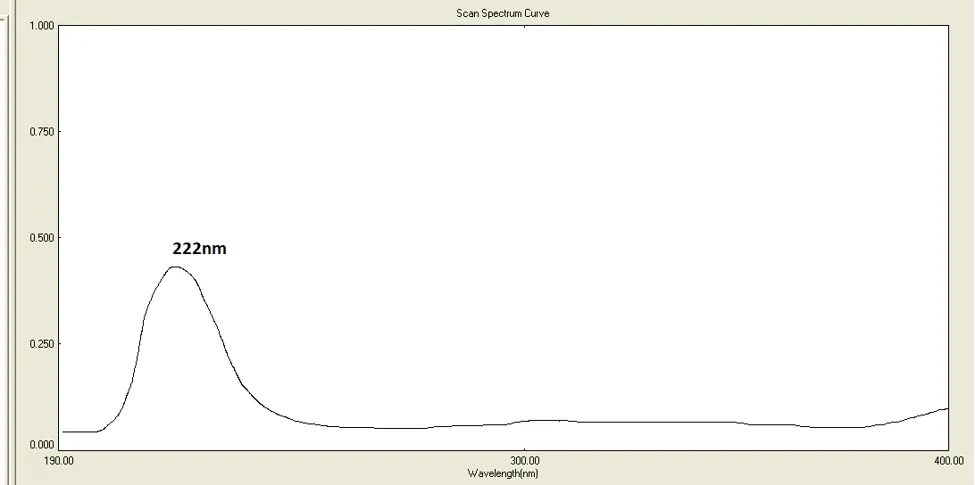
Fig. 6. Optimized UV Absorption Spectrum
Determination of Maximum Absorption Wavelength (λmax)
Table 4: Wavelength Scan Data of Ibuprofen
|
Sr. No. |
Wavelength (nm) |
Absorbance |
|
1 |
210 |
0.514 |
|
2 |
214 |
0.608 |
|
3 |
218 |
0.674 |
|
4 |
220 |
0.706 |
|
5 |
222 |
0.728 |
|
6 |
224 |
0.714 |
|
7 |
226 |
0.689 |
|
8 |
230 |
0.621 |
|
9 |
235 |
0.502 |
|
10 |
240 |
0.386 |
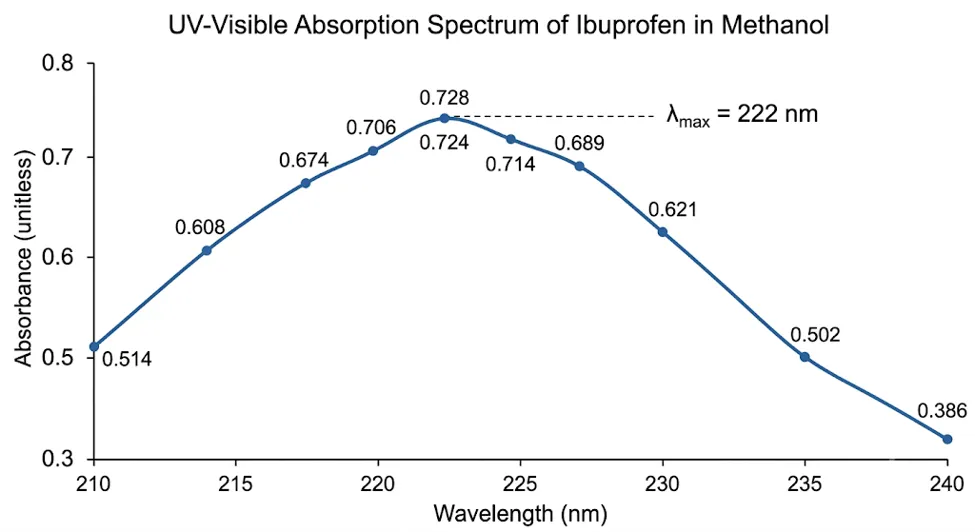
Figure 7: UV Absorption Spectrum of Ibuprofen Showing λmax at 222 nm
Method Validation:
Specificity:
Table 4: Specificity Results
|
Sr. No. |
Sample |
Analytical Wavelength (222 nm) |
Absorbance |
Observation |
|
1 |
Methanol Blank |
222 nm |
0 |
No interference observed |
|
2 |
Blank Swab Extract |
222 nm |
0.002 |
No significant interference |
|
3 |
Ibuprofen Standard (10 µg/mL) |
222 nm |
0.728 |
Sharp and well-defined absorbance peak |
|
4 |
Spiked Sample Extract |
222 nm |
0.724 |
Absorbance comparable with standard |
|
5 |
Clean SS 316L Surface Extract |
222 nm |
0.001 |
No detectable ibuprofen residue |
Linearity:
Table 5: Preparation of Calibration Standards
|
Sr. No. |
Aliquot Taken from Stock Solution (mL) |
Final Volume (mL) |
Concentration (µg/mL) |
|
1 |
0.2 |
10 |
2 |
|
2 |
0.4 |
10 |
4 |
|
3 |
0.6 |
10 |
6 |
|
4 |
0.8 |
10 |
8 |
|
5 |
1 |
10 |
10 |
|
6 |
1.2 |
10 |
12 |
Table 6: Linearity Data of Ibuprofen
|
Sr. No. |
Concentration (µg/mL) |
Mean Absorbance* |
|
1 |
2 |
0.147 |
|
2 |
4 |
0.292 |
|
3 |
6 |
0.438 |
|
4 |
8 |
0.583 |
|
5 |
10 |
0.728 |
|
6 |
12 |
0.873 |
|
Regression Equation: |
y = 0.0726x + 0.0018 |
|
|
Correlation Coefficient (R²) |
0.9998 |
|
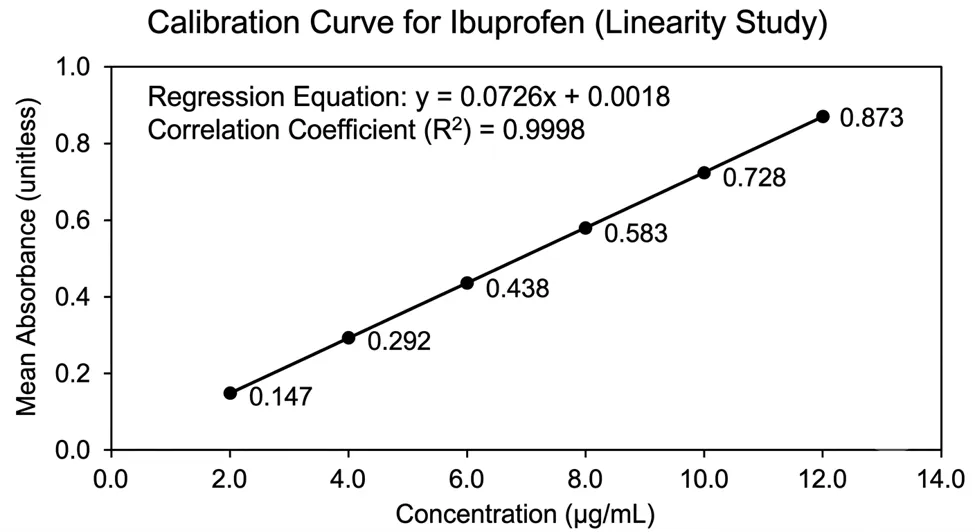
Figure 8: Calibration Curve of Ibuprofen
Accuracy (Recovery Study):
Table 7: Accuracy Study at 80% Recovery Level
|
Sr. No. |
Amount Added (µg) |
Amount Recovered (µg) |
% Recovery |
|
1 |
8 |
7.93 |
99.13 |
|
2 |
8 |
7.98 |
99.75 |
|
3 |
8 |
8.01 |
100.13 |
|
Mean ± SD |
99.67±0.51 |
||
|
%RSD |
0.51 |
Table 8: Accuracy Study at 100% Recovery Level
|
Sr. No. |
Amount Added (µg) |
Amount Recovered (µg) |
% Recovery |
|
1 |
10 |
9.96 |
99.6 |
|
2 |
10 |
10.02 |
100.2 |
|
3 |
10 |
10.05 |
100.5 |
|
Mean ± SD |
100.10±0.46 |
||
|
%RSD |
0.46 |
Table 9: Accuracy Study at 120% Recovery Level
|
Sr. No. |
Amount Added (µg) |
Amount Recovered (µg) |
% Recovery |
|
1 |
12 |
11.92 |
99.33 |
|
2 |
12 |
12.03 |
100.25 |
|
3 |
12 |
12.08 |
100.67 |
|
Mean ± SD |
100.08±0.68 |
||
|
%RSD |
0.68 |
Table 10: Summary of Accuracy (Recovery) Results
|
Recovery Level |
Mean % Recovery ± SD |
%RSD |
|
80% |
99.67 ± 0.51 |
0.51 |
|
100% |
100.10 ± 0.46 |
0.46 |
|
120% |
100.08 ± 0.68 |
0.68 |
|
Overall Mean |
99.95 ± 0.55 |
0.55 |
Precision:
Repeatability (Intra-day Precision)
Table 11: Repeatability (Intra-day Precision) Results
|
Sr. No. |
Concentration (µg/mL) |
Absorbance |
|
1 |
10 |
0.726 |
|
2 |
10 |
0.731 |
|
3 |
10 |
0.729 |
|
4 |
10 |
0.727 |
|
5 |
10 |
0.73 |
|
6 |
10 |
0.728 |
|
Mean ± SD |
0.7285 ± 0.0019 |
|
|
%RSD |
0.26 |
Intermediate Precision (Inter-day Precision)
Table 12: Intermediate Precision (Inter-day Precision) Results
|
Sr. No. |
Concentration (µg/mL) |
Absorbance |
|
1 |
10 |
0.729 |
|
2 |
10 |
0.732 |
|
3 |
10 |
0.728 |
|
4 |
10 |
0.73 |
|
5 |
10 |
0.727 |
|
6 |
10 |
0.731 |
|
Mean ± SD |
0.7295 ± 0.0019 |
|
|
%RSD |
0.26 |
Limit of Detection (LOD)
Table 13: Limit of Detection (LOD) of the Developed UV Spectrometric Method
|
Parameter |
Value |
|
Calibration Curve Slope (S) |
0.0726 |
|
Standard Deviation of Response (σ) |
0.0034 |
|
LOD Formula |
3.3 × σ / S |
|
Calculated LOD (µg/mL) |
0.155 |
Limit of Quantification (LOQ)
Table 14: Limit of Quantification (LOQ) of the Developed UV Spectrometric Method
|
Parameter |
Value |
|
Calibration Curve Slope (S) |
0.0726 |
|
Standard Deviation of Response (σ) |
0.0034 |
|
LOQ Formula |
10 × σ / S |
|
Calculated LOQ (µg/mL) |
0.468 |
Robustness
Table 15: Robustness Study by Variation in Analytical Wavelength
|
Wavelength (nm) |
Mean Absorbance* |
% Assay |
% RSD |
|
220 |
0.719 |
98.85 |
0.43 |
|
222 |
0.728 |
100 |
0.26 |
|
224 |
0.721 |
99.04 |
0.48 |
*Mean of three determinations.
Table 16: Robustness Study by Variation in Sonication Time
|
Sonication Time (min) |
Mean Absorbance* |
% Assay |
% RSD |
|
8 |
0.724 |
99.45 |
0.39 |
|
10 |
0.728 |
100 |
0.26 |
|
12 |
0.729 |
100.14 |
0.34 |
Table 17: Robustness Study by Different Analysts
|
Analyst |
Mean Absorbance* |
% Assay |
% RSD |
|
Analyst I |
0.728 |
100 |
0.26 |
|
Analyst II |
0.726 |
99.73 |
0.37 |
|
Analyst III |
0.729 |
100.14 |
0.31 |
Solution Stability
Table 18: Solution Stability of Ibuprofen Standard Solution
|
Time Interval (Hours) |
Mean Absorbance* |
% Assay |
Observation |
|
0 |
0.728 |
100 |
Freshly prepared solution |
|
6 |
0.727 |
99.86 |
Stable |
|
12 |
0.726 |
99.73 |
Stable |
|
24 |
0.724 |
99.45 |
Stable |
|
|
Mean % Assay: |
99.76% |
|
|
|
%RSD |
0.24 |
|
Swab Recovery Study
Table 19: Swab Recovery Study of Ibuprofen from SS 316L Surface
|
Sr. No. |
Amount Applied (µg) |
Amount Recovered (µg) |
% Recovery |
|
1 |
10 |
9.89 |
98.9 |
|
2 |
10 |
9.95 |
99.5 |
|
3 |
10 |
10.01 |
100.1 |
|
4 |
10 |
9.96 |
99.6 |
|
5 |
10 |
9.92 |
99.2 |
|
6 |
10 |
9.98 |
99.8 |
|
Mean ± SD |
99.52 ± 0.43 |
||
|
%RSD |
0.43 |
System Suitability
Table 20: System Suitability Results
|
Sr. No. |
Concentration (µg/mL) |
Absorbance |
|
1 |
10 |
0.727 |
|
2 |
10 |
0.729 |
|
3 |
10 |
0.728 |
|
4 |
10 |
0.73 |
|
5 |
10 |
0.726 |
|
6 |
10 |
0.728 |
|
Mean ± SD |
0.7280 ± 0.0014 |
|
|
%RSD |
0.2 |
Acceptance Criteria
|
Parameter |
Acceptance Criteria |
Observed Result |
Status |
|
Mean Absorbance |
Consistent response |
0.728 |
Complies |
|
%RSD (n = 6) |
NMT 2.0% |
0.20% |
Pass |
|
Instrument Response |
Stable |
Stable |
Pass |
and validated for the determination of ibuprofen residues on pharmaceutical equipment surfaces. The method demonstrated excellent linearity over the range of 2–12 µg/mL, high accuracy and precision, and adequate sensitivity for trace-residue analysis. The absence of interference from the solvent and sampling matrix confirmed the specificity of the procedure, while its robustness and 24-hour solution stability support reliable routine application. Importantly, the mean swab recovery of 99.52% from SS 316L stainless-steel surfaces demonstrated efficient and reproducible recovery of ibuprofen residues. Overall, the validated method provides a simple, economical, and practical analytical approach for routine cleaning-validation studies and can assist pharmaceutical manufacturing laboratories in demonstrating effective removal of ibuprofen residues and controlling the risk of cross-contamination.
REFERENCES

A. Anil Kumar, Sambram Vishweshwar Reddy, Development and Validation of a Rapid UV Spectrometric Method for Cleaning Validation of Ibuprofen Residues on Pharmaceutical Equipment Surfaces, Int. J. of Pharm. Sci., 2026, Vol 4, Issue 8, 2605-2618. https://doi.org/10.5281/zenodo.21972400
 10.5281/zenodo.21972400