

We use cookies to ensure our website works properly and to personalise your experience. Cookies policy
D.S.T.S. Mandal’s College of Pharmacy, Solapur, 413004 Maharashtra, India
A straightforward, fast, exact, and reliable reverse-phase high-performance liquid chromatography (RP-HPLC) method was created and tested for accurately measuring Vigabatrin in medicines. The separation process was done using a C18 column with dimensions 250 × 4.6 mm and particle size of 5 ?m, with a mobile phase made up of phosphate buffer (pH 3.0) and acetonitrile under optimal settings at a flow rate of 1.0 mL/min. Detection was performed using a UV detector at a wavelength of 210 nm, where Vigabatrin showed a good and sensitive response. The method was assessed according to ICH standards for linearity, accuracy, precision, specificity, robustness, limit of detection (LOD), and limit of quantification (LOQ).The method demonstrated strong linearity across the concentration range of 5–25 ?g/mL with a correlation coefficient (R²) of 1.000.Accuracy was confirmed with a mean recovery of 100.57%, showing the method's dependability. Precision was shown through low intra-day and inter-day %RSD values of 0.047 and 0.049, respectively. The detection and quantification limits of the developed method were observed at 0.50 ?g/mL. and 1.50 ?g/mL, respectively, proving the method's sensitivity. The method was confirmed to be specific and robust, with no major changes observed under intentional variations in chromatographic conditions. The validated RP-HPLC method is appropriate for regular quantitative analysis of Vigabatrin in raw materials and drug products and can be effectively used in quality control labs.
Vigabatrin is a synthetic analogue of γ-aminobutyric acid (GABA) used as an antiepileptic drug for the treatment of refractory complex partial seizures and infantile spasms. It acts by irreversibly inhibiting GABA transaminase, resulting in increased GABA levels in the central nervous system and enhanced inhibitory neurotransmission [1-4].
Epilepsy remains a major neurological disorder worldwide, requiring effective therapeutic management and stringent quality control of pharmaceutical products. Accurate analytical methods are essential for the determination of active pharmaceutical ingredients in bulk drugs and dosage forms to ensure their safety, efficacy, and quality [5-7].
Several analytical techniques have been reported for the estimation of Vigabatrin. However, some methods involve complex procedures, longer analysis times, or limited applicability for routine quality control. Reverse-phase high-performance liquid chromatography (RP-HPLC) is widely used in pharmaceutical analysis because of its accuracy, precision, sensitivity, and reproducibility [8-12].
Therefore, the present study aimed to develop and validate a simple, rapid, accurate, and robust RP-HPLC method for the estimation of Vigabatrin in pharmaceutical dosage forms according to ICH guidelines [13-15].
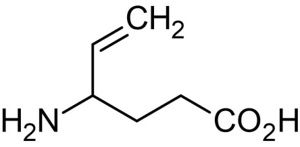
Figure 1: Structure of Vigabatrin
MATERIALS AND METHODS
Equipments
Chromatographic analysis was carried out using an Agilent 1200 Series HPLC system (Agilent Technologies, USA) comprising a binary pump (G1312A), online degasser (G1379B), autosampler (G1329A), and variable-wavelength UV detector (G1314B). Data acquisition and processing were performed using ChemStation software Rev. B.03.01.
Separation was achieved on a C18 column (250 mm × 4.6 mm i.d., 5 μm particle sizes). An electronic analytical balance (Shimadzu AUX220, Japan), digital pH meter (Eutech Instruments, Singapore), and ultrasonic bath (Spectra Lab, India) were employed during method development and validation.
Materials
A pharmaceutical-grade Vigabatrin reference standard was kindly supplied by Dr. Reddy's Laboratories Ltd., Hyderabad, India, and was used throughout the study. Marketed Vigabatrin tablet formulations were purchased from local pharmacies. Acetonitrile (HPLC grade), potassium dihydrogen phosphate, and orthophosphoric acid were procured from Merck Life Science Pvt. Ltd., Mumbai, India. Purified HPLC-grade water was utilized for preparing all standard solution as well as the mobile phase. All reagents and solvents employed in the study were of analytical reagent or HPLC grade.
Selection of wavelength
A UV spectral study of Vigabatrin was carried out in the range of 200–400 nm to identify a suitable wavelength for analysis. Based on the spectral characteristics and detector response of the drug, 210 nm was chosen as the optimum wavelength and was subsequently employed for RP-HPLC quantification.
Chromatographic conditions
The RP-HPLC analysis of Vigabatrin was performed using a C18 column (250 mm × 4.6 mm i.d., 5 μm particle size). A mixture of phosphate buffer (pH 3.0) and acetonitrile (95:5, v/v) was employed as the mobile phase. To ensure proper chromatographic performance, the mobile phase was filtered through a 0.45 μm membrane and sonicated to eliminate dissolved gases. Separation was achieved under a 1.0 mL/min flow rate and monitored by UV detection at 210 nm. A fixed sample volume of 20 μL was injected in every analysis. Under these optimized conditions, Vigabatrin eluted at a retention time of approximately 3.85 min.
Solutions
Preparation of buffer solution
A phosphate buffer of pH 3.0 was prepared by dissolving an accurately weighed quantity of potassium dihydrogen phosphate in HPLC-grade water. The pH of the solution was adjusted to 3.0 using orthophosphoric acid. The resulting buffer was filtered through a 0.45 μm membrane filter and sonicated before use.
Preparation of mobile phase
The mobile phase was prepared by mixing phosphate buffer (pH 3.0) and acetonitrile in the ratio of 95:5 (v/v). The mixture was filtered through a 0.45 μm membrane filter and degassed using an ultrasonic bath to remove dissolved air.
Preparation of standard solution
Accurately weighed Vigabatrin reference standard (10 mg) was transferred into a 100 mL volumetric flask. The drug was dissolved in a suitable quantity of mobile phase, and the volume was adjusted up to the mark with the same solvent to obtain a standard stock solution containing 100 μg/mL of Vigabatrin.
Preparation of Calibration Standards
Working standard solutions were prepared by appropriate dilution of the stock solution with the mobile phase to obtain concentrations ranging from 5 to 25 μg/mL. These solutions were used for the construction of the calibration curve and method validation studies.
Method Validation
The developed RP-HPLC method was validated according to the International Council for Harmonization (ICH) Q2 (R1) guidelines with respect to linearity, accuracy, precision, specificity, robustness, limit of detection (LOD), and limit of quantification (LOQ).
Linearity
Linearity was assessed by preparing standard solutions of Vigabatrin at concentrations ranging from 5–25 μg/mL. Calibration curves were constructed by plotting peak area against concentration, and the correlation coefficient was determined using linear regression analysis.
Accuracy
The accuracy of the method was evaluated by recovery studies using the standard addition technique at 80%, 100%, and 120% concentration levels. The percentage recovery and %RSD were calculated to determine the accuracy of the method
Precision
Precision was determined in terms of repeatability, intra-day precision, and inter-day precision. Replicate injections of standard solutions were analyzed, and the results were expressed as percentage relative standard deviation (%RSD).
Specificity
The specificity of the method was established by analyzing blank, standard, and sample solutions. The absence of interfering peaks at the retention time of Vigabatrin demonstrated the specificity of the method.
Robustness
The robustness of the method was examined by introducing small deliberate variations in chromatographic conditions, such as flow rate, mobile phase composition, and detection wavelength. The effect of these changes on chromatographic performance was evaluated.
Limit of detection (LOD) and Limit of quantification (LOQ)
The sensitivity of the method was determined by calculating the limit of detection (LOD) and limit of quantification (LOQ) based on the standard deviation of the response and the slope of the calibration curve.
Assay of Pharmaceutical Formulation
The validated method was applied for the quantitative estimation of Vigabatrin in pharmaceutical dosage forms. The assay was performed using the developed chromatographic conditions, and the percentage drug content was calculated.
RESULTS AND DISCUSSION
Method development and optimization
Different chromatographic conditions were tested to obtain a sharp, symmetric peak with acceptable retention time. Among the trials, the mobile phase consisting of phosphate buffer (pH 3.0): acetonitrile (95:5 v/v) at a flow rate of 1.0 mL/min provided the best separation. Under optimized conditions, Vigabatrin showed a well-resolved peak at 3.85 min with minimal tailing (1.2). These conditions were selected for further validation because they produced better peak symmetry and reproducibility.
Table 1: Optimization Trial of Chromatographic Condition
|
Trial |
Mobile Phase (Buffer:ACN) |
Flow rate (ml/min) |
Observation |
Decision |
|
1 |
90:10 |
1.0 |
Peak broadening, tailing factor 1.5 |
Not suitable |
|
2 |
95:5 |
1.0 |
Sharp symmetrical peak, tailing factor 1.2 |
Selected |
|
3 |
95:5 |
1.2 |
Slight shift in retention time |
Flow 1.0 preferred |
System suitability studies
System suitability parameters confirmed satisfactory chromatographic performance. The retention time was 3.85 ± 0.02 min, theoretical plates were 6120, and tailing factor was 1.11. The %RSD of peak area was 0.8%, which is below the acceptable limit of 2%, indicating good system precision and reliable column performance.
Table 2: System Suitability
|
Parameter |
value |
Acceptance Criteria |
|
Retention time (RT) |
3.85 ± 0.02 min |
- |
|
Theoretical Plates (N) |
6120 |
>2000 |
|
Tailing factor |
1.11 |
<2 |
|
%RSD of Peak Area |
0.8 |
<2 |
All system suitability parameters are within acceptance within ICH limits, indicating efficient column performance and method reliability.
Linearity study
The method showed excellent linearity over the concentration range of 5–25 µg/mL. Peak area increased proportionally with concentration, and the calibration curve showed a correlation coefficient (R² = 1.000), indicating a strong linear relationship between concentration and detector response. This demonstrates that the method is suitable for quantitative estimation of Vigabatrin.
Table 3: Calibration Curve of Vigabatrin (n=3)
|
Concentration |
Peak area (Mean ± SD) |
|
5 |
115450 ± 850 |
|
10 |
229600 ± 1200 |
|
15 |
343700 ± 900 |
|
20 |
458000 ± 1100 |
|
25 |
573200 ± 1500 |
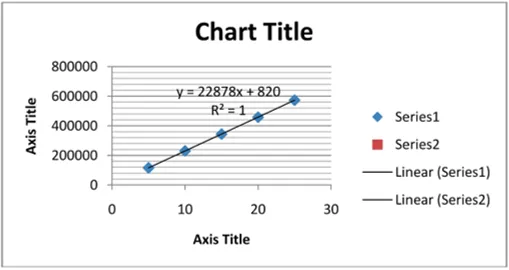
Figure 2: Calibration Curve of Vigabatrin
Accuracy
Accuracy was evaluated using recovery studies at 80%, 100%, and 120% levels. The percentage recovery ranged from approximately 100.20% to 101.00%, with a mean recovery of 100.57%. These results indicate that the developed method is highly accurate and free from interference by excipients.
Table 4: Accuracy
|
Level |
Amount Added (µ/ml) |
Amount Found (µg/ml) |
Amount Found (µg/ml) Recovery |
|
80% |
8 |
8.06 |
100.75 |
|
80% |
8 |
8.03 |
100.38 |
|
80% |
8 |
8.08 |
101.00 |
|
100% |
10 |
10.05 |
100.50 |
|
100% |
10 |
10.08 |
100.80 |
|
100% |
10 |
10.02 |
100.20 |
|
120% |
12 |
12.10 |
100.83 |
|
120% |
12 |
12.05 |
100.42 |
|
120% |
12 |
12.08 |
100.67 |
Precision
The precision of the analytical method was determined by conducting both repeatability (intra-day) and intermediate precision (inter-day) studies. The intra-day %RSD was 0.047, and the inter-day %RSD was 0.049, both well below 2%. These low %RSD values indicate excellent repeatability and reproducibility of the method.
Table 5: Intra Day Precision Data
|
Type |
%RSD |
|
Precision (Intra-day) |
0.047 |
|
Precision (Inter-day) |
0.049 |
Specificity
Specificity studies showed that blank and sample chromatograms had no interfering peaks at the retention time of Vigabatrin. A sharp and symmetrical peak was observed at 3.85 min, confirming the specificity of the method for drug estimation.
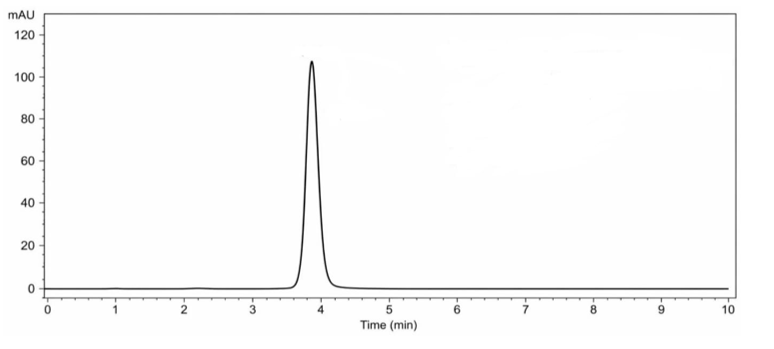
Figure 3: Typical RP-HPLC Chromatogram of Standard vigabatrin
Sample (Vigabatrin) shows Sharp and symmetrical peak observed at 3.85 min. Peak purity confirmed.
Robustness
Small deliberate changes in mobile phase composition, flow rate, and wavelength did not significantly affect retention time or peak area. The %RSD remained below 2% under all altered conditions, demonstrating that the method is robust and reliable for routine analysis.
Table 6: Effect of Mobile Phase
|
Mobile Phase (Buffer: ACN, v/v) |
Retention Time (min) |
Peak Area |
% RSD |
|
93.7 |
3.88 |
228900 |
0.85 |
|
95:5 (Optimized) |
3.85 |
229580 |
0.80 |
|
97.3 |
3.82 |
229150 |
0.88 |
Table 7: Effect of Flow Rate
|
Flow Rate (ml/min) |
Retention Time (min) |
Peak Area |
% RSD |
|
0.9 |
3.92 |
229450 |
0.87 |
|
1.0 (Optimized) |
3.85 |
229580 |
0.80 |
|
1.1 |
3.78 |
229670 |
0.83 |
Table 8: Effect of Wavelength
|
Wavelength (nm) |
Retention Time (min) |
Peak Area |
% RSD |
|
208 |
3.84 |
229500 |
0.86 |
|
210 (Optimized) |
3.85 |
229580 |
0.80 |
|
212 |
3.86 |
229620 |
0.82 |
The developed RP-HPLC method for estimation of Vigabatrin was successfully optimized and validated. The optimized chromatographic conditions produced a sharp and symmetrical peak with a retention time of 3.85 min. System suitability parameters, including theoretical plates, tailing factor, and %RSD, were within acceptable limits, confirming satisfactory system performance. The method showed excellent linearity over the concentration range of 5–25 µg/mL with a correlation coefficient (R²) of 1.000. Accuracy studies demonstrated mean recovery of 100.57%, indicating high accuracy of the method. Precision studies showed very low intra-day and inter-day %RSD values (<2%), confirming good repeatability and reproducibility. Specificity studies revealed no interference at the retention time of Vigabatrin. Robustness testing showed that small deliberate changes in chromatographic conditions did not significantly affect the results. The LOD and LOQ values confirmed good sensitivity of the method. Overall, the developed method complied with guidelines and is suitable for routine quality control analysis of in pharmaceutical formulations.
CONCLUSION
A simple, rapid, precise, accurate, and robust RP-HPLC method was successfully developed and validated for the estimation of Vigabatrin in pharmaceutical formulations. The method demonstrated excellent linearity, accuracy, precision, specificity, and robustness as per guidelines. Low LOD and LOQ values confirmed good sensitivity for quantitative analysis. The developed method is suitable for routine quality control and assay determination of in bulk drug and dosage forms.
ACKNOWLEDGEMENT
The author expresses sincere gratitude to the Principal, faculty members, and staff of D.S.T.S. Mandal’s College of Pharmacy, Solapur, for their valuable guidance, support, and for providing the necessary facilities to carry out this research work. Special thanks are extended to the project guide for continuous encouragement and insightful suggestions throughout the study. Finally, heartfelt thanks are offered to family and friends for their constant support and motivation during the completion of this work.
REFERENCES


Alamad Abhishek Lokanna, Dr. V. S. Tegeli, Development and Validation of RP-HPLC Method for Estimation of Vigabatrin, Int. J. of Pharm. Sci., 2026, Vol 4, Issue 7, 6013-6019. https://doi.org/10.5281/zenodo.21713753
 10.5281/zenodo.21713753