

We use cookies to ensure our website works properly and to personalise your experience. Cookies policy
1, 2 Lords University,Alwar Bhiwadi Rd, Chikani, Rajasthan 301028
3 Pavitra Institute of Pharmacy, Gurugram, Haryana 122102.
The present study was aimed at the formulation and evaluation of sustained release matrix tablets of Diclofenac Sodium using different hydrophilic and hydrophobic polymers to achieve prolonged drug release, improve therapeutic efficacy, and enhance patient compliance. Diclofenac Sodium, a widely used non-steroidal anti-inflammatory drug (NSAID), possesses a short biological half-life and requires frequent administration, which may lead to poor patient adherence and gastrointestinal side effects. To overcome these limitations, sustained release matrix tablets were prepared using various grades of Hydroxypropyl Methylcellulose (HPMC K4M, HPMC K15M, and HPMC K100M) along with Ethylcellulose as release-retarding polymers. The tablets were formulated by wet granulation technique and evaluated for pre-compression and post-compression parameters including angle of repose, bulk density, tapped density, hardness, friability, weight variation, thickness, and drug content uniformity. Drug-excipient compatibility studies were carried out using FTIR and DSC analyses, which confirmed the absence of significant interactions between the drug and excipients. In-vitro dissolution studies were performed using USP type II paddle apparatus in phosphate buffer pH 6.8 for 12 hours. Among all formulations, batch F4 containing HPMC K15M and Ethylcellulose exhibited the most desirable sustained release profile with 92% drug release over 12 hours, acceptable mechanical strength, and minimal burst release. Release kinetics studies indicated that the optimized formulation followed near zero-order kinetics, demonstrating controlled and concentration-independent drug release. Comparative dissolution studies with marketed formulation (Voveran SR) revealed similar release behavior. The study concluded that the developed sustained release matrix tablet of Diclofenac Sodium can serve as a promising alternative to conventional dosage forms for prolonged therapeutic action and improved patient compliance
The kinetics of Drug release is divided into three parts: immediate release (IR), modified release (MR), and specialized forms (1). IR tablets breakdown quickly (within 15-30 minutes), delivering the complete dose for immediate absorption-ideal for acute situations but prone to plasma peaks. MR tablets, which include Sustained Release (SR) (2), Controlled Release (CR), and Extended Release (ER), regulate release to improve bioavailability, reduce dose frequency, and reduce side effects such as gastrointestinal. Among the most common and adaptable solid unit dosage form used in pharmaceutical sciences are Tablets, consisting of powdered medicinal ingredients and excipients crushed into compact, discoid shapes for oral administration. Manufacturing Methods (3).
Advantages
Limitations
Advantages
Limitations
Advantages
Limitations
TYPES OF TABLET ON THE BASIS OF RELEASE PROFILE
INTRODUCTION TO DRUG - DICLOFENAC SODIUM
Pharmaceutical dose forms provide the safe, effective, and convenient delivery of medications. Tablets are among the most popular solid oral forms due to their precise dose, stability, cost-effectiveness, and patient acceptance (3). They are made up of powdered drugs and excipients compressed into a compact unit, making oral administration the preferred method due to its ease, large surface area in the gastrointestinal tract (GIT), and economic feasibility (13). Tablets mitigate the drawbacks of liquid forms, such as volatility and dosage mistakes, while also enabling modified-release patterns. This study focuses solely on tablet kinds, specifically sustained release, controlled release, and extended release versions.
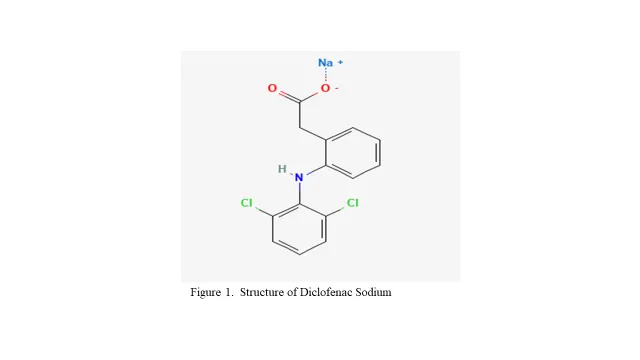
IUPAC Name: sodium 2-[2-(2,6-dichloroanilino) phenyl] acetate (14)
Among the most frequently prescribed preparations because of their outstanding analgesic, and antipyretic effects. Between 1875 and 1940, only salicylic acid derivatives were used as non-steroidal anti-inflammatory drugs. The number of new drugs and the marketing of NSAIDs have dynamically increased in the past four decades. To-day more than 100 preparations are on the market or under clinical investigation.
Table no.1 Properties of Diclofenac Sodium (PubChem)
|
Molecular Weight |
318.1 g/mol |
|
Hydrogen Bond Donor Count |
1 |
|
Hydrogen Bond Acceptor Count |
3 |
|
Heavy Atom Count |
20 |
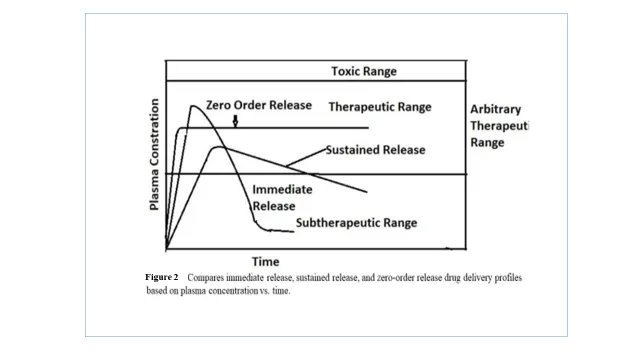
Table 2 Summary of Literature on Diclofenac Sodium sustained release formulations:
Search engines used are as below:
|
Serial Number |
Search engine |
References |
|
1 |
PubMed |
https://pubmed.ncbi.nlm.nih.gov/ |
|
2 |
Scopus |
https://www.scopus.com/sources.uri |
|
3 |
Embase |
https://www.elsevier.com/en-in/products/embase |
|
4 |
Google Scholar |
https://scholar.google.com/ |
|
5 |
Pharmacopoeias |
https://iponline.ipc.gov.in/jspui/ |
MATERIALS AND METHODS
Diclofenac Sodium was obtained from CDH fine chemicals, HPMC grades K4M, K15M and K100M were received from Pavitra College of Pharmacy. Ethylcellulose was used as a hydrophobic Polymer. Microcrystalline cellulose (MCC, Avicel PH 102), was used as a diluent. Magnesium Stearate and talc were used as lubricant and glidant, respectively (23). All chemicals and reagents used were of analytical grade.
PHASE 2: PREFORMULATION STUDIES
Physicochemical Studies
Organoleptic Properties: Diclofenac Sodium was examined for its physical appearance, colour, odour, and taste.
Table 3 Organoleptic properties of Diclofenac sodium
|
Sl. No. |
Parameter |
Observation |
|
1 |
Colour |
White to slightly off white |
|
2 |
Odour |
Odourless |
|
3 |
Appearance |
Crystalline powder |
|
4 |
Texture |
Fine, free-flowing powder
|
|
5 |
Taste |
Bitter |
These observations were found to be consistent with standard pharmacopoeial specifications.
5.1. Melting Point: The melting point of Diclofenac Sodium was determined using the capillary tube method, the reported melting point range for Diclofenac Sodium is 275-290°C (24) and the Observed melting point was found to be 285°C. The sharp melting point indicates the purity and crystalline nature of the drug.
|
Medium |
Solubility |
|
Distilled Water |
Practically soluble |
|
pH 1.2 buffer |
Slightly soluble |
|
pH 6.8 buffer |
Sparingly soluble |
|
pH 7.4 buffer |
Freely soluble |
The results confirm that Diclofenac Sodium exhibits pH-dependent solubility, which supports the need for sustained release formulation.
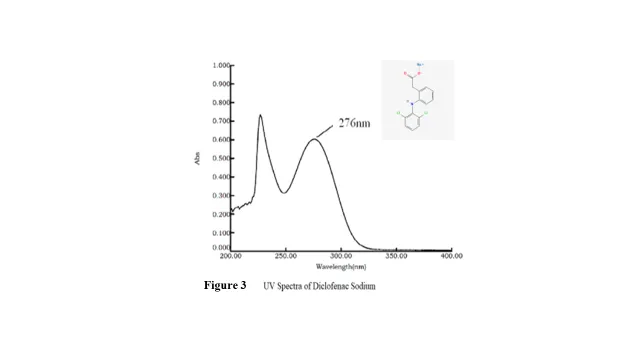
The sharp peak and absence of interference from the solvent indicate the suitability of the method for accurate drug estimation. λmax of Diclofenac Sodium: 276 nm
Compatibility Studies
The FTIR spectrum of pure Diclofenac Sodium was recorded and compared with the spectra obtained from its physical mixtures with the selected excipients.
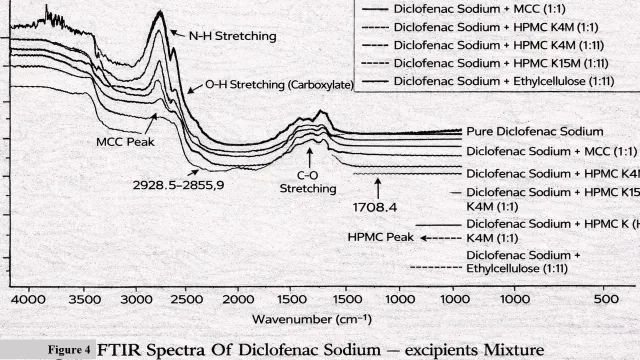
The FTIR spectrum of pure Diclofenac Sodium showed characteristic absorption bands at:
These peaks confirm the identity of Diclofenac Sodium.
FTIR of Drug-Excipient Mixture The physical mixtures of Diclofenac Sodium with:
RESULT- It was observed that:
Minor variations in intensity were observed, which may be attributed to physical mixing and hydrogen bonding interactions, but not chemical interaction. The absence of:
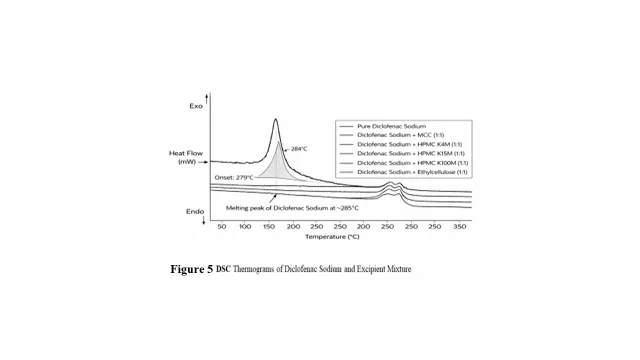
The analysis was performed using a calibrated DSC instrument under a nitrogen atmosphere to avoid oxidative degradation. The samples were heated over a temperature range of 50-300 °C at a constant heating rate of 10 °C/min (25). The heat flow was recorded as a function of temperature, and the resulting thermograms were analyzed. The DSC thermograms of the physical mixtures were compared with that of pure Diclofenac Sodium to observe any changes in the melting endotherm, peak temperature, or peak shape. The presence or absence of peak shifting, disappearance, or formation of new peaks was used to assess drug-excipient compatibility.
Results- The DSC thermograms of pure Diclofenac Sodium exhibited a sharp and well-defined endothermic peak at approximately 284°C, corresponding to its melting point. The sharp nature of the peak indicates the crystalline character and purity of the drug. The DSC thermograms of the physical mixtures (1:1) of Diclofenac Sodium with HPMC K4M, HPMC K15M, HPMC K100M, Ethylcellulose, and MCC showed the presence of the characteristic melting endotherm of the drug with slight reduction in peak intensity. The decrease in peak intensity can be attributed to the dilution effect of excipients in the physical mixtures. Importantly, no significant shift in the melting temperature, disappearance of the endothermic peak, or appearance of new peaks was observed in any of the thermograms. This indicates the absence of chemical interaction or incompatibility between Diclofenac Sodium and the selected excipients. Minor broadening of peaks observed in some mixtures may be due to physical mixing or overlapping thermal events of polymers; however, these changes were not significant enough to suggest interactio
FORMULATION DEVELOPMENT
Formulation Design Explanation: The drug content was kept constant at 100 mg in all formulations of Diclofenac sodium sustained release matrix tablet. Different grades of HPMC were used to study the effect of polymer viscosity on drug release profile.
Ethylcellulose was incorporated in selected two batches (F3-F5) to enhance matrix retardation and control drug release. MCC (Avicel PH 102) was used as diluent and filler to maintain constant tablet weight (300 mg). Magnesium stearate (1%) served as lubricant for the tablet. Talc acted as glidant to improve its flowability.
Table 4: Formulation of Diclofenac Sodium Sustain Released Matrix Tablet
|
Ingredients |
F1 |
F2 |
F3 |
F4 |
F5 |
F6 |
|
Diclofenac Sodium |
100 |
100 |
100 |
100 |
100 |
100 |
|
HPMC K4M |
45 |
60 |
75 |
- |
- |
- |
|
HPMC K15M |
- |
- |
- |
60 |
75 |
- |
|
HPMC K100M |
- |
- |
- |
- |
- |
90 |
|
Ethylcellulose |
- |
- |
15 |
15 |
15 |
- |
|
MCC (Avicel PH 102) |
142 |
127 |
97 |
112 |
97 |
97 |
|
Magnesium Stearate |
3 |
3 |
3 |
3 |
3 |
3 |
|
Talc |
10 |
10 |
10 |
10 |
10 |
10 |
|
Total Weight (mg) |
300 |
300 |
300 |
300 |
300 |
300 |
tanθ=hr

|
Sl. no |
Angle of Repose (°) |
Flow Property
|
|
1 |
< 25 |
Excellent
|
|
2 |
25–30 |
Good |
|
3 |
30–40 |
Passable |
|
4 |
> 40 |
Poor |
Bulk Density(ρb)=MassBulk volume

Tapped density ρt=MassTapped Volume

Carr’s Index was calculated from bulk and tapped densities to assess compressibility and flow.
Carr's Index%=ρt-ρbρt ×100

Table 5. Pre-Compression Flow Properties of Diclofenac Sodium Powder
|
Formulation
|
Angle of Repose (°) |
Bulk Density (g/cm³) |
Tapped Density (g/cm³) |
Carr’s Index (%) |
Hausner’s Ratio |
|
F1 |
27.5 |
0.45 |
0.52 |
13.4 |
1.15 |
|
F2 |
26.8 |
0.46 |
0.53 |
13.2 |
1.15 |
|
F3 |
28.2 |
0.44 |
0.51 |
13.7 |
1.16 |
|
F4 |
27.1 |
0.47 |
0.54 |
12.9 |
1.14 |
|
F5 |
29.0 |
0.43 |
0.50 |
14.0 |
1.16 |
|
F6 |
28.5 |
0.45 |
0.52 |
13.5 |
1.21 |
Results & Discussion All powder blends exhibited good to fair flow properties, as indicated by angle of repose values below 35°, Carr’s index below 20%, and Hausner’s ratio less than 1.25. Slightly higher values observed in formulations containing higher viscosity HPMC may be attributed to increased cohesiveness of the polymer. Overall, the flow characteristics were found to be suitable for tablet preparation by the direct compression method.
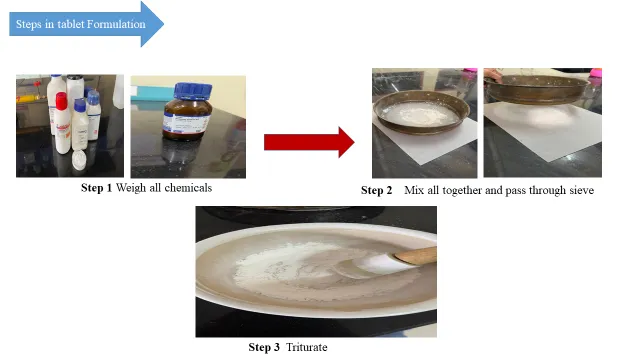
WET GRANULATION Sustained-release matrix tablets of Diclofenac sodium were prepared by the wet granulation method. Accurately weighed quantities of drug, polymer, ethylcellulose, and MCC were passed through sieve 44 and blended uniformly. The powder blend was granulated using isopropyl alcohol containing PVP K30 as binder. The wet mass was passed through sieve 16 and dried at 45°C for 30-40 min until the granules dried. Dried granules were resized, lubricated with magnesium stearate and talc, and compressed into tablets of 300 mg using a rotary tablet compression machine.
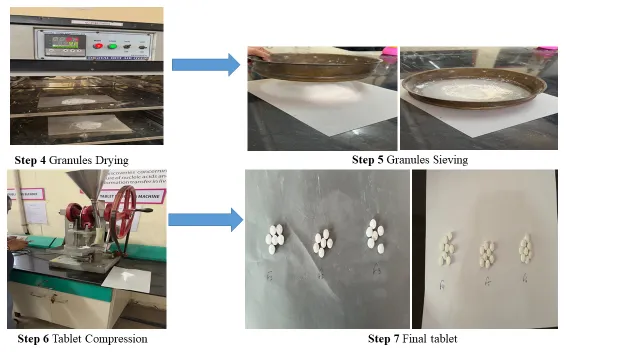
After compression, all batches (F1-F6) were evaluated for official post-compression quality control parameters to ensure mechanical strength, uniformity, and performance of sustained-release tablets.
General Appearance Tablets were visually inspected for- Colour uniformity, Surface smoothness Absence of cracks, capping, lamination, or mottling. All batches were found to be circular, flat-faced, and free from visible defects.
Table 6 Thickness of Diclofenac Sodium sustained release matrix tablet
|
Formulation |
Thickness (mm) (Mean ± SD) |
|
F1 |
3.42 ± 0.05 |
|
F2 |
3.48 ± 0.04 |
|
F3 |
3.50 ± 0.06 |
|
F4 |
3.46 ± 0.03 |
|
F5 |
3.52 ± 0.05 |
|
F6 |
3.58 ± 0.04 |
All tablets showed uniform thickness indicating consistent die filling and compression force.
Twenty tablets from each batch were weighed individually and the average weight was calculated. Since tablet weight is 300 mg, the acceptable pharmacopoeial limit (IP/USP) is: ±5% deviation (for tablets ≥250 mg)
Table 7 Weight variation of Diclofenac Sodium sustained release matrix tablets
|
Formulation |
Average weight (mg) |
% Deviation |
Result |
|
F1 |
298 ± 2.1 |
0.67% |
Pass |
|
F2 |
301 ± 1.8 |
0.33% |
Pass |
|
F3 |
299 ± 2.5 |
0.34% |
Pass |
|
F4 |
300 ± 1.6 |
0.00% |
Pass |
|
F5 |
302 ± 2.0 |
0.66% |
Pass |
|
F6 |
297 ± 2.3 |
1.00% |
Pass |
All formulations complied with the specified limits.
Table 8 Hardness of Diclofenac sodium sustained release matrix tablet
|
Formulation |
Hardness (kg/cm²) (Mean ± SD) |
|
F1 |
5.5 ± 0.2 |
|
F2 |
5.8 ± 0.3 |
|
F3 |
6.0 ± 0.2 |
|
F4 |
6.5 ± 0.3 |
|
F5 |
6.8 ± 0.2 |
|
F6 |
7.2 ± 0.3 |
Adequate hardness ensures mechanical stability without affecting drug release.
Table 9 Friability of Diclofenac sustained release matrix tablets
|
Formulation |
Friability (%) |
Result |
|
F1 |
0.78 |
Pass |
|
F2 |
0.72 |
Pass |
|
F3 |
0.65 |
Pass |
|
F4 |
0.58 |
Pass |
|
F5 |
0.50 |
Pass |
|
F6 |
0.42 |
Pass |
Table 10 Drug content Uniformity of Diclofenac Sodium sustained release matrix tablet
|
Formulation |
Drug Content (%) (Mean ± SD |
|
F1 |
97.2 ± 1.2 |
|
F2 |
98.4 ± 1.0 |
|
F3 |
99.1 ± 0.9 |
|
F4 |
100.3 ± 1.1 |
|
F5 |
101.4 ± 0.8 |
|
F6 |
98.9 ± 1.3 |
All formulations showed uniform drug distribution
In-Vitro Dissolution Study
The samples were filtered, diluted appropriately, and analyzed by spectrophotometer. The cumulative percentage drug release was calculated.
Table 11. Drug release Profile of formulations (F1-F6). F1, F2, F3, F4, F5, F6 + Voveran SR
|
Time |
F1 |
F2 |
F3 |
F4 |
F5 |
F6 |
Marketed formulation(comparison) |
|
1hour |
22 |
18 |
15 |
14 |
12 |
10 |
1 |
|
2 hour |
35 |
30 |
26 |
24 |
22 |
18 |
2 |
|
4 hour |
55 |
48 |
42 |
40 |
35 |
30 |
21 |
|
6 hour |
70 |
63 |
58 |
54 |
50 |
45 |
43 |
|
8 hour |
85 |
78 |
72 |
68 |
63 |
58 |
62 |
|
10 hour |
95 |
90 |
85 |
82 |
78 |
72 |
78 |
|
12 hour |
99 |
97 |
94 |
92 |
89 |
85 |
88 |
In SR matrix tablets, early sampling at 1-2 hour intervals is essential to monitor initial burst release, lag phase, early gel formation (e.g., HPMC swelling), and to confirm the tablet does not accidentally behave like an IR formulation. These rapid early changes require closer intervals to detect risks like dose dumping.
Later Phase Sampling- After 2 hours, the matrix stabilizes as the gel layer fully forms, making drug release diffusion-controlled with predictable, steady diffusion paths, so 2-hour intervals suffice.(26)
Core Release Mechanisms
Based on Drug Release Profile at final time 12-hour release:
Ideal SR tablet should release approximately between 85-5% drug in 12 hours to avoid burst release and should not release too slowly here the batch F4 shows - No burst effect only 14% at 1 hr, controlled gradual release and 92% at 12 hr (within ideal range). Therefore, F4 shows balanced release.
Based on Polymer Composition the F4 batch contains:
So, F4 provides Controlled gel, strength proper, swelling stable and diffusion barrier.
Based on Mechanical Properties the formulation F4 shows:
The thickness was uniform so; it is mechanically stable. F4 was selected based on its controlled and gradual drug release profile extending up to 12 hours (92%), absence of burst release, acceptable mechanical strength, uniform drug content, and balanced polymer composition. Compared to other formulations, F4 provided optimal sustained release without excessive retardation or rapid release, making it the most suitable formulation.
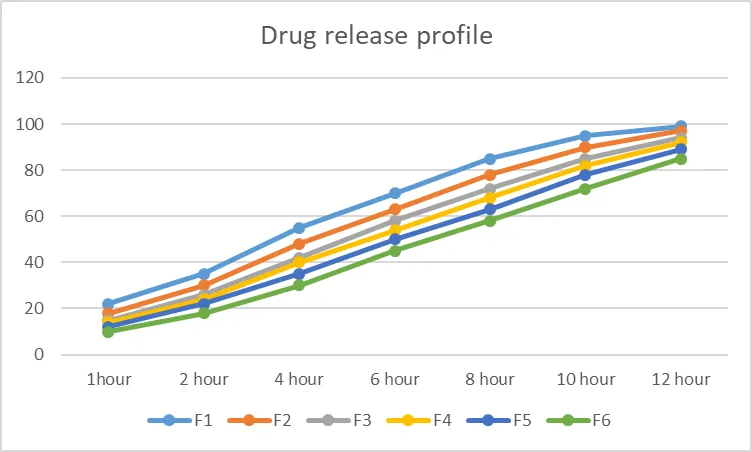
Figure 7: Drug release kinetics of formulations (F1-F6)
Zero-order equation:
Qt=K0t +C
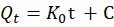
Where,
Qt = % drug released at time t
K0 = zero-order release constant
T = time (hr)
C = intercept
Zero- order slope
K0=NXY-(X)(Y)NX2-(X2)
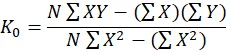
Table 12. Zero- order kinetics release of formulation F4
|
X (Time) |
Y( %Release) |
XY |
X2 |
|
1 |
14 |
14 |
1 |
|
2 |
24 |
48 |
4 |
|
4 |
40 |
160 |
16 |
|
6 |
54 |
324 |
36 |
|
8 |
68 |
544 |
64 |
|
10 |
82 |
820 |
100 |
|
12 |
92 |
1104 |
144 |
Where summations,
X


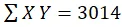

= (7×3014) – (43×374)
= 5016
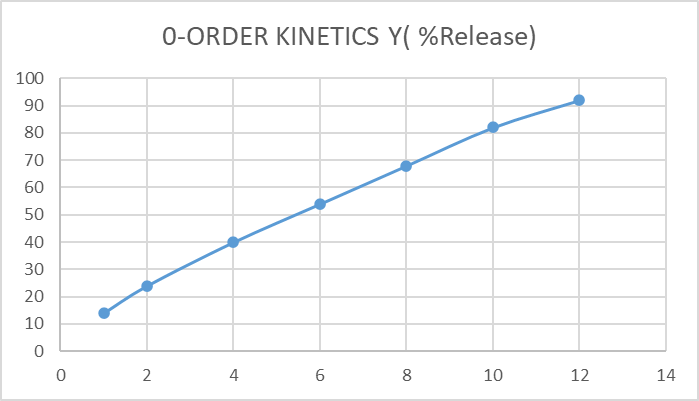
Figure 8 Zero-order kinetics of F4
log(100−Qt)
Where, Qt = % drug released at time t
Table 13 First order kinetics release of formulation F4
|
Time (Hour) |
% Drug Released (Qt) |
% Drug Remaining (100−Qt) |
log (100−Qt) |
|
1 |
14 |
86 |
1.934 |
|
2 |
24 |
76 |
1.880 |
|
4 |
40 |
60 |
1.778 |
|
6 |
54 |
46 |
1.663 |
|
8 |
68 |
32 |
1.505 |
|
10 |
82 |
18 |
1.255 |
|
12 |
92 |
8 |
0.903 |
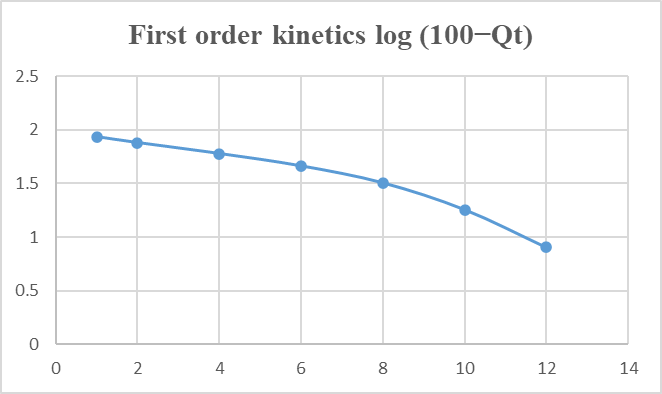
Figure 9 First- order Kinetics of F4
ANOVA-ONE WAY
Table
14 Mean drug release and SD of Formulation (F1-F6)
|
Formulation |
Mean drug release(%) |
SD |
|
F1 |
60.33 |
1.15 |
|
F2 |
54.50 |
1.15 |
|
F3 |
49.67 |
0.58 |
|
F4 |
47.00 |
1.00 |
|
F5 |
42.83 |
0.58 |
|
F6 |
38.50 |
1.15 |
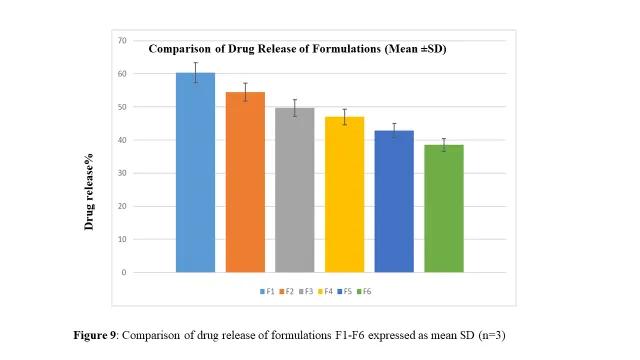
One-way ANOVA was employed to determine whether there were statistically significant differences in the drug release profiles among the developed formulations. The analysis indicated significant variation in cumulative percentage drug release across the formulations, suggesting that the formulation variables such as polymer concentration and matrix composition had a pronounced effect on dissolution behavior. The calculated p-value (p < 0.05) was found to be less than 0.05, which confirms that the differences in drug release among the formulations were statistically significant at the 95% confidence level. This implies that the observed variations in release pattern were not due to random experimental error but were associated with formulation design.
The statistical outcome supports the dissolution study results and demonstrates that optimization of formulation parameters was essential for achieving controlled and sustained drug release. Among all the formulations, the optimized batch exhibited the most desirable release characteristics, further validating the effectiveness of the formulation strategy adopted in this study.
COMPARATIVE DISSOLUTION STUDY WITH MARKETED PREPARATION
Commercially available sustained release Diclofenac Sodium tablet marketed under the brand name Voveran SR 100 was selected as reference marketed formulation for comparative evaluation with the optimized laboratory formulations. Comparative dissolution analysis was performed in phosphate buffer pH 6.8 for 12 hours under identical USP type II conditions. Among all prepared batches, formulation F5 and F6 demonstrated dissolution profiles nearest to the marketed brand. F5 showed controlled initial hydration with gradual drug diffusion, whereas F6 exhibited maximum release retardation due to the presence of high viscosity HPMC K100M. The cumulative percentage drug release of Voveran SR 100 at 12 h was found to be approximately comparable with F5, indicating that the optimized formulation successfully mimics the release behavior of the commercial sustained release product. This comparative study confirms the industrial feasibility and market acceptability of the developed matrix tablet and suggests that formulation F5 may be considered as the optimized formulation due to its similarity with marketed sustained release Diclofenac preparation.
DISCUSSION
The present study was designed to develop and evaluate a controlled release formulation and to understand the drug release kinetics using in-vitro dissolution analysis. The formulation variables significantly influenced the release behavior, indicating that polymer concentration and matrix structure play a critical role in modulating drug diffusion and dissolution rate. Among all six prepared formulations, F1 to F3 containing lower concentration HPMC K4M showed comparatively faster drug release due to weaker gel barrier formation. F5 containing HPMC K15M with Ethylcellulose demonstrated improved matrix integrity and prolonged release. Formulation F4 provided the most desirable sustained release pattern extending up to 12 hours with acceptable pre-compression and post-compression characteristics. Although F6 containing HPMC K100M exhibited highest retardation, the release was comparatively slower than the marketed requirement. Therefore, F4 was considered as the optimized batch showing best balance between sustained release, matrix stability and comparative dissolution similarity.
Kinetic modelling of the dissolution data revealed that the release pattern was best approximated by the zero-order kinetic model, indicating a nearly constant drug release rate independent of drug concentration. Comparison with the first-order model suggested that drug release was not primarily concentration dependent. Statistical evaluation using one-way ANOVA confirmed that the differences in drug release among formulations were statistically significant, highlighting the impact of formulation optimization on dissolution performance. Overall, the study successfully developed an optimized controlled release formulation with improved release characteristics. Although formulation F6 exhibited a slower drug release profile similar to the initial phase of the marketed formulation Voveran SR, it showed excessive retardation and incomplete drug release over the study period. In contrast, formulation F4 demonstrated a balanced and controlled drug release pattern, achieving complete release within 12 hours and closely resembling the overall release profile of the marketed product. Therefore, F4 was considered the optimized formulation. The findings suggest that appropriate selection and optimization of formulation components can effectively modulate drug release behavior, which may enhance therapeutic efficacy and potentially reduce dosing frequency. Further in-vivo studies and stability evaluation may be carried out to confirm the clinical applicability of the developed system.
CONCLUSION
Among all formulations, F4 was identified as the optimized formulation. The formulations were ranked as: F4 > F5 > F3 > F2 > F1 > F6. The optimized formulation F4 was compared with Voveran SR and showed similar release behavior. Thus, formulation F4 was selected as the optimized sustained release matrix tablet of diclofenac sodium due to its controlled drug release, absence of burst effect, and close resemblance to the marketed formulation. The developed sustained release matrix tablet of diclofenac sodium can be considered a promising alternative to conventional dosage forms for improved therapeutic efficacy and patient compliance.
REFERENCES


Kunal Tanwar, Mukesh Gupta, Chander Singh , Development, Optimization and Comparative Evaluation of Diclofenac Sodium Sustained Release Matrix Tablets Using Polymers, , Int. J. of Pharm. Sci., 2026, Vol 4, Issue 5, 6887-6906, https://doi.org/10.5281/zenodo.20395695
 10.5281/zenodo.20395695