

We use cookies to ensure our website works properly and to personalise your experience. Cookies policy
1M Pharm student, DJPS College of Pharmacy, Pathri, Maharashtra, India
2Associate Professor, DJPS College of Pharmacy, Pathri, Maharashtra, India
3Principal, DJPS College of Pharmacy, Pathri, Maharashtra, India
The aim of the present research work, Glimepiride a BCS class II Antilipidemic drug Antidiabetic drug belongs to sulfonylurea class was formulated as immediate release tablet by using various solid dispersion techniques to enhance the solubility, dissolution rate and oral bioavailability. Solid dispersion technique has been used to improve the dissolution properties and bioavailability of poorly water- soluble drugs. Solid dispersions of Glimepiride were prepared with polymer in different ratios of drug and carrier physical mixture, kneading method, solvent evaporation and fusion method. Results of prepared solid dispersions of Glimepiride by physical mixture method, kneading method, solvent evaporation and fusion method were discussed which includes solubility, drug content uniformity, entrapment efficiency and in vitro dissolution studies. Formulation (SF3) containing Glimepiride + Sodium starch glycolate (1:1.5) shows. better results by solvent evaporation method at the end of 90 min with drug release of 99.68%, hence it was selected as the best formulation. From the optimized formulation the immediate release tablets were formulated using different diluents in different concentrations. The pre compression and post compression parameters, all the results. were in the acceptable limit. The rate of dissolution was excellently increased that tablets which were formulated by solid dispersions with disintegrating agents and excipients. Moreover formulations showed their highest release (99.69%) for the tablets formed by solid dispersion 1:1.5(Glimepiride: Sodium starch glycolate) with MCC (86mg)) as diluent. The rate of drug release is (lactose +MCC) > (lactose + starch) in the tablet formulations. In this study, it was found that use of disintegrating agent as carrier for solid dispersions is a suitable technology to improve the dissolution behavior of poorly water soluble drugs. The tablets prepared with the lactose, MCC and starch as diluents, tablets with lactose and MCC combination tend to exhibit rapid dissolution.
Poor aqueous solubility remains one of the major challenges in the development of oral pharmaceutical formulations. Nearly 40–70% of newly discovered drug molecules exhibit poor water solubility, resulting in slow dissolution, reduced gastrointestinal absorption, and low oral bioavailability. Consequently, enhancing the dissolution behavior of poorly soluble drugs has become an important objective in pharmaceutical research.¹˒²
Glimepiride is a third-generation sulfonylurea antidiabetic agent widely prescribed for the treatment of Type 2 Diabetes Mellitus. Although it exhibits excellent hypoglycemic activity, its therapeutic performance is limited by poor aqueous solubility and dissolution rate. As a Biopharmaceutical Classification System (BCS) Class II drug, glimepiride possesses high permeability but low solubility, making dissolution the rate-limiting step for its oral absorption.³˒⁴
Several formulation strategies have been investigated to improve the dissolution characteristics of poorly soluble drugs, including micronization, salt formation, complexation, nanotechnology, lipid-based drug delivery systems, and solid dispersion technology. Among these approaches, solid dispersion is considered one of the most effective, economical, and industrially feasible techniques for enhancing drug solubility and dissolution.⁵˒⁶
Solid dispersion is defined as the dispersion of one or more active pharmaceutical ingredients within an inert hydrophilic carrier in the solid state. This technique improves drug dissolution through particle size reduction, enhanced wettability, increased porosity, and conversion of the crystalline drug into an amorphous or partially amorphous form. Hydrophilic carriers promote rapid water penetration and facilitate faster drug release, thereby improving oral bioavailability.⁷˒⁹
Solid dispersions can be prepared using several techniques such as fusion, solvent evaporation, kneading, hot-melt extrusion, spray drying, co-precipitation, and lyophilization. Among these methods, the solvent evaporation technique is widely preferred because it minimizes thermal degradation and produces homogeneous molecular dispersion of the drug within the carrier matrix.⁸˒¹⁰
Immediate release tablets are designed to disintegrate rapidly after oral administration and release the drug without any intentional delay. Such formulations provide faster onset of therapeutic action, improved patient compliance, and enhanced drug absorption. The combination of optimized solid dispersion with immediate release tablet technology represents a promising approach for improving the dissolution profile of poorly soluble drugs such as glimepiride.¹¹˒¹³
In the present investigation, solid dispersions of glimepiride were prepared using different techniques and carriers to enhance drug solubility and dissolution. The optimized solid dispersion prepared by the solvent evaporation method was incorporated into immediate release tablets and evaluated for pre-compression parameters, post-compression characteristics, and in vitro dissolution performance. The developed formulation was expected to provide improved pharmaceutical performance and enhanced oral bioavailability compared with the pure drug
MATERIALS AND METHODS
Materials
Glimepiride was used as the model drug for the preparation of immediate release tablets. Sodium starch glycolate, lactose monohydrate, microcrystalline cellulose (MCC), starch, polyvinyl pyrrolidone (PVP K-30), talc, and magnesium stearate were used as pharmaceutical excipients. All chemicals and reagents used in the study were of analytical grade.
Instruments
The study was carried out using a Rimek Mini Press tablet compression machine, Pfizer hardness tester, Roche friabilator, USP disintegration test apparatus, Lab India DS 8000 dissolution test apparatus, Shimadzu FTIR spectrophotometer, Shimadzu DSC-60 differential scanning calorimeter, UV–Visible spectrophotometer (Lab India UV-3200), electronic analytical balance, and Vernier calipers for tablet evaluation.
Preformulation Studies
Preformulation studies were performed to characterize glimepiride before formulation development. The drug was evaluated for λmax determination, calibration curve, melting point, saturation solubility, Fourier Transform Infrared (FTIR) spectroscopy, and Differential Scanning Calorimetry (DSC). λmax was determined by UV spectroscopy after preparing suitable dilutions of glimepiride in phosphate buffer (pH 7.8), while the calibration curve was constructed over the concentration range of 5–30 µg/mL. Drug–excipient compatibility was investigated using FTIR and DSC analysis.
Preparation of Solid Dispersions
Solid dispersions of glimepiride were prepared using four different techniques, namely physical mixing, kneading, solvent evaporation, and fusion method. Different drug-to-polymer ratios (1:0.5, 1:1, and 1:1.5) were prepared for each technique. In the solvent evaporation method, glimepiride and sodium starch glycolate were dissolved in methanol, followed by evaporation of the solvent under reduced pressure. The dried mass was pulverized, passed through sieve no. 100, and stored in a desiccator until further use.
Evaluation of Solid Dispersions
Prepared solid dispersions were evaluated for drug content, entrapment efficiency, and in vitro dissolution. Drug content was determined spectrophotometrically at 228 nm using phosphate buffer (pH 7.8). Entrapment efficiency was calculated as the percentage ratio of drug content to the theoretical drug content. Dissolution studies were carried out using USP Apparatus II (Paddle) containing 900 mL phosphate buffer (pH 7.8) maintained at 37 ± 0.5°C and stirred at 50 rpm. Samples were withdrawn at predetermined intervals and analyzed at 228 nm.
Formulation of Immediate Release Tablets
The optimized solid dispersion was selected for the preparation of immediate release tablets by direct compression. All ingredients were passed through a 60-mesh sieve and blended uniformly. Talc and magnesium stearate were incorporated as lubricant and glidant, respectively. Tablets containing an equivalent of 4 mg glimepiride were compressed using a Rimek Mini Press equipped with a 9 mm punch. The average tablet weight was maintained at 200 mg, while tablet hardness was adjusted between 3–4 kg/cm².
Evaluation of Immediate Release Tablets
Prepared tablets were evaluated for pre-compression parameters including bulk density, tapped density, angle of repose, Carr's compressibility index, and Hausner ratio. Post-compression evaluation included hardness, friability, weight variation, thickness, drug content uniformity, disintegration time, and in vitro dissolution study according to pharmacopeial procedures. Dissolution testing was performed using USP Apparatus II in 900 mL phosphate buffer (pH 7.8) at 37 ± 0.5°C and 50 rpm. Drug release was quantified spectrophotometrically at 228 nm.
RESULTS AND DISCUSSION
Determination of λ Max and Calibration Curve - The standard stock solution was prepared as per the method described in experimental section and scanned by UV-Visible spectrophotometer. The UV absorption spectrum of Glimepiride showed peak at 228 nm.
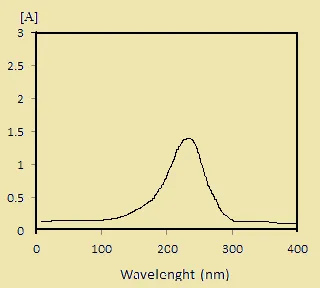
Fig 1: UV Spectrum of Glimepiride.
Calibration curve data of Glimepiride
Table 1: Standard calibration curve data of Glimepiride at lmax 228 nm
|
Concentration(µg/ml) |
Absorbance |
|
0 |
0 |
|
2 |
0.135 |
|
4 |
0.252 |
|
6 |
0.359 |
|
8 |
0.476 |
|
10 |
0.592 |
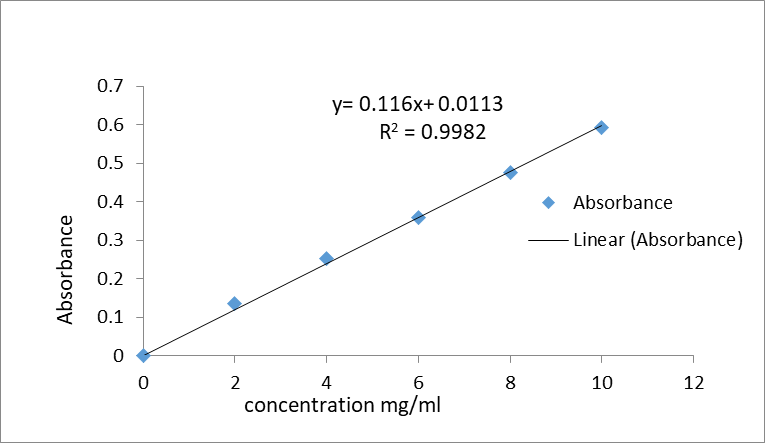
Fig 2: Calibration curve of Glimepiride
Preformulation Studies
The following preformulation studies were performed for drug and polymers;
Determination of melting point
The melting point of Glimepiride was found to be 207oC which was determined by capillary method.
Solubility
Solubility of Glimepiride was carried out at 25oC using 0.1 N HCl, 6.8 phosphate buffer, and purified water.
Table 2: Solubility data of Glimepiride
|
Sr. No |
Medium |
Solubility(mg/ml) |
|
1 |
water |
4.12 |
|
2 |
0.1 N HCl |
0.98 |
|
3 |
7.8 PH buffer |
13.2 |
Discussion: From the above conducted solubility studies in various buffers we can say that 0.1 N HCl solutions has more solubility when compared to other buffer solutions.
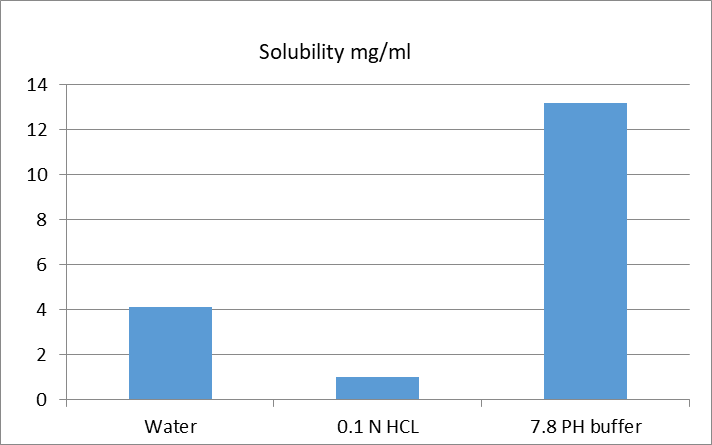
Fig 3: Solubility studies of Glimepiride
Drug–excipient compatibility studies
Drug and excipient compatibility was confirmed by comparing spectra of FT-IR analysis of pure drug with that of various excipients used in the formulation.
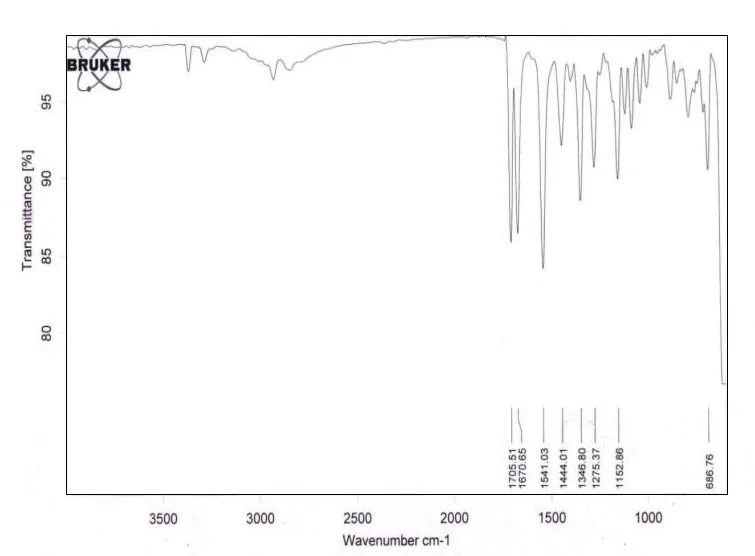
Fig 4: IR spectrum of pure Glimepiride
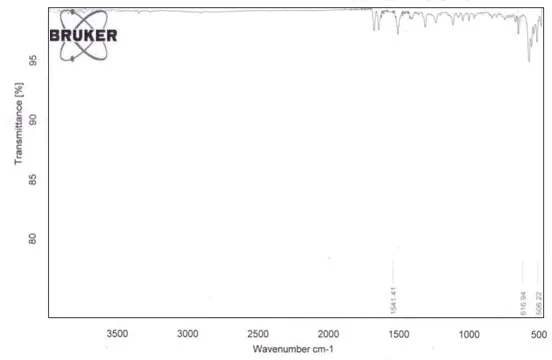
Fig 5: IR spectrum of physical mixture of drug and excipient blend
Discussion: Form the drug excipient compatibility studies we observe that there are no interactions between the pure drug and optimized formulation which indicates there are no physical changes.
Differential scanning calorimetry (DSC) Study:
DSC thermo gram of the optimized solid dispersion (10mg sample) was recorded the using automatic thermal analyzer.
Discussion: DSC shows that no drug-excipient interaction, the melting point of glimepiride is 207o C as of the drug was clearly evident in the physical mixture. The figure indicates that the melting of drug has taken place at 207oC. It is matching with the literature value 206-208oC. This indicates that there is no interaction between drug and excipients. These results are further supported by the results of FT-IR studies.
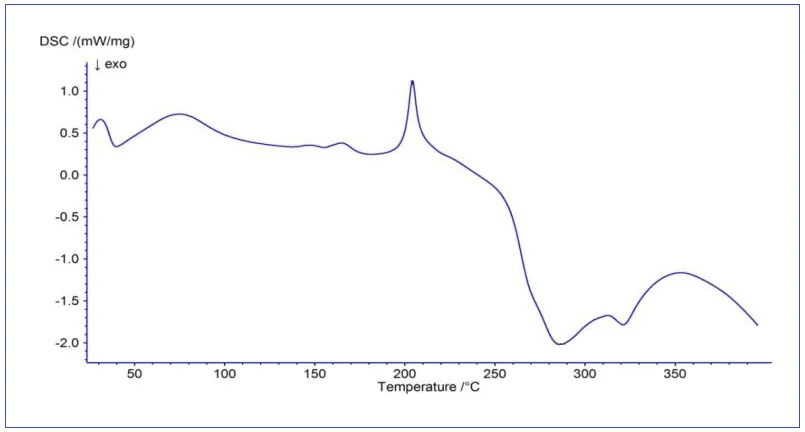
Fig 6: DSC thermo gram of Drug: Excipient Blend
Evaluation of Solid Dispersions
Prepared polymer drug conjugates were evaluatedxby
Estimation of Drug Content
Table 3: Drug content uniformity for solid dispersions by physical mixture
|
Form. Code |
%Drug Content |
|
PF1 |
94.2 |
|
PF2 |
92 .4 |
|
PF3 |
95.7 |
Physical mixture method
Discussion: % drug content values of all the formulation (PF1-PF3) was in the range of 92.2-95.7 %, formulation PF3 shows higher drug content 92.7 %.
Kneading method
Table 4: Drug content uniformity for solid dispersions by kneading method
|
Form. Code |
%Drug Content |
|
KF1 |
97.3 |
|
KF2 |
98.0 |
|
KF3 |
99.1 |
Discussion: % drug content values of all the formulation (KF1-KF3) were in the range of 97.3 – 99.1%, formulation KF3 shows higher drug content 99.10%.
Solvent evaporation method
Table 5: Drug content uniformity for solid dispersions by solvent evaporation method
|
Form. Code |
%Drug Content |
|
SF1 |
98.4 |
|
SF2 |
98.84 |
|
SF3 |
99.34 |
Discussion: % drug content values of all the formulation (SF1-SF3) were in the range of 98.4 - 99.3 %, formulation SF3 shows higher drug content 99.3 %.
Fusion method
Table 6: Drug content uniformity for solid dispersions by Fusion method
|
Form. Code |
%Drug Content |
|
FF1 |
97.3 |
|
FF2 |
97.0 |
|
FF3 |
98.1 |
Discussion: % drug content values of all the formulation (FF1-FF3) were in the range of 97.3 – 98.1%, FF3 shows higher drug content 98.1%.
By comparing results of all the formulations (PF1-PF3) (KF1-KF3) (SF1-SF3) & (FF1-FF3), formulation SF3 containing Glimepiride: Sodium starch glycolate (1:1.5) shows higher drug content 99.34 %.
Entrapment Efficiency
Physical mixture method
Table 7: Entrapment efficiency of solid dispersions by physical mixture method
|
Form. Code |
% Entrapment Efficiency |
|
PF1 |
87.2 |
|
PF2 |
93.1 |
|
PF3 |
95.2 |
Discussion: The entrapment efficacy of the formulated solid dispersions was found to be in the range of 87.2 - 95.2 %. Formulation PF2 shows higher entrapment efficiency 95.2 %.
Kneading method
Table 8: Entrapment efficiency of solid dispersions by kneading method
|
Form. Code |
% Entrapment Efficiency |
|
KF1 |
89.5 |
|
KF2 |
92.2 |
|
KF3 |
96.3 |
Discussion: The entrapment efficacy of the formulated solid dispersions was found to be in the range of 89.5- 96.3%. Formulation KF3 showshigher entrapment efficiency 96.3%.
Solvent evaporation method
Table 9: Entrapment efficiency of solid dispersions by solvent evaporation
|
Form. Code |
Entrapment Efficiency |
|
SF1 |
92.5 |
|
SF2 |
95.3 |
|
SF3 |
98.9 |
Discussion: The entrapment efficacy of the formulated solid dispersions was found to be in the range of 92.5- 98.9%. Formulation SF3 shows higher entrapment efficiency 98.9%.
Fusion method
Table 10: Entrapment efficiency of solid dispersions by Fusion method
|
Form. Code |
Entrapment Efficiency |
|
FF1 |
87.3 |
|
FF2 |
92.6 |
|
FF3 |
96.8 |
Discussion: The entrapment efficacy of the formulated solid dispersions was found to be in the range of 87.3- 96.8%. Formulation FF shows higher entrapment efficiency 96.8%.By comparing results of all the formulations (PF1-PF3) (KF1-KF3) (SF1-SF3) & (FF1-FF3), formulation SF3 containing Glimepiride: Sodium starch glycolate (1:1.5) shows higher entrapment efficiency 98.9%.
In-Vitro dissolution studies (In-Vitro Drug Release Studies Of Solid Dispersions)
Physical mixture method (PF1-PF3)
Table 11: In-Vitro drug release studies for formulations (PF1-PF3)
|
Time(min) |
1:0.5 (PF1) |
1:1(PF2) |
1:1.5 (PF3) |
|
0 |
0 |
0 |
0 |
|
5 |
25.47 |
28.06 |
29.35 |
|
15 |
39.84 |
42.44 |
43.74 |
|
30 |
50.26 |
51.57 |
54.16 |
|
45 |
61.96 |
65.85 |
67.15 |
|
60 |
72.37 |
74.98 |
77.57 |
|
75 |
81.48 |
85.37 |
86.68 |
|
90 |
91.87 |
94.48 |
95.78 |
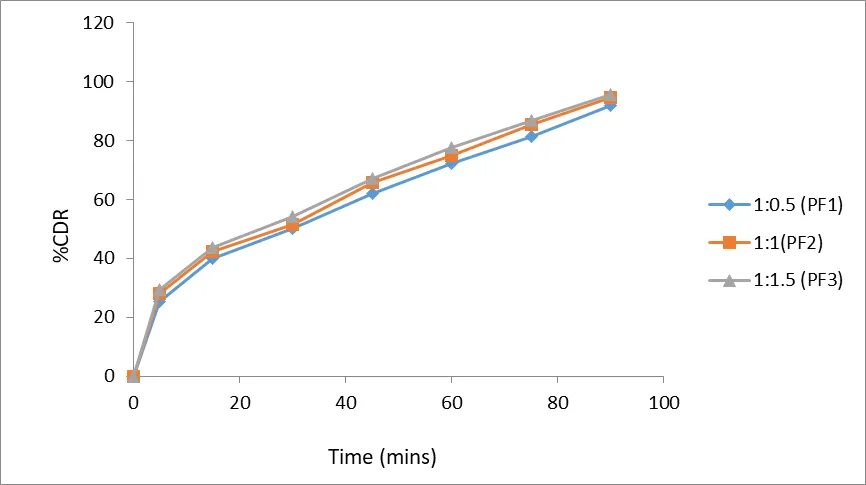
Fig 7: In-Vitro drug release profile for Glimepiride: Sodium starch glycolate (PF1-PF3)
Discussion: In-Vitro drug release of Glimepiride solid dispersions with Sodium starch glycolate in various ratios were observed which shows at the end of 90 mins, the formulation PF1 releases 91.87, formulation PF2 releases 94.48, PF3 releases 95.78.
Kneading method
Table 12: In-Vitro drug release studies for formulations (KF1-KF3)
|
Time(min) |
1:0.5 (KF1) |
1:1(KF2) |
1:1.5 (KF3) |
|
0 |
0 |
0 |
0 |
|
5 |
26.77 |
29.35 |
30.65 |
|
15 |
43.73 |
43.74 |
43.75 |
|
30 |
51.58 |
55.46 |
54.16 |
|
45 |
65.85 |
68.45 |
68.45 |
|
60 |
76.27 |
78.87 |
77.58 |
|
75 |
85.38 |
87.98 |
89.27 |
|
90 |
94.48 |
97.08 |
98.38 |
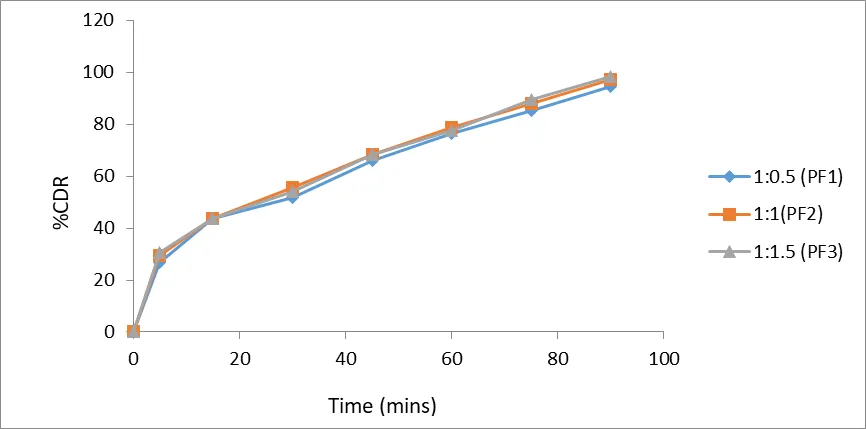
Fig 8: In-Vitro drug release profile for Glimepiride: Sodium starch glycolate (KF1-KF3)
Discussion: In-Vitro drug release of Glimepiride solid dispersions with Sodium starch glycolate in various ratios were observed which shows at the end of 90 mins, the formulation KF1 releases 94.48, formulation KF2 releases 97.08, formulation KF3 releases 98.38%
Solvent Evaporation Method
Table 13: In-Vitro drug release studies for formulations (SF1-SF3)
|
Time(min) |
1:0.5 (SF1) |
1:1(SF2) |
1:1.5 (SF3) |
|
0 |
0 |
0 |
0 |
|
5 |
26.77 |
29.35 |
31.94 |
|
15 |
43.73 |
43.74 |
43.76 |
|
30 |
52.87 |
56.75 |
54.16 |
|
45 |
65.85 |
68.46 |
69.74 |
|
60 |
77.56 |
80.16 |
77.58 |
|
75 |
86.68 |
89.28 |
90.56 |
|
90 |
95.78 |
97.09 |
99.68 |
Discussion: In-Vitro drug release of Glimepiride solid dispersions with Sodium starch glycolate in various ratios were observed which shows at the end of 90 mins the formulation SF1 releases 95.78, formulation SF2 releases 97.09, and formulation SF3 releases 99.68% of drug at the end of 90 mints.
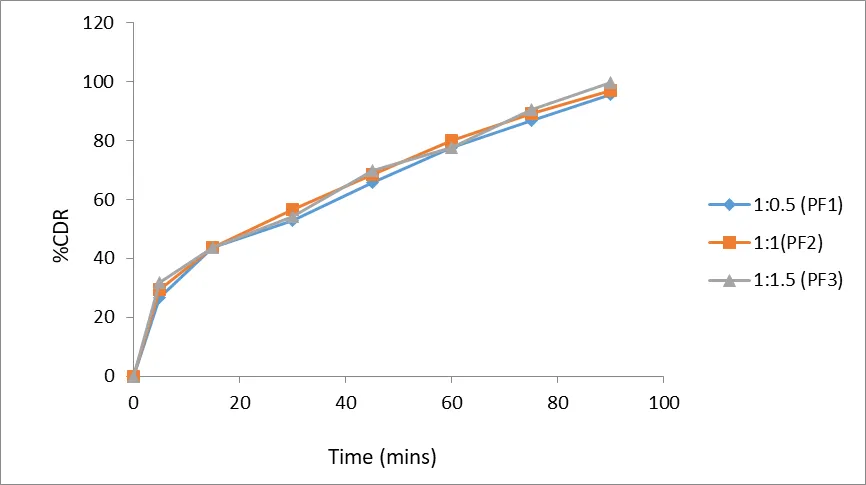
Fig 9: In-Vitro drug release profile for Glimepiride: Sodium starch glycolate (SF1-SF3)
Fusion Method:
Table 7.14: In-Vitro drug release studies for formulations (FF1-FF3)
|
Time(min) |
1:0.5 (F1) |
1:1(F2) |
1:1.5 (F3) |
|
0 |
0 |
0 |
0 |
|
5 |
26.77 |
28.06 |
29.35 |
|
15 |
39.85 |
42.44 |
43.74 |
|
30 |
51.56 |
52.86 |
54.16 |
|
45 |
61.97 |
65.85 |
68.45 |
|
60 |
73.66 |
76.27 |
78.87 |
|
75 |
81.48 |
85.38 |
87.98 |
|
90 |
93.17 |
95.77 |
97.08 |
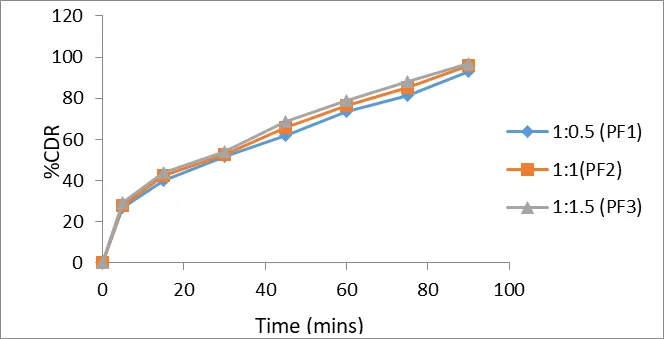
Fig 10: In-Vitro drug release profile for Glimepiride: Sodium starch glycolate (FF1-FF3)
Discussion: In-Vitro drug release of Glimepiride solid dispersions with Sodium starch glycolate in various ratios were observed which shows at the end of 90 mins the formulation FF1 releases 93.17; formulation FF2 releases 95.77, formulation FF3 releases 97.08%.By comparing results of all the formulations (PF1-PF3) (KF1-KF3) (SF1-SF3) & (FF1-FF3) formulation SF3 containing Glimepiride: Sodium starch glycolate (1:1.5) shows higher drug release 99.68 % at the end of 90 mins.Finally by comparing results of content uniformity, entrapment efficacy, In-Vitro drug release studies for all formulations (PF1-PF3) (KF1-KF3) (SF1-SF3) & (FF1-FF3),formulation SF3 containing Glimepiride: Sodium starch glycolate (1:1.5) shows better result, hence it was selected as the best formulation among all the formulations.
Phase- II
Evaluation of Blend
Evaluation of Pre Compression parameters
Table 15: Evaluation of Pre Compression parameters
|
Formulation Code |
Derived properties |
Flow properties |
|||
|
Bulk density (mean±SD) |
Tapped density (mean±SD) |
Angle of repose (mean±SD) |
Carr’s index (mean±SD) |
Hausner’s ratio (mean±SD) |
|
|
F1 |
0.46±0.02 |
0.54±0.015 |
26.26±0.96 |
14.81±1.28 |
1.12±0.02 |
|
F2 |
0.52±0.6 |
0.60±0.03 |
30.68±0.73 |
13.33±1.86 |
1.17±0.04 |
|
F3 |
0.49±0.2 |
0.58±0.006 |
29.26±0.36 |
15.51±1.96 |
1.18±0.05 |
|
F4 |
0.48±0.2 |
0.54±0.006 |
26.22±0.36 |
11.11±1.28 |
1.12±0.06 |
|
F5 |
0.46±0.2 |
0.52±0.006 |
28.36±0.36 |
11.53±1.16 |
1.13±0.02 |
|
F6 |
0.44±0.2 |
0.50±0.006 |
29.28±0.36 |
16.01±1.02 |
1.13±0.04 |
Discussion:
Evaluation of Tablets
Evaluation of Post Compression parameters
All the batches of tablet formulations were characterized for official evaluation parameters like Weight variation, Hardness, Friability, Tablet thickness and drug content and results are shown in the table 25.
Table 16: Evaluation of Post Compression parameters
|
Formulation |
Weight variation (mg) (mean±SD)
|
Thickness (mm) (mean±SD) |
Hardness (kp) (mean±SD) |
Friability (%) (mean±SD) |
Disintegrating time(sec) (mean±SD) |
|
F1 |
251.6±0.04 |
3.4±0.01 |
3.9±0.01 |
0.65±0.02 |
32.08±0.08 |
|
F2 |
249.2±0.03 |
3.2±0.01 |
3.7±0.01 |
0.59±0.08 |
34.29±0.02 |
|
F3 |
249.8±0.02 |
3.5±0.02 |
4.1±0.06 |
0.48±0.06 |
32.12±0.07 |
|
F4 |
249.2±0.06 |
3.6±0.06 |
3.9±0.02 |
0.52±0.02 |
34.26±0.05 |
|
F5 |
251.2±0.02 |
3.2±0.02 |
3.8±0.08 |
0.46±0.08 |
36.21±0.02 |
|
F6 |
249.02±0.08 |
3.4±0.06 |
3.7±0.04 |
0.52±0.02 |
26.28±0.04 |
Discussion:
Drug content uniformity of formulations
The prepared formulations were analyzed for drug content and the data is reported in below Table. The drug content was found to be within the limits which show that the drug was uniformly distributed in all the formulations.
Table 17: Drug content uniformity of formulations F1-F6
|
Tablet Formulation |
% of Drug Content
|
|
F1 |
99.59 |
|
F2 |
98.02 |
|
F3 |
97.26 |
|
F4 |
94.29 |
|
F5 |
96.65 |
|
F6 |
98.62 |
Discussion: The drug content values for all the formulations (F1-F6) was found to be in the range of 94.29 – 99.59%, Formulation F1 shows higher drug content uniformity 99.59%.
Dissolution studies of the tablets
The prepared tablets were subjected to dissolution studies in order to know the amount drug release.
Table 18: % Cumulative drug release of formulations F1-F6
|
Time(Min) |
F1 |
F2 |
F3 |
F4 |
F5 |
F6 |
|
00 |
0 |
0 |
0 |
0 |
0 |
0 |
|
05 |
39.70 |
37.11 |
37.11 |
33.23 |
34.53 |
33.23 |
|
10 |
52.85 |
50.25 |
48.96 |
50.23 |
47.65 |
45.06 |
|
15 |
67.15 |
64.55 |
63.24 |
63.25 |
60.65 |
63.22 |
|
20 |
80.16 |
76.26 |
76.26 |
74.96 |
74.95 |
74.96 |
|
25 |
91.87 |
90.55 |
86.67 |
89.25 |
86.66 |
84.08 |
|
30 |
99.69 |
97.10 |
95.78 |
97.09 |
95.78 |
94.47 |
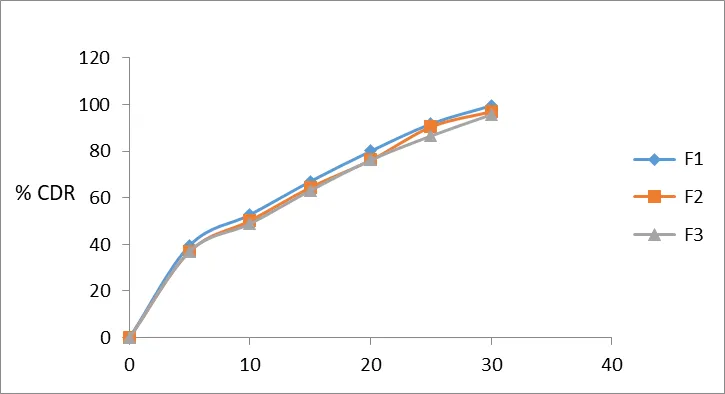
Fig 11: In-Vitro Drug Release of F1-F3
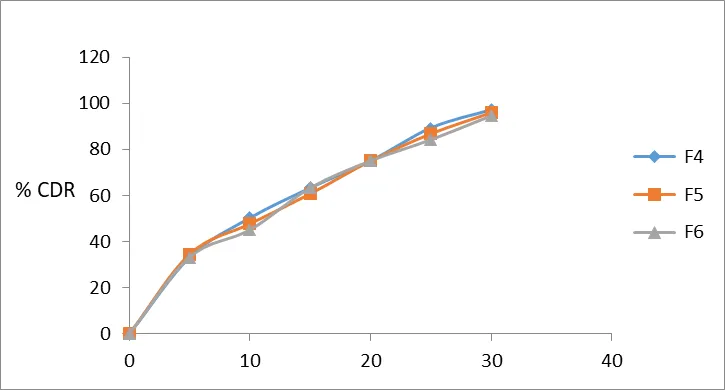
Fig 12: In-Vitro Drug Release of F4-F6
Discussion:
The complete comparative study of 200 mg various tablets for the equivalent weight of Glimepiride 04 mg various tablets formulated by Glimepiride solid dispersion with excipients. The rate of dissolution was excellently increased that tablets which were formulated from solid dispersions with excipients. Moreover formulation F1 showed their highest release (99.69%) for the tablets formed by solid dispersion 1:1.5(Glimepiride: Sodium starch glycolate) with MCC (86mg).
CONCLUSION
Sodium starch glycolatewas used in the preparation of solid dispersions by physical mixture method, kneading method, solvent evaporation and Fusion method.
Formulation (SF3) containing Glimepiride + Sodium starch glycolate(1:1.5) shows better results by solvent evaporation method at the end of 90 min with drug release of 99.68 %, hence it was selected as the best formulation. In this study, it was found that use of disintegrating agent as carrier for solid dispersions is a suitable technology to improve the dissolution behavior of poorly water soluble drugs.
In this study, it was found that the tablets prepared with the lactose, MCC and starch as diluents, tablets with lactose and MCC combination tend to exhibit rapid dissolution. The rate of drug release is (lactose +MCC) > (lactose + starch) in the tablet formulations.
Moreover formulation F1 showed their highest release (99.69%) for the tablets formed by solid dispersion 1:1.5(Glimepiride: Sodium starch glycolate) with MCC (86mg) as diluent.
SUMMARY
Glimepiride is a poorly water-soluble antidiabetic drug whose oral performance is limited by slow dissolution. The present study investigated the preparation of glimepiride solid dispersions using sodium starch glycolate by physical mixing, kneading, solvent evaporation and fusion methods in different drug-to-carrier ratios (1:0.5, 1:1 and 1:1.5). The prepared formulations were evaluated for drug content, entrapment efficiency, compatibility and in-vitro drug release. Among all formulations, SF3 prepared by the solvent evaporation method (1:1.5) exhibited the best performance with 99.68% drug release after 90 minutes, together with excellent drug content and entrapment efficiency. The optimized solid dispersion was further formulated into immediate-release tablets. All tablet formulations satisfied pharmacopeial quality requirements, while formulation F1 containing MCC as diluent demonstrated the highest drug content (99.59%) and drug release (99.69%). The findings indicate that sodium starch glycolate-based solid dispersion prepared by solvent evaporation is an effective strategy for enhancing the dissolution of glimepiride and is a promising approach for developing immediate-release oral dosage forms.
REFERENCES


Ratan Kachave, Ravi Pimple*, Ramesh Ingole, Formulation And Evaluation Of Immediate Release Tablets Of Glimepiride Solid Dispersion, Int. J. of Pharm. Sci., 2026, Vol 4, Issue 7, 6068-6086. https://doi.org/ 10.5281/zenodo.21721613
 10.5281/zenodo.21721613