

We use cookies to ensure our website works properly and to personalise your experience. Cookies policy
Mandesh Institute of Pharmaceutical Science and Research centre, Mhaswad, Satara.
Ocular drug delivery is the most challenging tasks for the pharmaceutical researchers. To retain a therapeutic level of the drug at the site of action for a prolonged duration is major obstacle. Due to unique anatomy and physiology, the eye presents challenges for delivery of pharmaceuticals.
The structure of eye is divided into two main parts that are anterior segment and posterior segment. Approximately one-third portion of the eye is occupied by anterior segment whereas the residual portion is occupied by the posterior segment. Anterior portion includes cornea, aqueous humor, conjunctiva, iris, ciliary body and lens whereas back of the eye or posterior segment of the eye consists of sclera, choroid, neural retina, retinal pigment epithelium, optic nerve and vitreous humour. [1,2]
Ideal characteristics required to optimize ocular drug delivery systems:
Routes of Ocular Drug Delivery
It includes subconjunctival, subtenon, retrobulbar, and peribulbar administration
VESICULAR DRUG DELIVERY SYSTEM
In novel drug delivery system, the vesicular drug delivery system (VDDS) has become popular due to its benefits such as improved bioavailability and reduced dose frequency. It gives prolonged and controlled action at the corneal surface by preventing the metabolism of the drug from the enzymes present at the tear/corneal epithelium
PREPARATION OF SURFACTANT BASED VESICLES
They can be prepared by theethanol injection method.
Dissolve drugin ethanol in water bath at 70 ˚C
↓
Quickly inject this resultant solution into preheated aqueous phase containing the EA(Tween80)
↓
Stir continuously on a magnetic stirrer at 1000 rpm for 15 min at 70 ˚C
↓
Cool at room temperature to get drug-loaded surfactant based vesicular dispersion[14]
FUNGAL INFECTIONS
Fungal infections are mostly responsible for ocular morbidity and blindness. Fungi are subdivided into yeasts and molds. For treatment of ocular fungal infection antifungal agents are required. [16]
MATERIALS AND METHODS
Materials:-
List of chemicals used in formulation of eye drops
|
Sr. No |
Chemicals |
Manufacturer/ Supplier |
|
1 |
Tween 80 |
S. D. Chemical Center, Mumbai. |
|
2 |
Span80 |
|
|
3 |
Ethanol |
|
|
4 |
Voriconazole |
Cipla lab, Mumbai |
All the other reagent sused were of analytical gradeand were used as procured.
List of Equipment’s used
|
Sr. No. |
Name of Equipment |
Manufacturer |
|
1 |
Weighing Balance |
Adventurer-Ohaus |
|
2 |
Melting Point Apparatus |
Chemiline (CL726) |
|
3 |
pH Meter |
Microprolabmate |
|
4 |
Magnetic Stirrer |
Remi Scientific Instruments, Mumbai |
|
5 |
UV-Visible Spectrophotometer |
Shimadzu, Japan |
|
6 |
ATR-FTIR Spectrophotometer |
Bruker, Alpha |
|
7 |
Stability Chamber |
Thermolab |
|
8 |
Binocular Microscope |
Lawrence and Mayo |
|
9 |
Differential Scanning Calorimeter |
Perkin Elmer 4000 |
|
10 |
Zeta Analyzer |
Horiba Nanoparticles Analyzer SZ-100 |
|
11 |
Particle Size Analyzer |
Horiba Nanoparticles Analyzer SZ-100 |
Method:-
Preformulation studies
Characterization of drug
Accurately weighed 100 mg of drug was dissolved in 100 ml of ethanol to form stock-I (1000μg/ml).10 ml ofsolution was with drawn from stock-I added to 100 ml of volumetric flask. The volume was made to 100 ml using ethanol to form stock-II (100 μg /ml). Then 1 ml from stock-II was withdrawn and added to 10 ml volumetric flask. The volume was adjusted to 10ml using ethanol to prepare final solutions (10μg/ml). The UV spectrum was recorded in range of 200-400 nm using UV spectrophotometer. The ƛ max was determined by scanning solution of 10μg/ml against blank solution..
Accurately weighed 100mg of voriconazole was added in to 100 ml volumetric flasks. Then small amount of ethanol was added to dissolve the drug and then volume was made to 100 ml with the methanol (diluents). The concentration of standard stock solution was 1000 µg/ml.
Transferred 1 ml from the above standard stock solutions in to 10 ml volumetric flasks and diluted up to the mark with diluent toget working secondary stock solution having concentration of 100μg/ml.
From the secondary stock solution 1, 1.2, 1.4, 1.6, 1.8, 2, 2.2, 2.4 ml were transferred to 10ml volumetric flasks and final volume was made to 10ml with methanol to prepared solution in concentration range of 10-24 μg/ml. The absorbance of each dilutions were measured at λ max 255 nm using methanol as ablankand standard curve was plotted between concentration (μg/ml) on X-axis and absorbance on Y-axis. The calibration curve follows equation of straight line,
Y = mx + C
Where, Y=absorbance m=slope x=concentration C=constant
Characterization of excipients
Saponification value is number of mg of potassium hydroxide necessary to neutralize the free acids and to saponify esters present in 1gm of substance. 2 gm. of substance under examination was accurately weighed into 200ml flask of borosilicate glass fitted with reflux condenser. Then in this flask 25ml of 0.5M ethanolic KOH and little pumice powder was added.All this material was boiled under reflux on water bath for 30min. 1ml of phenolphthalein solution was added and this whole solution was titrated with 0.5M HCl (a). Blank titration was carried out (b). Saponification value was determined by using formula-
Saponification Value=28.05×(𝑏−𝑎)/𝑊
Where, W- Weight in gm of substance [30]
Acid value is the number which express in milligrams. The amount of potassium hydroxide necessary to neutralize the free acids present in 1 gm of the substance. 10 g of the substance under examination was accurately weighed into 50ml flask of a mixture of equal volume of ethanol (95 %) and ether previously neutralized with 0.1 m potassium hydroxide to phenolphthalein solution. If the sample does not dissolve in the cold solvent connect flask with the reflux condenser and warm slowly with frequent shaking until the sample dissolve. Add 1 ml of phenolphthalein solution and titrate with 0.1 KOH until the solution remains faintly pink after shaking for 30 seconds. Acid value was determined by using formula-
Acid value=5.61 × n/𝑊
Where, n= the number of ml of 0.1 M KOH required. W=the weighting of the substance[30]
Preparation of surfactant based vesicles:
Surfactant based vesicles containing Span 80 and edge activator (EA) Tween 80 were prepared by ethanol injection method. Voriconazole and span 80 were dissolved in ethanol. The solution so prepared is then transferred rapidly into the preheated tween 80 and vigorously stirred on the magnetic stirrer at high speed 1000 rpm/ min. Voriconazole was used at a concentration of 10 mg/ml for the preparation of vesicles. [12,14]
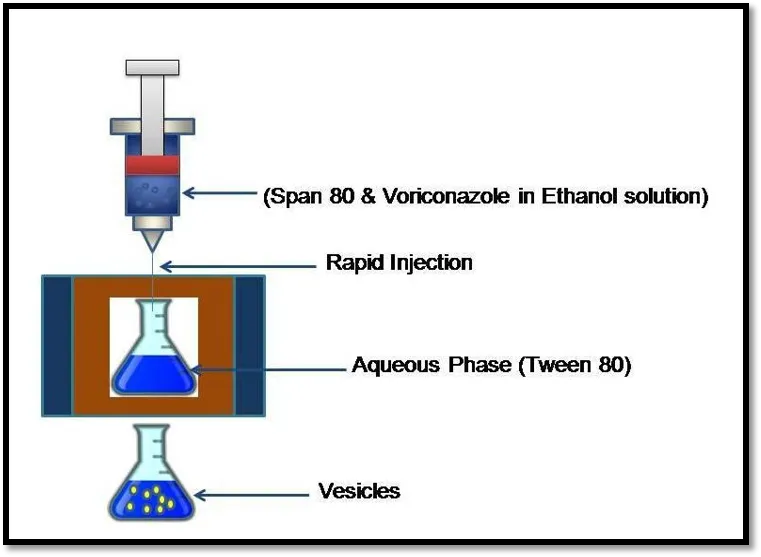
Ethanol injection method for formulation of Surfactants Based Ocular Drug Delivery system of voriconazole.
Design of experiment
A 32 full factorial design was chosen in which concentration of tween 80 (X1) and concentration spans 80 (X2) were used as 2 factors and experimental trials were performed at all 9 possible combinations.
Amount of variables in 32 factorial design batches-
|
Coaded Values |
Actual Values |
|
|
X1:(Conc of Span 80) |
X2:(Conc of Tween 80) |
|
|
-1 |
10 % |
70 % |
|
0 |
20 % |
80 % |
|
1 |
30 % |
90 % |
Responses:
Y1=Total drug content
Y2=Corneal Permeability Studies (CADD/cm2)
A32 full factorial experimental design layout
|
Formulation batches |
Coded values |
|
|
X1 |
X2 |
|
|
F1 |
1 |
1 |
|
F2 |
1 |
-1 |
|
F3 |
1 |
0 |
|
F4 |
0 |
0 |
|
F5 |
0 |
-1 |
|
F6 |
0 |
1 |
|
F7 |
-1 |
0 |
|
F8 |
-1 |
1 |
|
F9 |
-1 |
-1 |
Composition of surfactant based vesicles of voriconazole
|
Formulation batc |
|
Ingredients |
|||
|
Voriconazole (mg) |
Span80 (%) |
Tween80 (%) |
Ethanol (ml) |
Water (ml) |
|
|
F1 |
100 |
30 |
90 |
q. s |
q. s |
|
F2 |
100 |
30 |
70 |
q. s |
q. s |
|
F3 |
100 |
30 |
80 |
q. s |
q. s |
|
F4 |
100 |
20 |
80 |
q. s |
q. s |
|
F5 |
100 |
20 |
70 |
q. s |
q. s |
|
F6 |
100 |
20 |
90 |
q. s |
q. s |
|
F7 |
100 |
10 |
80 |
q. s |
q. s |
|
F8 |
100 |
10 |
90 |
q. s |
q. s |
|
F9 |
100 |
10 |
70 |
q. s |
q. s |
EVALUATION OF FORMULATION
Isopropyl alcohol was chosen as a suitable solvent for disrupting the prepared vesicles. Aqueous dispersion (1 ml) was disrupted using sufficient quantity of isopropyl alcohol and the absorbance was recorded at 255 nm. [12]
% Drug content= actual drug content/ Theoretical drug content *100
Study is performed on a Franz diffusion cell assembly.
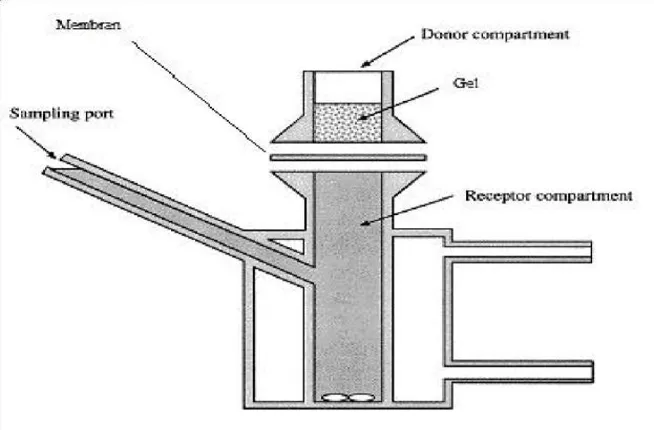
Franz diffusion cell
Drug permeation studies were carried out by using freshly excised goat cornea. Goat whole eye balls were transported from the local butcher shop to the laboratory in cold (4°C) normal saline within 1 hour of slaughtering of the animal. The cornea was carefully excised along with 2 to 4 mm of surrounding sclera tissue and was washed with cold normal saline till the washing was free from proteins. The receptor compartment of an all-glass modified Franz diffusion cell was filled with 40 mL freshly prepared normal saline solution (pH 7.4) and all air bubbles were expelled from the compartment. Freshly excised cornea was fixed between clamped donor and receptor compartments in such a way that its epithelial surface faced the donor compartment.The corneal area available for diffusion was 2.26 cm2. An aliquot (1 mL) of test solution was placed on the cornea and the opening of the donor cell was sealed with a glass cover slip. The receptor fluid was kept at 37°C with constant stirring using a Teflon-coated magnetic stir bead.
Permeation study was continued for 180minutes and samples were withdrawn from receptor and analyzed for voriconazole content by measuring absorbance at 255nm in a spectrophotometer.[25]
Vesicles were characterized by using optical microscope for structural attributes such as uniformity of size, shape and physical stability characteristics i.e. aggregation and/or irregularity. [12]
Particle size analysis was carried out by using Horiba Nanoparticle Analyzer SZ- 100 instrument. SZ-100 uses the technique of dynamic light scattering to determine particle size. During testing, temperature was maintained at 250 C. Sample was placed in sample holder. [12] Zeta potential of formulation can be measured by zeta meter. Zeta potential analysis was determined by using Horiba Analyzer SZ-100 instrument. [14]
Stability studies were carried out for optimized formulation. For stability studies the optimized formulations were stored at temperature 4˚C-8˚C and 25˚C for a period of 2 months. Sample was analyzed for the change in appearance and aggregation. [12]
RESULTS AND DISCUSSION
Preformulation studies
Characterization of drug
Drug sample was found to be odourless, solid, white crystalline powder.
Melting point of Voriconazole was found to be in range of 127-130°C which complies with that given in the literature. [18]
Melting point of drug
|
Sr. No |
Observed melting point |
Average Melting Point |
|
1 |
127-130ºC |
127-130ºC |
|
2 |
128-131ºC |
|
|
3 |
127-130ºC |
According to the thermogram, a sharp endothermic peak was observed at 130.99 ºC which corresponds to the melting point of pure drug. Such an endothermic peak was also reported for standard drug material near to the melting range. [27] This indicated that Voriconazole drug was in pure form.
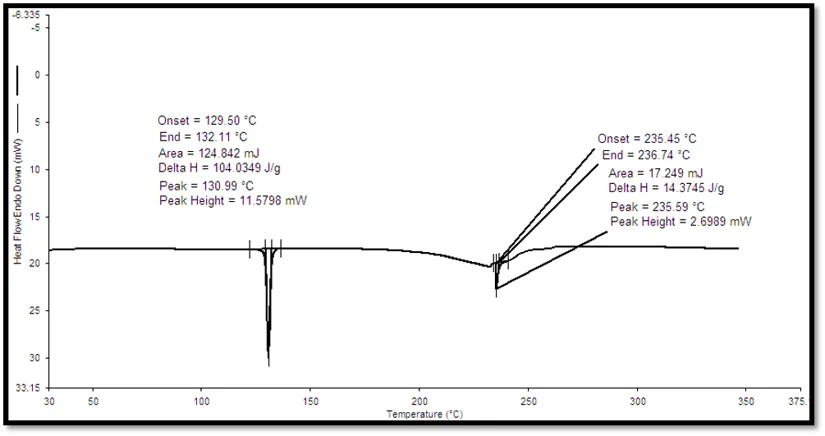
DSC thermogram of pure drug
The infrared spectrum of Voriconazole was recorded and spectral analysis was carried out is shown in Fig-9.2
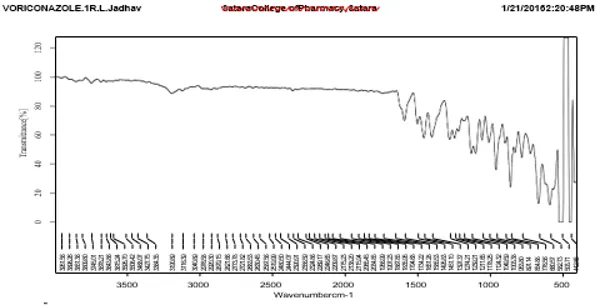
FTIR Spectrum of Voriconazole
IR interpretation of Voriconazole
|
Sr. No |
Functional Groups Associated |
Standard Wave Number (cm-1) |
Observed Wave number (cm-1) |
|
1 |
C=C |
1600, 1475 |
1585, 1451 |
|
2 |
C-N |
1350-1000 |
1049 |
|
3 |
C=N |
1690-1640 |
1647 |
|
4 |
O-H |
3400-2400 |
3190 |
|
5 |
C-F |
1400-1000 |
1397 |
In IR study, it was found that all the important characteristic peak were present, which confirmed the purity of drug sample.
λ max Determination-
The λ max value of Voriconazole was found to be 255 nm in ethanol.
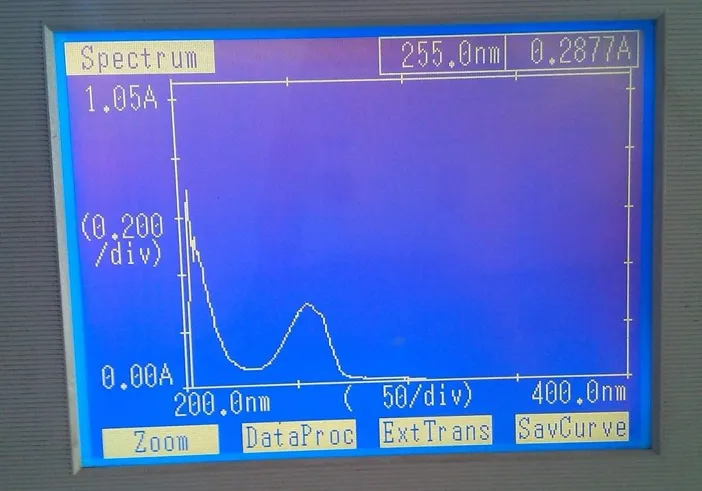
UV Spectrum of Voriconazole
Calibration Curve of Voriconazole in ethanol-
The standard calibration curve for Voriconazole in ethanol was plotted by using following results of absorbance at various concentrations.
Observations for calibration curve of Voriconazole.
|
Sr.no |
Concentration (µg/ml) |
Absorbance |
|
1 |
0 |
0 |
|
2 |
10 |
0.2898 |
|
3 |
12 |
0.3543 |
|
4 |
14 |
0.4321 |
|
5 |
16 |
0.4982 |
|
6 |
18 |
0.5687 |
|
7 |
20 |
0.6254 |
|
8 |
22 |
0.6532 |
|
9 |
24 |
0.7132 |
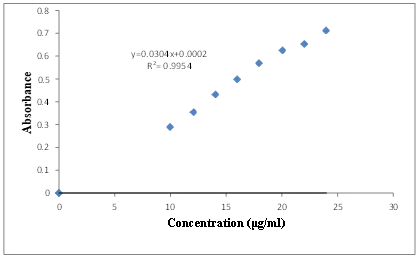
Calibration Curve of Voriconazole in ethanol
Parameters of Calibration Curve of Voriconazole in ethanol
|
Sr. No |
Parameter |
Value |
|
1 |
ƛmax |
255 nm |
|
2 |
Slope (m) |
0.0304 |
|
3 |
Intercept(c) |
0.0002 |
|
4 |
Linearity Range |
10-24μg/ml. |
|
5 |
Correlation Coefficient(r2) |
0.995 |
This study was carried out to check for any possible interaction between the drug and excipient. Drug – excipient interaction study was performed by FTIR and DSC study.
From FTIR study, it was found that the peaks found in pure drug and formulation are similar. Thus incorporation of drug in surfactants did not change the position of its functional groups. This indicated that there was no interaction between drug and excipients.
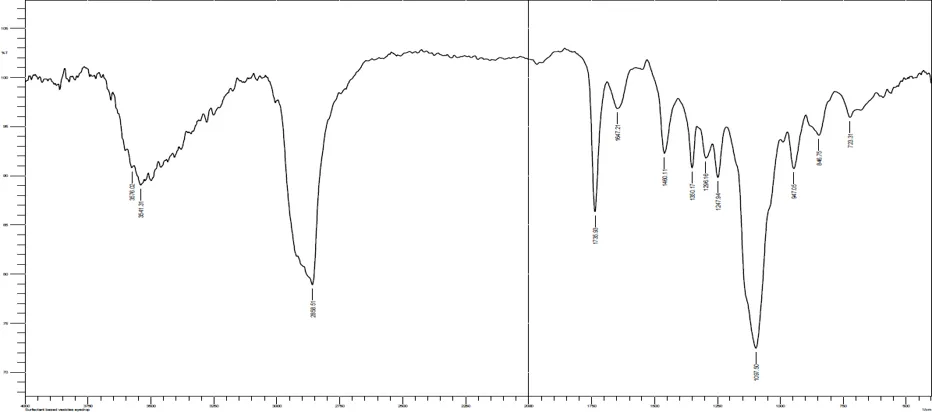
FTIR spectra of Surfactants Based Ocular Drug Delivery system of Voriconazole
IR interpretation of optimized formulation
|
Sr. No |
Functional Groups Associated |
Standard Wave number (cm-1) |
Observed Wave number (cm-1) |
|
1 |
C=C |
1600, 1475 |
1550, 1460 |
|
2 |
C-N |
1350-1000 |
1097 |
|
3 |
C=N |
1690-1640 |
1651 |
|
4 |
O-H |
3400-2400 |
2858 |
|
5 |
C-F |
1400-1000 |
1350 |
According to thermogram, peak was observed at 119.66°C which is at low temperature compared to thermogram of pure drug (130.99 °C). This shifting of peak may be due to presence of surfactants which encapsulates the drug by forming vesicles.
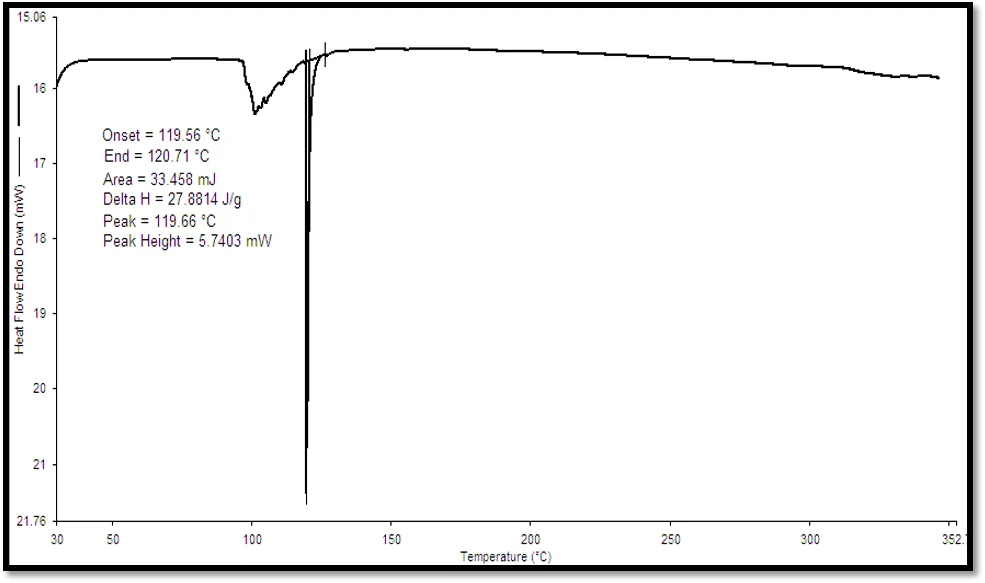
DSC thermogram of Optimized formulation
Characterization of excipients (span80 and tween80)
Saponification value was determined by using formula-
Saponification value=28.5 x (b-a)w

Saponification value span 80 =28.5 x (20.5-10.5)2

=140.25
Saponification value of span 80 was found near to standard value (145-160) and it confirmed the purity of span 80.
Saponification value Tween 80 =28.5 x (20.5-16.2)2

=60.30
Saponification value of tween 80 was found near to standard value (45-55) and it confirmed the purity of tween 80.
Acid value was determined by using formula-
Acid value =5.61 nw
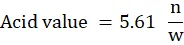
Where, n= the number of ml of 0.1 M KOH required.
W= the weighting of the substance.
Acid value for Span 80 =
Acid value =5.61 15.610
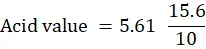
=8.75
Acid value of span 80 was found near to standard value (less than 8) and it confirmed the purity of span 80.
Acid value of tween 80 =
Acid value =5.61 2.510
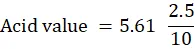
=1.40
Acid value of tween 80 was found tobe complied with standard value and it confirmed the purity of tween 80.
Evaluation of surfactant-based formulation
Drug content of all the batches of formulation was calculated. Drug content was calculated by using formula
%Drug content =actual drug content/The oretical drug content X 100
The result was found in the range of 73.72-80.03%. The drug content of the F4 formulation was found to be higher i.e., 80.03% based on the calibration curve. All the values of formulation are shown in table no 9.6.
Drug content of all batches of formulation
|
Sr. No |
Formulation Batch |
Drug content (%) ± SD (n= 3) |
|
1 |
F1 |
76.26±0.0124 |
|
2 |
F2 |
76.41±0.0152 |
|
3 |
F3 |
74.11±0.0100 |
|
4 |
F4 |
80.03±0.0152 |
|
5 |
F5 |
77.42±0.0100 |
|
6 |
F6 |
77.68±0.0152 |
|
7 |
F7 |
76.21±0.0200 |
|
8 |
F8 |
78.10±0.0152 |
|
9 |
F9 |
73.72±0.0200 |
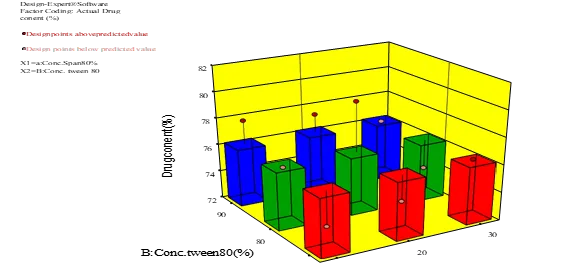
Response 3D Surface plot for Drug Content(%)
The relationship between the response and variables can be directly visualized from the response surface plot. The response surface plot was generated using Design Expert 10 software and was presented in figures 9.7. This was used to observe the effect of independent variables on the % drug content. From plot it was observed that batch F4 containing 20:80 (Span 80: Tween 80) shows higher drug content (80.03%).
Goat corneas were used to study the permeation across the corneal membrane. In the study, cumulative amount of drug diffused per unit area (CADD/ cm2) for all formulation was calculated. The CADD/ cm2 of all formulations were quoted in table no. 9.7 and 9.8. Percent cumulative amount of drug diffusion (CADD %) were quoted in table no. 9.9 and 9.10.
Amount of drug diffused per unit area for formulation Batch F1to F5
|
Time (min) |
CADD/ cm2±SD(n=3) |
||||
|
F1 |
F2 |
F3 |
F4 |
F5 |
|
|
0 |
0 |
0 |
0 |
0 |
0 |
|
30 |
0.63±0.03 |
0.68±0.01 |
0.05±0.01 |
1.08±0.06 |
0.01±0.01 |
|
60 |
0.73±0.06 |
0.88±0.01 |
0.07±0.0 |
3.10±0.09 |
0.03±0.01 |
|
90 |
0.78±0.06 |
1.27±0.06 |
0.43±0.07 |
3.20±0.03 |
0.27±0.01 |
|
120 |
1.14±0.01 |
2.22±0.04 |
1.64±0.07 |
3.38±0.02 |
0.80±0.01 |
|
150 |
2.47±0.01 |
2.71±0.07 |
1.72±0.01 |
4.12±0.15 |
1.33±0.03 |
|
180 |
2.97±0.06 |
3.23±0.05 |
2.48±0.04 |
4.22±0.02 |
1.68±0.01 |
Amount of drug diffused per unit area for formulation Batch F6 to F9
|
Time (min) |
CADD/cm2±SD(n=3) |
|||
|
F6 |
F7 |
F8 |
F9 |
|
|
0 |
0 |
0 |
0 |
0 |
|
30 |
0.02±0.02 |
0.42±0.33 |
0.82±0.36 |
0.80±0.01 |
|
60 |
0.24±0.09 |
0.59±0.04 |
1.71±0.02 |
0.85±0.03 |
|
90 |
0.68±0.01 |
0.71±0.01 |
2.31±0.06 |
1.07±0.03 |
|
120 |
1.38±0.07 |
2.45±0.14 |
2.55±0.02 |
1.40±0.02 |
|
150 |
1.70±0.01 |
2.64±0.02 |
3.22±0.01 |
2.23±0.03 |
|
180 |
2.43±0.07 |
2.72±0.04 |
3.54±0.01 |
3.35±0.06 |
Percent cumulative amount of drug diffused for formulation Batch F1 to F5
|
Time (min) |
CADD %± SD (n= 3) |
||||
|
F1 |
F2 |
F3 |
F4 |
F5 |
|
|
0 |
0 |
0 |
0 |
0 |
0 |
|
30 |
14.33±0.07 |
15.40±0.02 |
1.20±0.01 |
24.56±0.13 |
0.23±0.01 |
|
60 |
16.53±0.13 |
19.93±0.02 |
1.56±0.005 |
71.10±0.01 |
0.73±0.005 |
|
90 |
17.60±0.13 |
28.70±0.13 |
9.66±0.15 |
71.53±0.05 |
6.13±0.02 |
|
120 |
25.80±0.01 |
50.43±0.09 |
37.36±0.15 |
76.53±0.03 |
18.20±0.01 |
|
150 |
56.06±0.01 |
61.46±0.15 |
38.93±0.1 |
92.20±0.14 |
30.60±0.05 |
|
180 |
67.40±0.14 |
73.23±0.12 |
56.23±0.08 |
95.83±0.04 |
37.96±0.005 |
Percent cumulative amount of drug diffused for formulation Batch F6 to F9
|
Time (min) |
CADD%± SD(n= 3) |
|||
|
F6 |
F7 |
F8 |
F9 |
|
|
0 |
0 |
0 |
0 |
0 |
|
30 |
0.53±0.04 |
9.56±0.75 |
18.60±0.14 |
18.13±0.01 |
|
60 |
5.50±0.21 |
13.33±0.80 |
38.80±0.51 |
19.26±0.06 |
|
90 |
15.33±0.01 |
16.20±0.02 |
52.36±1.36 |
24.03±0.04 |
|
120 |
31.26±0.16 |
55.50±0.31 |
57.76±0.49 |
31.80±0.03 |
|
150 |
38.53±0.01 |
59.80±0.04 |
72.96±0.15 |
50.63±0.06 |
|
180 |
55.03±0.14 |
61.76±0.08 |
80.16±0.05 |
75.90±0.13 |
Following graph represent the comparative drug diffusion profile of all the formulation batches.
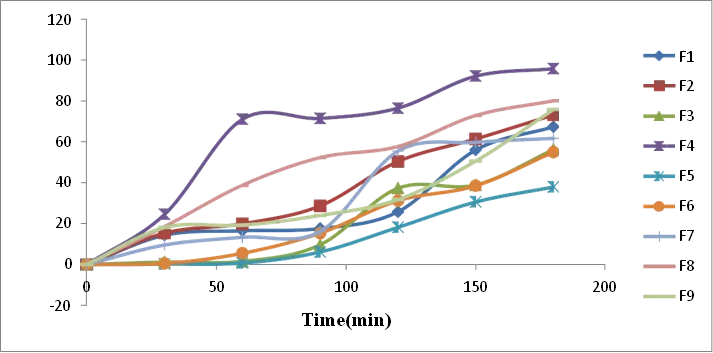
Comparative drug diffusion profile of F1- F9
From graphical presentation it was found that batch F4 gives maximum cumulative drug diffusion.
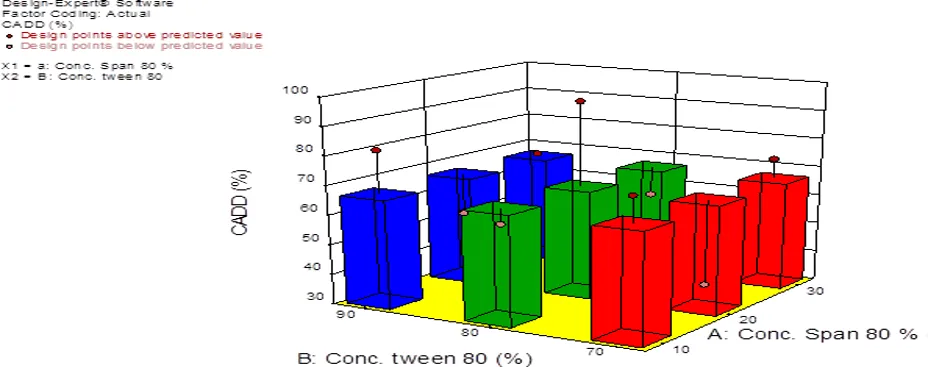
Response 3D Surface plot for CADD (%)
The response surface plot was generated using Design Expert 10 software and was presented in Figures 9.9. The plot shows that batch F4 gave maximum CADD% compared to other formulation batches. The reason behind better permeability of the F4 batch may be the ratio of surfactants, i.e., Span 80: Tween 80 (20:80). Span 80 at a concentration of 20% solubilised the drug, and Tween 80 at 80% concentration performed the role of edge activator, which helped the drug to pass through the corneal barrier. Above or below the 20:80 ratio, surfactants may fail to perform their role as solubiliser and edge activator.
Corneal Permeability Study by Using Saline pH 7.4 Solution
The drug (Voriconazole) was dissolved in pH 7.4 solution. By using this solution, the corneal permeability study was carried out to compare the diffusion rate with formulation batches. Table No. 9.11 shows the values of CADD/cm² and CADD% by using saline pH 7.4 solution.
Amount of Drug Diffused per Unit Area and % Cumulative Amount of Drug Diffused from Saline pH 7.4 Solution
|
Sr. No |
Time (min) |
CADD/cm2 ± SD (n=3) |
CADD % ± SD (n= 3) |
|
1 |
0 |
0 |
0 |
|
2 |
30 |
0.03±0.01 |
0.70±0.01 |
|
3 |
60 |
0.04±0.01 |
1.00.±0.01 |
|
4 |
90 |
0.2±0.05 |
4.56±0.11 |
|
5 |
120 |
0.46±0.01 |
10.50±0.1 |
|
6 |
150 |
1.43±0.05 |
32.30±0.10 |
|
7 |
180 |
1.46±0.12 |
33.30±0.27 |
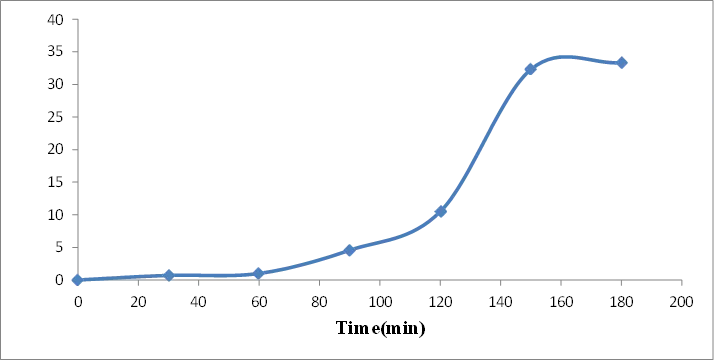
CADD% in saline pH 7.4 solution
From study it was found that in saline pH 7.4 solution CADD % was 33.30±0.27.
From overall corneal permeability study it was found that surfactant based formulation gave more drug diffusion compared to saline pH 7.4 solution. Among all batches, formulation batch F4 found to be giving maximum drug release i.e., 95.83±0.04.
By studying drug content and corneal permeability of all batches, batch F4 was taken as optimized batch and used for further studies.
For an initial characterization of the vesicles, Voriconazole surfactant based formulations were observed microscopically. Optical observation indicated the vesicles were small in size, round in shape and no aggregation was observed in the formulation.
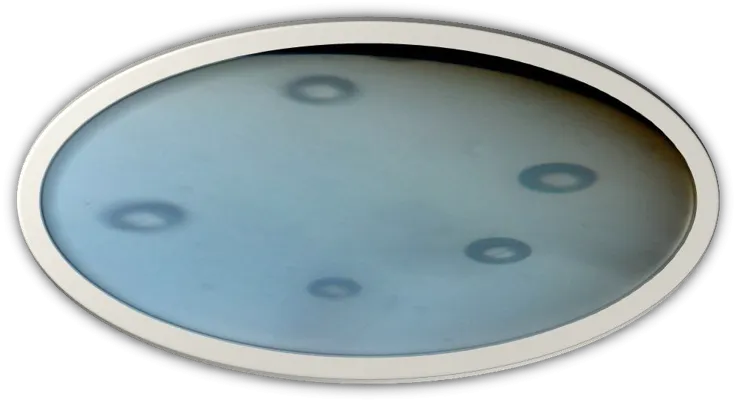
Optical microscopy of optimized formulation batch 4
The mean particle size of formulations should be in range of nanometer to micron. The optimized batch of surfactant based vesicles was used for particle size determination. The average particle size of optimized formulation was found to be 251.1 nm, which lies in standard range. Dispersity index was found to be 2.37. Therefore, formulation was found to be polydisperse in nature.
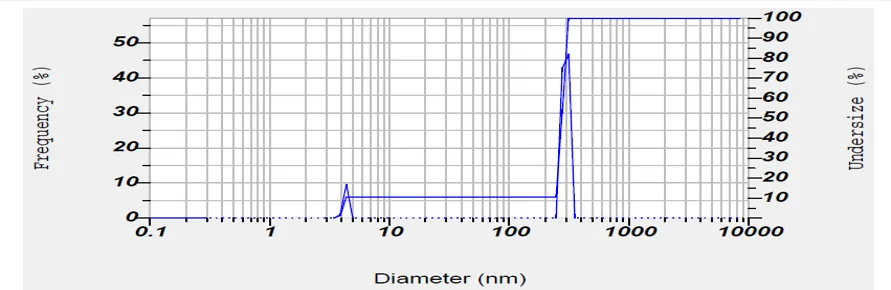
Graph of particle size of optimized batch (F4)
Measurement of Zeta potential is very important parameter in determination of stability of formulation. Highly negative or highly positive zeta potential indicates good physical stability. Value > ±20 is essential for effective stability and decrease aggregation. Zeta potential of optimized formulation was found to be -1.6 mV which was not according to standard range.
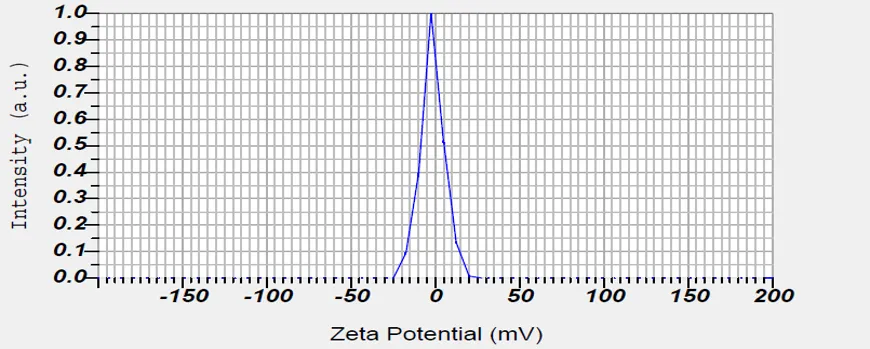
Graph of zeta potential of optimized batch (F4)
Optimized formulation was subjected to stability studies as per the literature search. Stability of vesicles is studied by studying aggregation/ irregularity and appearance of vesicles over a period of 2 months storage. Table no. 9.12 shows result of stability studies.
Observation of stability studies
|
Condition for stability |
Duration |
Appearance |
Aggregation |
|
Refrigeration (4˚C -8˚C) |
0 day |
Clear solution |
No |
|
15 days |
Clear solution |
No |
|
|
30 days |
Clear solution |
No |
|
|
60 days |
Clear solution |
No |
|
|
Ambientroom temperature (25˚C) |
0 day |
Clear solution |
No |
|
15 days |
Clear solution |
No |
|
|
30 days |
Clear solution |
No |
|
|
60 days |
Clear solution |
No |
Extent of drug aggregation in refrigerator and at ambient room temperature (25˚C) was significantly low. Hence, the formulation can be refrigerated or stored at room temperature for use.
CONCLUSION
Surfactant based vesicles of Voriconazole containing Span 80 and edge activator (EA) Tween 80 were prepared by ethanol injection method and evaluated.
Purity of drug and excipients were confirmed by pre-formulation testing. Purity of drug was confirmed from calibration curve, melting point and analytical method. IR and DSC studies indicated excipients used in formulation were compatible with drug.
By using 32 full factorial design, surfactant-based vesicles of Voriconazole were prepared in which concentration of tween 80 and concentration span 80 were used as 2 factors and experiments were performed. The response surface plot was generated using software. This was used to observe the effect of independent variables on the % drug content and corneal permeability. From plot it was observed that formulation batch F4 containing 20:80 (Span 80: Tween 80) showed better corneal permeability (95.83±0.04 %) performed on goat’s eye and higher drug content (80.03±0.0152 %) among all formulated batches.
When optimized batch is compared with normal saline pH 7.4 solution it found that newly developed surfactant-based formulation gives increase in corneal permeability.
In stability study,it was found that extent of drug aggregation upon storage in refrigerator and at ambient room temperature was significantly low. Hence the formulation is stable in nature.
Therefore, from the present study it can be concluded that surfactant based ocular drug delivery systems shows good permeability for topical ocular delivery of Voriconazole and it can be used to deliver drugs to the posterior segment of the eye.
REFERENCES




Harsha Kamble, Shweta Nagtilak, Dr. Naga Potnuri, Ananda Waghmode, Formulation and Evaluation of Surfactants Based Ocular Drug Delivery System of Antifungal Drug, Int. J. of Pharm. Sci., 2026, Vol 4, Issue 7, 5442-5459. https://doi.org/10.5281/zenodo.21662278
 10.5281/zenodo.21662278