
We use cookies to ensure our website works properly and to personalise your experience. Cookies policy
Nimra College of Pharmacy, Jupudi, Ibrahimpatnam, NTR-521456.
The main objective of the present investigation was to formulate extended-release tablets of Metoprolol Succinate using a 2³ factorial design. The tablets were prepared by the direct compression technique using different concentrations of release-retarding polymers such as Neem Gum, HPMC, and Guar Gum. In this study, the concentrations of Neem Gum, HPMC, and Guar Gum were considered as independent variables, while the percentage drug release at 1 hour and 20 hours served as dependent variables. A total of eight formulations were developed and evaluated for various parameters including hardness, friability, thickness, drug content, and in-vitro drug release. The results revealed that all formulations complied with Pharmacopoeial limits. Furthermore, the in-vitro dissolution data of all formulations were fitted to different kinetic models, and statistical parameters such as intercept (a), slope (b), and regression coefficient (r) were determined. Among all the formulations, formulation F2 exhibited the best extended-release profile with 99.56% drug release, indicating its superiority over the other formulations.
Because oral controlled drug delivery systems can maintain stable plasma drug concentrations, increase therapeutic efficacy, decrease dose frequency, and improve patient compliance, they have drawn a lot of interest in pharmaceutical research. Extended-release tablets are the most popular type of controlled-release dosage form because they minimize medication plasma level changes and offer longer pharmacological effect. A selective β1-adrenergic receptor blocker, metoprolol succinate is frequently used to treat heart failure, angina pectoris, hypertension, and myocardial infarction. Because of its very short biological half-life of three to seven hours, it must be administered often in traditional dosage forms. Consequently, the creation of an extended-release metoprolol succinate formulation is advantageous for preserving stable therapeutic levels for extended periods of time, lowering the frequency of doses, and enhancing patient compliance with treatment. Because of their simplicity, affordability, and convenience of production, hydrophilic matrix systems are among the most widely used methods for creating extended-release formulations. Natural polymers' biodegradability, biocompatibility, non-toxicity, affordability, and environmental friendliness have made them attractive excipients for controlled-release formulations. The ability of polymers like guar gum, xanthan gum, karaya gum, and sodium alginate to create matrices and delay drug release has been thoroughly studied. To achieve the intended drug release profile, formulation variables must be carefully chosen and optimized. In order to methodically assess the impact of formulation factors and their interactions with fewer experimental trials, statistical experimental designs are frequently employed in pharmaceutical formulation research. Among these, factorial design is a useful optimization method that aids in comprehending how independent factors affect dependent responses.
A 2³ factorial design allows for the evaluation of both individual and interacting effects of formulation parameters on the features of the dosage form by evaluating three independent variables at two separate levels. By decreasing experimental error and cutting down on product development time and expenses, this design strategy improves formulation optimization.
In this study, natural polymers were used as release-retarding agents in the formulation and optimization of metoprolol succinate extended-release tablets. Hardness, friability, drug content, swelling index, and in vitro drug release were among the physicochemical criteria for which the formulations were produced and assessed. Using a 2³ factorial design, the impact of various natural polymer concentrations on drug release behavior was examined in order to produce an ideal formulation with desired extended-release properties.
MATERIALS AND METHODS
Materials used in this study were obtained from the different sources. Metoprolol Succinate was a gift sample from Aurobindo pharma Ltd, Hyderabad, India. HPMC, Di Calcium Phosphate and Micro Crystalline Cellulose were procured from Loba Chemie Pvt.Ltd, Mumbai. Other excipients such as Talc and magnesium stearate were procured from S.D. Fine Chem. Ltd., Mumbai.
Preparation of Metoprolol Succinate Tablets
The formula for MS tablets containing NG is shown in Table 1. Direct compression method was used for tablet manufacturing. Weighed quantities of MS, NG, HPMC and MCC were taken in a motar. They were subjected for blending by spatulation for 10min then talc in a weighed quantity was added and blending was continued for 5mins. The blend was evaluated for the bulk properties before compression. All the formulation of MN1 to MN8 was followed the same method. The blend was subjected for compression by eight station rotary compression machine at a force of 5 tons using circular biconvex 8mm punch for formulation MN1 to MN8, Each formulation was repeated in three batches.
Table 1: Formula for the Preparation of MN Tablets
|
Ingredients |
MN1 |
MN2 |
MN3 |
MN4 |
MN5 |
MN6 |
MN7 |
MN8 |
|
Metoprolol Succinate |
100 |
100 |
100 |
100 |
100 |
100 |
100 |
100 |
|
Neem Gum |
--- |
100 |
--- |
100 |
--- |
100 |
--- |
100 |
|
HPMC |
--- |
--- |
100 |
100 |
--- |
--- |
100 |
100 |
|
Guar gum |
--- |
--- |
--- |
--- |
100 |
100 |
100 |
100 |
|
MCC |
485 |
385 |
385 |
285 |
385 |
285 |
285 |
185 |
|
Mg sterate |
10 |
10 |
10 |
10 |
10 |
10 |
10 |
10 |
|
talc |
5 |
5 |
5 |
5 |
5 |
5 |
5 |
5 |
|
Total weight |
600 |
600 |
600 |
600 |
600 |
600 |
600 |
600 |
Pre compression blend properties
The formulation blends MN1 to MN8 was subjected for evaluation of bulk density, tapped density, Hausner’s ratio, compressibility index and angle of repose.
Post Compression Evaluation
Physical Characteristics: Physical characteristics of the tablet formulations can be determined by following
Thickness test: Vernier caliper was used to measure the thickness and average thickness along with the standard deviation (SD) was reported.
Hardness test
The tablet's hardness is designed to endure mechanical shocks. The hardness of the tablet was determined using a Monsanto hardness tester. kg/cm2.
Friability test
It is a percentage that is used to represent the tablets' degree of friability. Ten tablets were weighed and placed in a friabilator (W0). And it was set to 25 revolutions per minute for 4 minutes, or 100 revolutions. The tablet weights were reported at the end (W). To measure percent friability, the formula was used.
F = (1−W/W0) × 100.
F < 1% are considered as acceptable.
Weight Variation Test
10 tablets were chosen at random from each formulation and individually weighed to check for weight variance
Drug content
Ten tablets (MS) were taken, and average weight was noted. The tablets were powdered, and the sample of one tablet was weighed accurately. The powder was taken into a 100ml volumetric flask to that 25 ml of methanol and then 50 ml of distilled water was added and sonicated for 15 minutes. After equilibrium the samples were made up to the volume with distilled water. The solution was filtered through 0.45 μm filter paper. The drug content was determined by measuring the absorbance at 222 nm using UV-Visible spectrophotometer.
In vitro dissolution studies
In vitro dissolution studies of MS tablets were conducted for 20hrs using USP Dissolution apparatus II paddle 50rpm. The dissolution medium was 500mlpH 6.8 phosphate buffer and the temperature at 37±0.5 °C. The samples 5 ml of the dissolution media were withdrawn over a period of 20 hours and replaced with fresh buffer. The samples were analyzed for the amount of RV at different time intervals by measuring the absorbance at 222 nm using UV-Visible spectrophotometer.
Drug Release Modeling Kinetics
Zero and first order release models were used to determine drug release kinetics, while Higuchi, Hixon-Crowell, and Korsmeyer-Peppas models were used to determine mechanism.
Optimization by Factorial Design
Statistical Analysis
To study the effectiveness of the gum, drug (MS) release and to optimize the concentration of gum 23 factorial design was done by using Design of Experiment studies. The design was made by taking the gum at high, low and normal level. Design-Expert®13 software was used to create experiment design.A DOE with complete factorial configuration was used to optimize the formula for the concentration used in the formulation of NG, HPMC and GG, based on the preliminary feasibility report. The ingredients were collected, and the tablets were weighed according to the formula in Table no 2. Percentage drug (MS) release in 20hrs was identified and the range is based on the dissolution. Hence, the drug release at 20hrs was done by using USP apparatus II (paddle) at 50rpm with pH 6.8 phosphate buffer, 500ml was evaluated.
Table: 2 23 Full Factorial Design Layouts
|
Independent variable factor |
Variable levels |
levels |
levels |
|
NG |
Low (-) and High (+) |
0 |
8 |
|
HPMC |
Low (-) and High (+) |
0 |
8 |
|
GG |
Low (-) and High (+) |
0 |
8 |
RESULTS AND DISCUSSION
Pre-compression parameters of MS ER tablets
The pre-compression blend properties of formulations MS1 to MS8 are shown in Table 3. The bulk and tapped densities were found to be between 0.618 to 0.685 g/ml and 0.716 to 0.763 g/ml, respectively. The compressibility index and Hausner’s ratio values were 14.66-15.57 % and 1.11-1.19. The angles of repose values were found to be 25.45 -28.68°. These results indicated good bulk properties of the blend and the suitability of these blends for direct compression.
Table 3: Pre compression parameters
|
Sr. No. |
Formulation |
BD (gm/ml) |
TD (gm/ml) |
CI (%) |
HR |
AR (º) |
|
1 |
MS1 |
0.625 |
0.759 |
15.57 |
1.17 |
27.22 |
|
2 |
MS2 |
0.638 |
0.716 |
14.66 |
1.12 |
28.68 |
|
3 |
MS3 |
0.616 |
0.739 |
15.28 |
1.16 |
26.45 |
|
4 |
MS4 |
0.677 |
0.761 |
16.44 |
1.14 |
25.45 |
|
5 |
MS5 |
0.628 |
0.735 |
15.28 |
1.11 |
26.67 |
|
6 |
MS6 |
0.618 |
0.726 |
15.45 |
1.17 |
27.88 |
|
7 |
MS7 |
0.612 |
0.763 |
15.12 |
1.19 |
27.63 |
|
8 |
MS8 |
0.685 |
0.751 |
14.99 |
1.15 |
28.66 |
Physicochemical characteristics of MS ER tablets
MS tablets were prepared by using NG as a polymer at different drug to polymer ratios by direct compression method. The process could result good tablets without any defects. The physical parameters of tablets MS1 to MS8 were shown in Table 4. The average weight of different formulations was found to be in the range of 190 mg to 490 mg. The low standard deviation values indicated uniformity of tablets. The diameter, thickness was found to be 8 ± 0.1 mm from MS1- MS8 was found to be 10 ± 0.1 mm to and 3.2 mm to 3.9 mm in thickness. The hardness was found to be 4.0 to 5.6 kg/cm2. Friability is less than 1%. All these parameters are under the compendia requirements. The drug content of various formulations was found to range from 98.6± 0.4 percent w/w to 101.2 ± 0.2 percent w/w. The low standard deviation values mean that the drug content is uniform
Table 4: Physicochemical parameters
|
Formulation |
TK (mm) |
DM (mm) |
HD (kg/cm2 ) |
FD (%) |
AW (mg) |
DC (%w/w) |
|
MS1 |
3.2±0.1 |
8.4±0.2 |
4.0±0.1 |
0.659 |
600±0.2 |
98.6 ±0.6 |
|
MS2 |
3.4±0.4 |
8.9±0.5 |
5.1±0.4 |
0.626 |
599±0.4 |
99.1±0.4 |
|
MS3 |
3.6±0.6 |
8.4±0.4 |
4.8±0.5 |
0.569 |
601±0.6 |
100.2 ±0.5 |
|
MS4 |
3.9±0.1 |
10.2±0.3 |
5.6±0.1 |
0.663 |
600±0.8 |
102.2±0.8 |
|
MS5 |
3.7±0.2 |
10.6±0.1 |
4.9±0.6 |
0.579 |
601±0.1 |
99.5 ±0.6 |
|
MS6 |
3.8±0.5 |
10.2±0.2 |
5.2±0.2 |
0.563 |
598±0.2 |
101.2 ±0.8 |
|
MS7 |
3.7±0.3 |
9.2±0.7 |
5.3±0.7 |
0.632 |
599±0.7 |
98.2 ±0.3 |
|
MS8 |
3.5±0.1 |
9.2±0.4 |
5.5±0.9 |
0.681 |
601±0.9 |
99.2 ±0.1 |
In vitro dissolution studies:
For MS in vitro dissolution studies were conducted for 20hrs. The cumulative % drug release was calculated for formula MS1 to MS8 and shown in Figure 1. The prepared formulations containing different ratios of drug and NG exhibited gradual release of drug over a period of 20 hours. As the concentration of gum increases the drug release decrease (slow and graduate). Among all the formulation MS2 found to have accepted limits for dissolution 1hr (12.6), 4hr (30.4), 8hr (57.5) and 20hr (91.9) respectively. Hence the MS2 is considered to be optimized formulation. For comparison, commercial ER tablets (Toprol-XL) were studied for dissolution. The data also indicated the MS2 formulation is comparable with commercial formulation
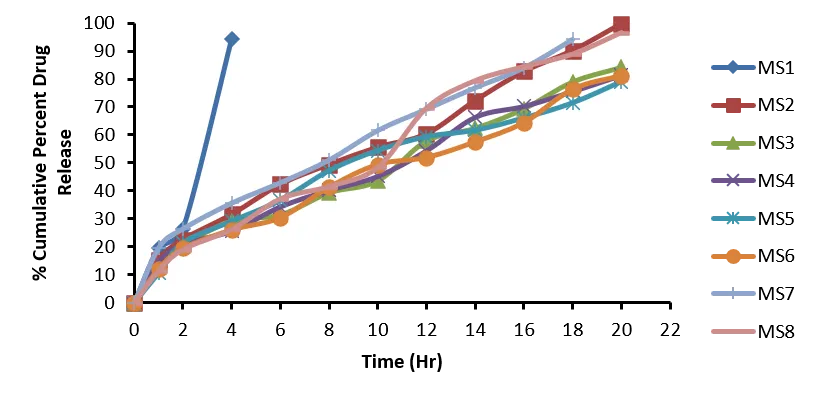
Figure 1: Dissolution profile of MS1 to MS8
Dissolution kinetics
The dissolution data were subjected from zero-order, First-order kinetics. The results for correlation coefficient (0.9142-0.9869) indicated the formulation MS1 to MS8 followed 1st order kinetics. The drug release mechanism was studied by plotting the cumulative percent drug release versus square root time and log time versus log percent drug release. The results suggested that the drug release follows diffusion mechanism and non-fickian represented in Table 5.
Table no 5: Dissolution kinetics of Metoprolol Succinate
|
Formulation |
Correlation coefficient (r) |
||||
|
Zero |
First |
Higuchi |
Erosion |
Peppas |
|
|
MS1 |
0.9313 |
0.962 |
0.9562 |
-0.756 |
0.9963 |
|
MS2 |
0.9439 |
0.952 |
0.9862 |
-0.632 |
0.9954 |
|
MS3 |
0.9562 |
0.985 |
0.9853 |
-0.521 |
0.9865 |
|
MS4 |
0.9687 |
0.956 |
0.9845 |
-0.985 |
0.9967 |
|
MS5 |
0.9523 |
0.964 |
0.9964 |
-0.865 |
0.9657 |
|
MS6 |
0.9856 |
0.996 |
0.9562 |
-0.964 |
0.9862 |
|
MS7 |
0.9351 |
0.985 |
0.9423 |
-0.981 |
0.9756 |
|
MS8 |
0.9628 |
0.997 |
0.9621 |
-0.967 |
0.9964 |
Statistical Analysis:
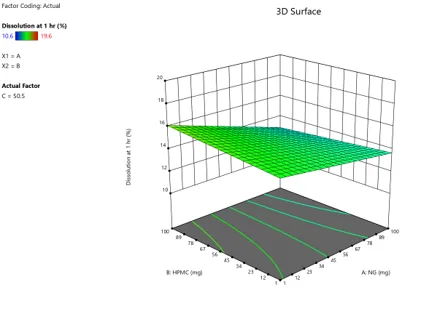
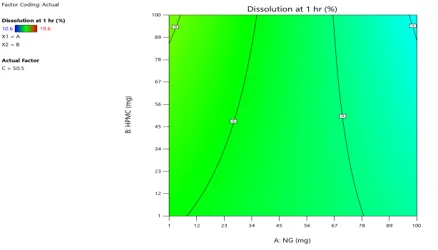
(a) Response Surface Plot (b) Contour Plot of Metoprolol Succinate Extended-Release Tablets. (Effect of Neem Gum and HPMC on percent dissolved in 1 hr)
The percent dissolved in 1 hr was directly proportional to the concentration of NG, which means that as the concentration of NG increases, the percent dissolved in 1 hr also decreases, according to the response surface plot and contour plots (Fig. 2 a and b). The percent dissolved in 1hr is also negatively impacted by the concentration of the other two polymers, an established nonlinear relationship between the concentrations of A & B and the percent dissolved in 1hr can be seen in the contour plots obtained for A and B.
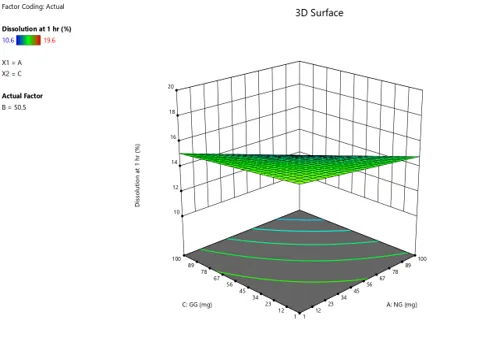
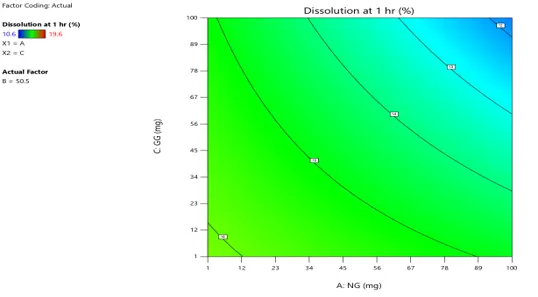
(a) Response Surface Plot (b) Contour Plot of Metoprolol Succinate Extended-Release Tablets. (Effect of Neem Gum and GG on percent dissolved in 1 hr)
The percent dissolved in 1 hr was directly proportional to the concentration of NG, which means that as the concentration of NG increases, the percent dissolved in 1 hr also decreases, according to the response surface plot and contour plots (Fig. 3 a and b). The percent dissolved in 1hr is also negatively impacted by the concentration of the other two polymers, an established nonlinear relationship between the concentrations of A & C and the percent dissolved in 1hr can be seen in the contour plots obtained for A and C.
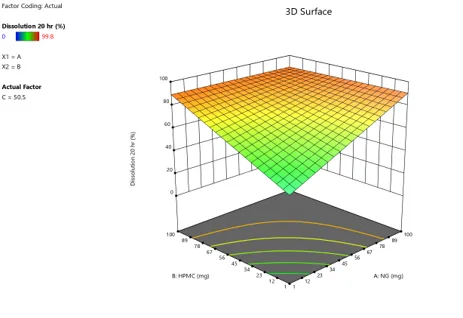
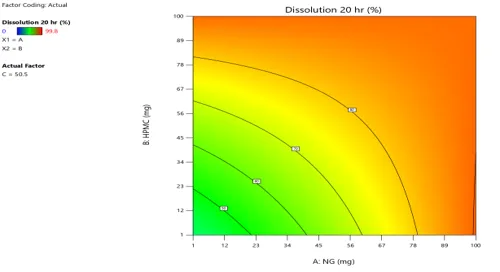
(a) Response Surface Plot (b) Contour Plot of Metoprolol Succinate Extended-Release Tablets. (Effect of Neem Gum and HPMC on percent dissolved in 20 hr)
The percent dissolved in 1 hr was directly proportional to the concentration of NG, which means that as the concentration of NG increases, the percent dissolved in 1 hr also increases, according to the response surface plot and contour plots (Fig. 4 a and b). The percent dissolved in 20 hr is also positively impacted by the concentration of the other two polymers, an established linear relationship between the concentrations of A & B and the percent dissolved in 20 hr can be seen in the contour plots obtained for A and B.
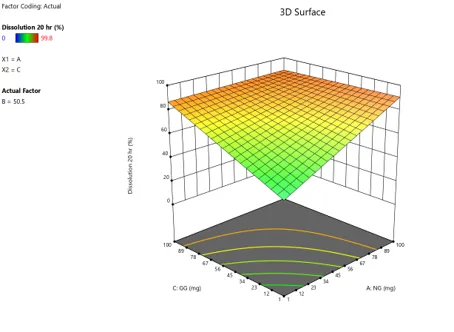
(a) Response Surface Plot (b) Contour Plot of Metoprolol Succinate Extended-Release Tablets. (Effect of Neem Gum and GG on percent dissolved in 20 hr)
The percent dissolved in 1 hr was directly proportional to the concentration of NG, which means that as the concentration of NG increases, the percent dissolved in 1 hr also increases, according to the response surface plot and contour plots (Fig. 5 a and b). The percent dissolved in 20 hr is also positively impacted by the concentration of the other two polymers, An established linear relationship between the concentrations of A & C and the percent dissolved in 20 hr can be seen in the contour plots obtained for A and C.
(a) Response Surface Plot (b) Contour Plot
Figure No 2 (a) Response Surface Plot (b) Contour Plot of Metoprolol Succinate Extended Release Tablets. (Effect of Neem Gum and HPLC on percent dissolved in 1 hr)
(a) Response Surface Plot (b) Contour Plot
Figure No 3 (a) Response Surface Plot (b) Contour Plot of Metoprolol Succinate Extended Release Tablets. (Effect of Neem Gum and GG on percent dissolved in 1 hr)
(a) Response Surface Plot (b) Contour Plot
Figure No 4 (a) Response Surface Plot (b) Contour Plot of Metoprolol Succinate Extended Release Tablets. (Effect of Neem Gum and HPMC on percent dissolved in 20 hr)

(a) Response Surface Plot (b) Contour Plot
Figure No 5 (a) Response Surface Plot (b) Contour Plot of Metoprolol Succinate Extended Release Tablets. (Effect of Neem Gum and GG on percent dissolved in 20 hr)
Optimum Formula:
The independent variables and their interaction effects on the responses were examined to determine the concentration level of the independent variable, or polymers, at which the best response was obtained. The polymers (NG, SSG, and GG ) A, B, and C as well as interactions between A, B, and C clearly showed negative effects on the percent dissolved in 1hr and 20hr of MS extended release tablets , whereas interactions between the AB, AC, and AC clearly demonstrated positive effects on these variables.
The formulation F6 showed greater percent dissolved in 1hr and 20 hr because it used 50% concentrations of NG and 50% concentrations of GG. In light of this, formulation F6 is regarded as the best MS extended formulation. The formulation F6 with two polymers is comparable to the formulation F2, which uses a novel natural polymer called Neem Gum in the concentration range of 50%. As a result, F2 was discovered to be more cost-effective with single novel polymers.
CONCLUSION
Natural gum as pharmaceutical aids in drug delivery has become an interest of research. The present study aims to develop tablets that show extended release by employing neem gum as matrix forming agent. The objective of the present work is on Neem gum as a pharmaceutical excipient in the design of extended release dosage forms for selected drugs such as Metoprolol Succinate,. The study showed that NG can be purified to use it as pharmaceutical excipient. The tablets prepared by using NG were found to be good and meet all the compendial requirements. The concentration of NG contributed a crucial role in drug release. The obtained results of the study specify that the NG could be employed as a matrix forming agent for the preparation of extended release tablets.
REFERENCES


Mallampalli Rani, Shabana Parveen, Chandra Sekhar Naik, Formulation and Optimization of Metoprolol Succinate Extended-Release Tablets using Natural Polymers Employing 2³ Factorial Design, Int. J. of Pharm. Sci., 2026, Vol 4, Issue 6, 3122-3131. https://doi.org/10.5281/zenodo.20661174
 10.5281/zenodo.20661174