

We use cookies to ensure our website works properly and to personalise your experience. Cookies policy
Department of Quality Assurance, Vidyabharati College of Pharmacy, Sant Gadge Baba Amravati University, Amravati 444602, Maharashtra, India.
An antifungal cubosomal delivery system was developed and assessed using experimental and computational approaches. Cubosomes prepared with glyceryl monooleate and poloxamer 407 were characterized, and FTIR analysis confirmed compatibility without notable spectral shifts. Molecular docking indicated favorable binding of the drug with the selected fungal target. A UV spectrophotometric method was validated over a concentration range of 2–10 µg/mL, demonstrating acceptable linearity, precision, and sensitivity. The findings support the applicability of the formulation and analytical method for antifungal studies
Fungal infections continue to pose a therapeutic challenge, particularly in patients with compromised immune systems. Although several antifungal agents are available, their clinical performance is often limited by poor aqueous solubility, erratic absorption, and systemic adverse effects. Posaconazole, a second-generation triazole antifungal agent, is widely used for the treatment of invasive fungal infections; however, its low solubility restricts its bioavailability and therapeutic efficiency(1).
In recent years, nanostructured lipid systems have gained considerable attention as carriers for poorly soluble drugs. Cubosomes are discrete nanovesicles that are bi-continuous cubic phase liquid crystals made of water and biodegradable lipid. They have exceptional biocompatibility and bio-adhesive qualities, as well as the capacity to solubilize and encapsulate hydrophilic, hydrophobic, and amphiphilic molecules(2,3).
In addition to their skin penetration-enhancing qualities, cubosomes are thought to be an excellent option for skin transport due to their resemblance to human skin layers, which has led to an increase in interest in topical therapies. Along with their high interior surface, they also have small pores, which makes them perfect for controlled release, medication payloads, thermal stability, and skin-moisturizing capacity(4,5).
Cubosomes generally has been incorporated for topical administration i.e. penetration through skin via stratum corneum for antifungal activity. Because it avoids the medication's first pass metabolism and minimizes toxicity and dose-related side effects, the topical route of drug delivery is more compliant than other routes. The process of administration is reversible. The majority of vesicular drugs are ethosomes rather than transferosomes. Due to their weak skin, delivery devices are less appropriate for percutaneous distribution, permeability, vesicle disintegration, drug leakage, aggregation, and vesicle fusion. A novel kind of carrier system known as "cubosomes" can be used to solve issues. Based on these consideration the present study aims to formulate and evaluate a cubosomes based drug delivery system for antifungal therapy(6).
MATERIALS:
Posaconazole was selected as model antifungal agent. Glyceryl Monooleate (GMO) was gifted by Mohini Organics Pvt. Ltd. Mumbai which was used by emulsifier. Poloxamer 407 or Pluronics F 127 was purchased from Vishal Chem Pvt. Ltd. which was used as polymeric stabilizer. Polyvinyl alcohol was used as emulsifier stabilizer and distilled water.
PREPARATION OF CUBOSOMES DISPERSION:
Cubosomes were prepared using the top-down method (Emulsification method). A precisely measured amount of glyceryl monooleate (GMO) and different ratios of pluronic F127 were combined and melted at 60˚C in a water bath until Pluronic F127 dissolves entirely in GMO. To the solution mentioned above adding drug Posaconazole, thoroughly mix it in. Distilled water was gradually heated to 60˚C and added drop by drop in the proper amount to the resulting clear lipid solution by continuous stirring. Following the full addition of lipid phase, it was set aside for a day in order to equilibrium. A two-phase formation occurred system, and stirring upset it. The whole The system was homogenized at 1200 rpm. for one and half hours. The ready Dispersions were kept at room temperature in sealed glass vials. That is protected from the sun and later a evaluation was done. The outcome was a white opaque dispersion in the absence of any aggregates.
Table 1 Composition of Cubosomes formulations
|
Formulations |
Glyceryl monooleate (%w/w) |
Pluronics F 127 (%w/w) |
Polyvinyl alcohol (%w/w) |
|
F1 |
4.80 |
0.20 |
- |
|
F2 |
4.25 |
0.50 |
- |
|
F3 |
4.5 |
0.25 |
- |
|
F4 |
4.25 |
0.50 |
2.5 |
|
F5 |
4.5 |
0.50 |
2.5 |
|
F6 |
4.25 |
0.25 |
2 |
|
F7 |
4.80 |
0.20 |
2.5 |
|
F8 |
4.80 |
0.20 |
2 |
|
F9 |
4.5 |
0.25 |
2 |
Note: Posaconazole was used in concentration of 0.35%w/w
EVALUATION OF CUBOSOMES:
Scanning electron microscopy (SEM)
The morphology of cubosomes was examined using scanning electron microscopy (SEM). The optimized posaconazole cubosome dispersion's shape and surface morphology were examined by SEM (FEI, Tecnai 12, Eindhoven, Netherlands). Using tungsten filament as a source and the program Tecnai Imaging and Analysis (Hillsboro, OR), 50 mg posaconazole cubosome of lyophilized was utilized at a magnification range of 20x to 3.5 lakhs x, resolution: 0.5nm, and high voltage − 120Kv(7).
Partical size and polydispersity index and zeta potential
Using SZ-100 equipment from HORIBA Ltd. (Tokyo, Japan), dynamic light scattering was used to measure the average particle size and PDI of the cubosomes at a temperature of 25°C and a scattering angle of 90°. To prevent multi-scattering occurrences, batches were diluted with filtered double-distilled water at a concentration of 10% prior to measurement until the proper particle concentration was reached. To evaluate the homogeneity of the particle size distribution, the PDI was examined. Additionally, a zeta potential analyzer more precisely, the SZ-100 from HORIBA Ltd. (Tokyo, Japan) was used to detect the surface charge(8).
Fourier Transform Infrared Spectroscopy (FT-IR)
FTIR spectra of the optimized posaconazole cubosomes, pure medication, and excipients are obtained and examined for potential incompatibilities(9).
Entrapment efficiency (EE) and drug loading
The centrifugation method was used to calculate posaconazole cubosomes percentage entrapment efficiency (%EE). A cooling centrifuge (REMI-C24 BL, Remi Elektrotechnik Ltd., Thane, India) was used to centrifuge a 2 mL sample of the formulation with 5 mL of methanol for an hour at 12,000 rpm. Using a UV-visible spectrophotometer (V-1800, Shimadzu, Japan), the supernatant (1 mL) was diluted to 10 mL with methanol and measured at 259 nm. Conventional equations were used as follow as to compute the %EE and drug loading10,11:
% EE = (Amount of drug added – Amount of free drug)/ Amount of drug added x 100 (1)
% DL = (Amount of drug added – Amount of free drug)/ Amount of lipid added x 100 (2)
In vitro release of posaconazole from cubosomes
Phosphate buffer (pH 7.2) was used to assess the in vitro drug release from posaconazole loaded cubosomes. A dialysis bag (12–14 kDa) containing 100 mg of the freeze-dried formulation was submerged in 900 mL of medium that was kept at 37 ± 0.5 °C while being stirred at 50 rpm. 2 mL samples were taken out at prearranged intervals up to 12 hours, replaced with fresh media, filtered via a 0.22 µm membrane, and spectrophotometrically measured at 259 nm(8,12).
Release kinetic study
To clarify the release process, the drug release data from posaconazole loaded cubosomes were examined using a variety of kinetic models, such as zero-order, first-order, Higuchi, and Korsmeyer–Peppas equations. The model with the highest correlation coefficient (R²), which indicated the formulation's main release kinetics, was deemed to be the best fit.
MOLECULAR DOCKING
The mechanism of action, binding affinity, binding style, and molecular interactions of the selected drugs were investigated using molecular docking utilizing Schrodinger and Maestro Glide. All compounds were constructed using Maestro build panels, and they were optimized for reduced energy conformers using Ligand preparation (Schrodinger, LLC). With the help of protein preparation experts, the protein X-ray crystal structure (PDB ID:5V5Z) was obtained from the protein data bank and prepared for docking. Grids were then minimized and refined around the structures using the default box size and centered on the ligand. All selected compounds underwent final docking tests utilizing the extra-precision (XP) docking mode on a constructed protein structure grid(18).
Ligand and protein preparation
All target proteins and investigated ligands have to be prepared in order to meet the minimal requirements for further computational computations. The LigPrep tool, which interfaced with the Maestro module of the Schrodinger suite, was used for ligand preparation. 3D structures with all possible tautomers and ionization states at pH 7.0 ± 2.0 of all ligands and reference compounds were constructed and geometrically reduced using the optimal potential liquid simulations (OPLS3e) force field. Schrodinger's multi-step Protein Preparation Wizard was used for protein preparations. First, high-resolution protein crystal structures of the enzyme (PDB ID:5V5Z) complexed with the native ligand fluconazole were looked for in the RCSB Protein Data Bank. Heavy atoms were provided hydrogen after charges and bond ordering were assigned, and all heteroatoms and water molecules were removed while native ligands and metals remained in the active site. The resulting structures were optimized and subsequently reduced using the OPLS3e force field to avoid steric conflicts between atoms.
ANALYTICAL METHOD VALIDATION:
The process of establishing through laboratory investigations that an analytical procedure's performance characteristics satisfy the requirements for its intended usage is known as validation. The planned and methodical gathering of validation data by the applicant to support analytical procedures is the first step in the techniques validation process for analytical processes. Every analytical technique that is meant to be applied to the analysis of clinical samples must be verified. According to ICH requirements, analytical methods are validated(13).
Selection of wavelength for analysis of Posaconazole
In order to ascertain the wavelength of maximum absorption of posaconazole, the stock solution of 1000 μg/ml was prepared by taking 5mg of the drug in 5ml of methanol. From this stock solution, the concentration of the drug (10μg/ml) in methanol was prepared and scanned using spectrophotometer within the wavelength range of 200 to 400nm against methanol as blank.
Preparation of standard stock solution
A stock solution was created by dissolving 1 milligram of posaconazole in 10 ml of methanol. Using methanol, appropriate dilutions ranging from 2 to 10μg/ml were used to generate various aliquots of concentration from this standard stock solution (10μg/ml). At 265 nm, the absorbance of the subsequent concentration was measured. The drug's (posaconazole) calibration curve was created using the data.
The UV-VIS Spectrophotometric method was validated according to the International Conference on Harmonization (ICH) guidelines (2005). The following characteristics were considered for validation: linearity, precision, accuracy, limit of detection (LOD) and limit of quantification (LOQ).
Linearity
The ability of an analytical process to demonstrate the rationale that the observed absorbance is proportionate to the concentration of a sample containing the analyte is known as linearity. Five distinct concentrations (2μg/ml, 4µg/ml, 6µg/ml, 8µg/ml, and 10µg/ml) were tested on three separate days at 265 nm to establish the linearity(14,15).
Precision
Repeatability (inter-day) and intermediate precision (intra-day) studies were used to assess the method's precision. Three same concentrations (6µg/ml) were taken across two days, and the percent relative standard deviation (%RSD) was computed to determine inter-day precision. The same samples were examined two times during the day for intra-day precision, and the percentage RSD was also computed(15,16).
Accuracy
The degree of agreement between the values that are recognized as a conventional true value and the value discovered is a measure of an analytical technique's accuracy. The accuracy tests were performed in triplicate at three distinct concentrations (4.4µg/ml, 6µg/ml, and 8.4µg/ml) made from the stock solution, and the standard curve was used to assess their strengths(15,16).
Limit of detection ( LOD)
The detection limit of an analytical method is defined as the lowest amount of analyte present in a sample that can be detected but not necessarily quantitated as an exact value15. The limit of detection was performed from the standard curve.
LOD = 3.3 S/M
Where, S is the standard deviation of the absorbance of the sample and M is the Slope of the calibration curve.
Limit of quantification (LOQ)
Limit of Quantification (LOQ) can be defined as the lowest amount of analyte present in a sample that can be quantitatively determined with suitable precision and accuracy15. Limit of quantification was based on the standard deviation of the response and the slope of the corresponding curve using the following equation:
LOD = 10 S/M
Where S is the standard deviation of the absorbance of the sample and M is the Slope of the calibration curve(17).
Robustness
The robustness of an analytical procedure is the measure of its capacity to remain unaffected by small, but deliberate, variations in method parameters and provides an indication of its reliability during normal usage.
Ruggedness
The (intra-laboratory tested) behavior of an analytical process when small changes in the environmental and/or operating conditions are made (generally used term).
RESULT:
Scanning electron microscopy (SEM)
The morphology of cubosomes was examined using scanning electron microscopy (SEM). The optimized posaconazole cubosome dispersion's shape and surface morphology were smooth and devoid cracks giving them good appearance. The SEM data obtained on the drug loaded cubosomes are showed figure1.
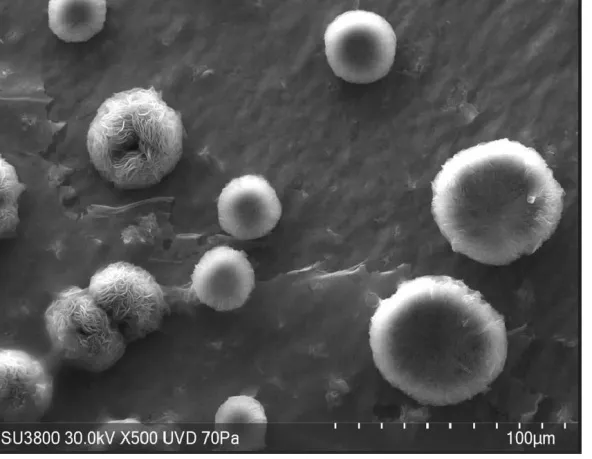
Figure 1 SEM image of prepared drug loaded cubosome dispersion
Partical size and polydispersity index and zeta potential
The particle size and polydispersity index of drug loaded cubosomes dispersion has examined by the dynamic light scattering the particle size was obtained 126.4 nm and the polydispersity index (PDI) was 0.546 and it was shown in figure 2. Zeta potential was analyzed and obtained a surface charge -37.2Mv and electrophoretic mobility was -0.000288 cm/Vs as shown in figure 3
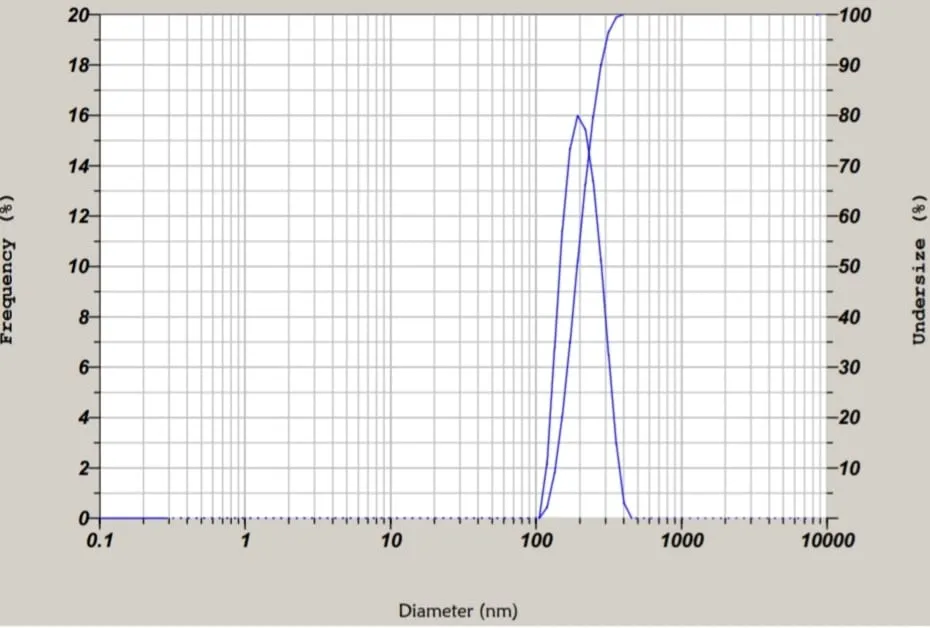
Figure 2 Particle size and polydispersity index
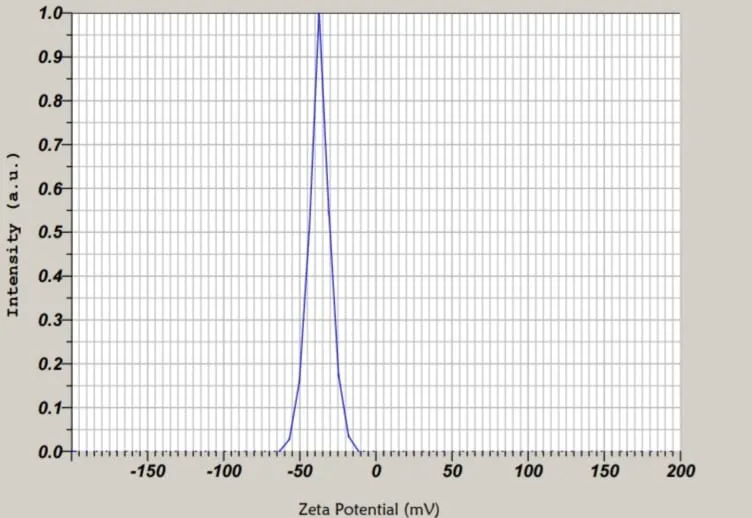
Figure 3 Zeta potential
Fourier Transform Infrared Spectroscopy (FT-IR)
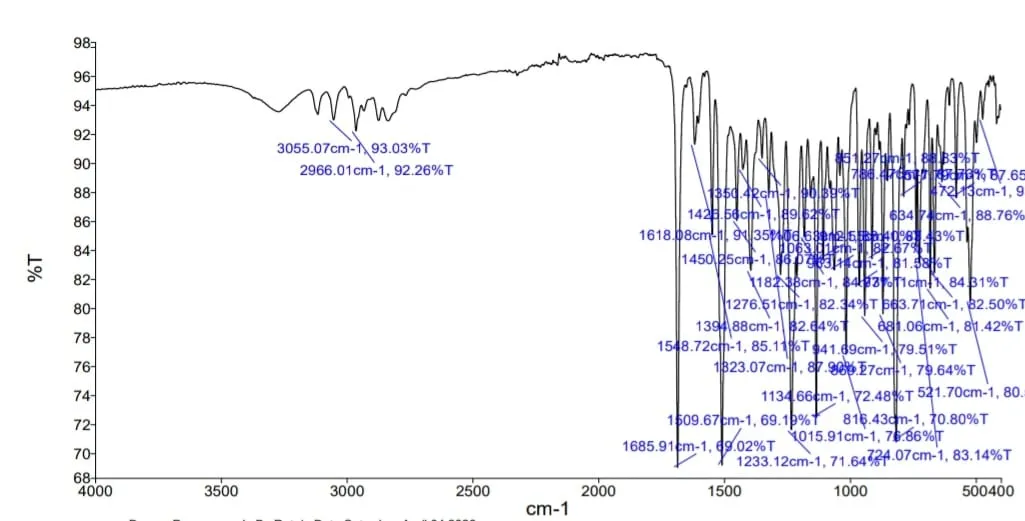
Figure 4 FTIR spectra of drug
|
Sr.no |
Wavenumber |
Functional group |
Interpretation |
|
1 |
3055.07 |
Aromatic stretching C-H |
Presence of aromatic ring |
|
2 |
2966.01 |
Aliphatic stretching C-H |
Alkyl chain formation
|
|
3 |
1685.91 |
C=O stretching |
Carbonyl group(azoles ring) |
|
4 |
1618.08 |
C=C stretching |
Aromatic ring vibration |
|
5 |
1548.72 |
C=N stretching |
Imidazole ring |
|
6 |
1426.56 |
C-H Bending |
Hydrocarbon chain |
|
7 |
1394.88 |
O-H bending |
Hydroxy group |
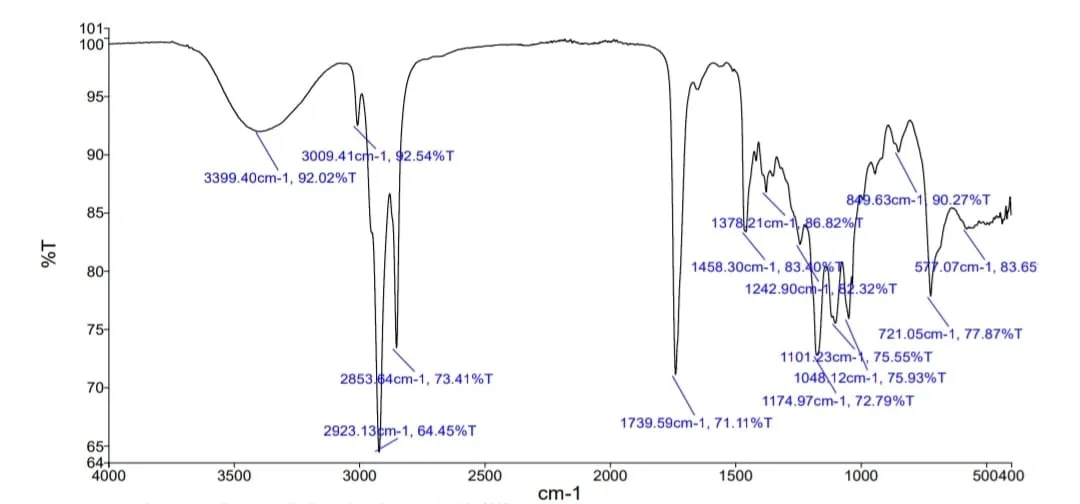
Figure 5 FTIR spectra of cubosomes
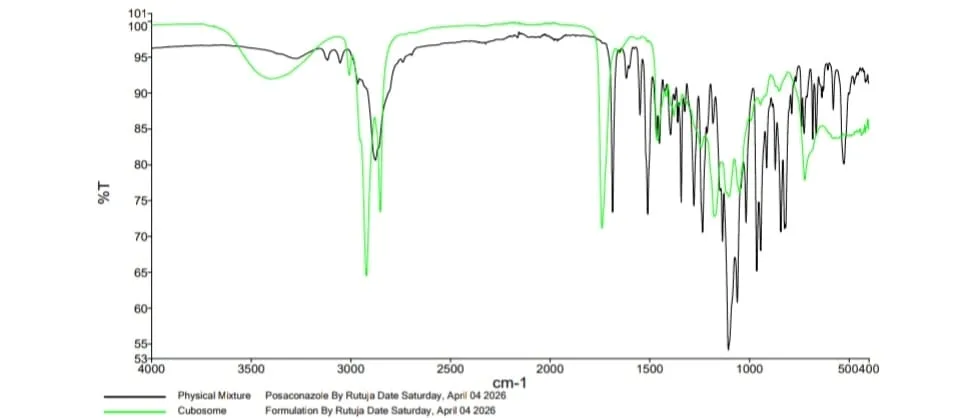
Figure 6 Overlay of physical mixture of drug and cubosomes
Table 2 Analysis of overlay spectra
|
Sr.no |
Wavenumber |
Interpretation |
Interpretation |
|
1 |
3399 |
Hydroxyl group |
Hydroxyl group Aromatic (Drug/Poloxamer 407) |
|
2 |
3009 |
=C-H stretching |
Unsaturated group (Drug) |
|
3 |
2923,2853 |
C-H stretching |
Lipid alkyl chain (GMO) |
|
4 |
1739 |
C=O STRECHTING |
Ester group (GMO) |
|
5 |
1101-1048 |
C-O-C stretching |
Polyether chain (Poloxamer 407) |
|
6 |
849 |
Aromatic C-H stretching |
Drug structure |
The FTIR spectrum of the cubosome nanoparticles showed characteristic peaks corresponding to both the drug and excipients. A broad peak at 3399 cm⁻¹ indicates O–H stretching, suggesting the presence of hydroxyl groups. The peaks observed at 2923 cm⁻¹ and 2853 cm⁻¹ correspond to C–H stretching vibrations of long alkyl chains, confirming the presence of lipid (glyceryl monooleate).
The absence of significant peak shifts or new peak formation indicates that there is no chemical interaction between the drug and excipients. Therefore, the drug is compatible with the cubosome components, and the formulation is stable.
Entrapment efficiency (EE) and drug loading
The optimization of posaconazole cubosomes batches was evaluated based on percentage entrapment efficiency (%EE), which is a critical parameter indicating the drug-loading capacity of the formulation. Among all the batches (F1–F9), %EE values ranged from 80.3% to 92.3%, demonstrating efficient drug encapsulation across formulations. Notably, formulation F5 exhibited the highest entrapment efficiency of 92.3 ± 0.16%, indicating superior drug incorporation and optimal formulation characteristics. Batches F6 and F7 also showed relatively high %EE values of 90.3 ± 0.21% and 90.1 ± 0.05%, respectively, whereas F3 (87.6 ± 0.04%) and F2 (86.3 ± 0.37%) demonstrated moderate entrapment. In contrast, lower %EE was observed in F4 (82.3 ± 0.28%) and F9 (80.3 ± 0.16%), suggesting less efficient drug incorporation, possibly due to suboptimal composition or processing conditions. The consistently low standard deviation values across all batches indicate good reproducibility and reliability of the formulation process. Overall, F5 was identified as the optimized batch owing to its highest entrapment efficiency, which may contribute to improved drug stability and sustained release behaviour
Table 2 Optimization of Posaconazole cubosomes batches
|
Batches |
%EE |
%Drug loading |
|
F1 |
85.6 ± 0.24 |
15.6 ± 0.02 |
|
F2 |
86.3±0.37 |
14.2 ± 0.14 |
|
F3 |
87.6±0.04 |
13.1 ± 0.54 |
|
F4 |
82.3±0.28 |
16.6 ± 0.13 |
|
F5 |
92.3±0.16 |
17.1 ± 0.04 |
|
F6 |
90.3±0.21 |
14.6 ± 0.25 |
|
F7 |
90.1±0.05 |
12.2 ± 0.53 |
|
F8 |
89.6±0.17 |
11.2 ± 0.22 |
|
F9 |
80.3±0.16 |
12.6 ± 0.25 |
.
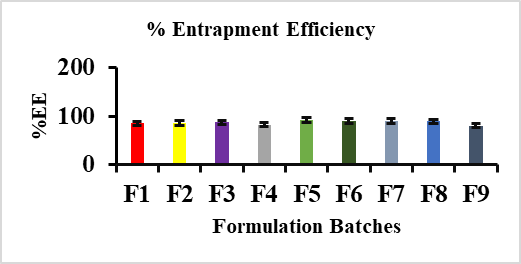
Figure 7 %Entrapment efficiency of drug loaded cubosomes
In vitro release of posaconazole from cubosomes
The in vitro drug release study of formulations F0–F9 demonstrated a significant enhancement in drug release from formulated batches compared to the plain drug (F0), which showed only 36.32% release at 24 hours, indicating poor dissolution behavior. All developed formulations exhibited improved release profiles, among which formulation F5 showed the most optimized and controlled release pattern, with 8.57% drug release at 1 hour, gradually increasing to 63.62% at 4 hours, 90.23% at 12 hours, and reaching 101.36% at 24 hours. This indicates a desirable sustained release profile with minimal initial burst effect and consistent drug diffusion over time. In comparison, formulations F1–F4 showed relatively less controlled release, while F6–F9 exhibited slightly higher drug release (>102–106%), suggesting faster drug diffusion or weaker matrix integrity. The release behavior of F5 suggests a combined diffusion and erosion-controlled mechanism (non-Fickian transport), which is ideal for sustained drug delivery. The data, expressed as mean ± standard deviation, showed low variability, confirming the reliability and reproducibility of the results. Overall, formulation F5 was identified as the optimized batch due to its balanced initial release, sustained drug delivery, and near-complete drug release over 24 hours, making it a promising candidate for controlled release applications.
Table 3 In vitro release profile of all Posaconazole Cubosomes optimized formulation over 24 hours
|
Time(hour) |
1 |
2 |
3 |
4 |
5 |
8 |
12 |
24 |
|
Plain drug F0 |
2.56± 0.21 |
4.82± 0.31 |
9.26± 0.34 |
16.44± 0.14 |
22.18± 0.12 |
27.46± 0.02 |
30.21± 0.25 |
36.32± 0.15 |
|
F1 |
6.8± 0.35 |
12.56± 0.78 |
27.58± 0.21 |
59.12± 0.24 |
64.45± 0.25 |
74.92± 0.05 |
84.2± 0.12 |
92.36± 0.23 |
|
F2 |
9.22± 0.68 |
15.53± 0.22 |
31.6± 0.54 |
62.14± 0.35 |
68.2± 0.23 |
78.4± 0.56 |
85.36± 0.36 |
93.21± 0.52 |
|
F3 |
8.44± 0.78 |
16.24± 0.28 |
30.46± 0.56 |
62.18± 0.34 |
70.1± 0.56 |
79.55± 0.45 |
86.37± 0.15 |
94.56± 0.25 |
|
F4 |
7.42± 0.15 |
16.23± 0.36 |
28.5± 0.57 |
61.18± 0.02 |
72.47± 0.74 |
80.56± 0.25 |
89.42± 0.25 |
96.36± 0.29 |
|
F5 |
8.57± 0.43 |
19.48± 0.23 |
35.88± 0.23 |
63.62± 0.05 |
72.5± 0.56 |
81.54± 0.56 |
90.23± 0.29 |
101.36±0.30 |
|
F6 |
8.46± 0.45 |
18.32± 0.01 |
38.36± 0.25 |
64.16± 0.23 |
74.2± 0.57 |
83.33± 0.34 |
91.2± 0.58 |
102.37±0.51 |
|
F7 |
8.7± 0.98 |
18.18± 0.56 |
26.49± 0.15 |
65.25± 0.25 |
75.88± 0.54 |
83.68± 0.25 |
91.36± 0.25 |
102.31±0.58 |
|
F8 |
10.6± 1.23 |
22.24± 0.78 |
38.54± 0.02 |
57.3± 0.56 |
74.6± 0.02 |
85.7± 0.51 |
91.68± 0.12 |
103.36±0.45 |
|
F9 |
11.74± 0.36 |
26.2± 0.85 |
38.94± 0.01 |
63.7± 0.12 |
80.8± 0.45 |
90.65± 0.25 |
100.25± 0.13 |
106.3±0.36 |
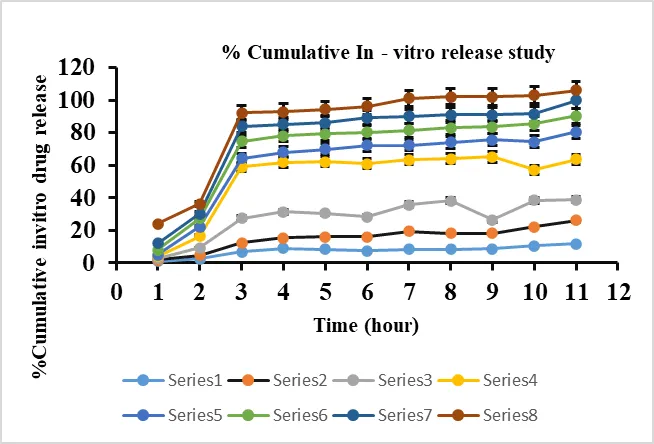
Figure 8 %Cumulative in vitro drug release study
Release kinetic study
All the formulation batches were analyzed for the release kinetic model. Drug release data from all formulations were fitted to various kinetic models, and correlation coefficients (R²) are summarized. The Korsmeyer–Peppas (R² = 0.961–0.976) and Higuchi (R² = 0.905–0.970) models showed the best fit, indicating a primarily diffusion-controlled mechanism. The first-order model (R² = 0.853–0.952) suggested concentration-dependent release, while the zero-order and Hixson–Crowell models showed poor correlation. Formulations P3, P4, and P7 demonstrated superior kinetic profiles. Thus, it confirms their suitability for sustained-release performance (Table 6).
Table 4 Posaconazole cubosomes formulation batches were analyzed for the release kinetic model
|
Release kinetics |
F0 |
F1 |
F2 |
F3 |
F4 |
F5 |
F6 |
F7 |
F8 |
F9 |
|
First Order |
0.885 |
0.853 |
0.861 |
0.869 |
0.878 |
0.873 |
0.884 |
0.876 |
0.946 |
0.952 |
|
Korsemeyer Peppas |
0.962 |
0.973 |
0.972 |
0.974 |
0.976 |
0.966 |
0.967 |
0.975 |
0.966 |
0.961 |
|
Zero Order |
0.859 |
0.751 |
0.743 |
0.750 |
0.761 |
0.737 |
0.737 |
0.753 |
0.791 |
0.775 |
|
Higuchi Model |
0.970 |
0.905 |
0.909 |
0.912 |
0.916 |
0.913 |
0.913 |
0.907 |
0.953 |
0.945 |
|
Hixon crowel Model |
0.876 |
0.818 |
0.822 |
0.829 |
0.839 |
0.829 |
0.837 |
0.834 |
0.901 |
0.901 |
Molecular docking studies
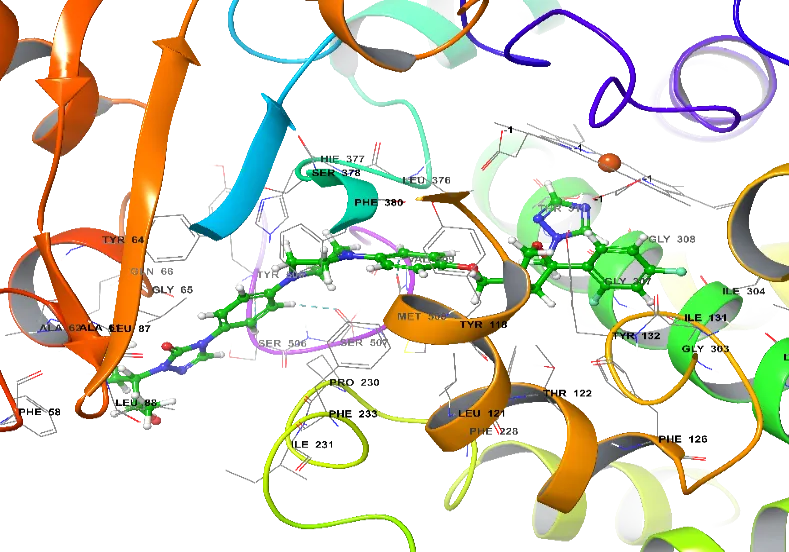
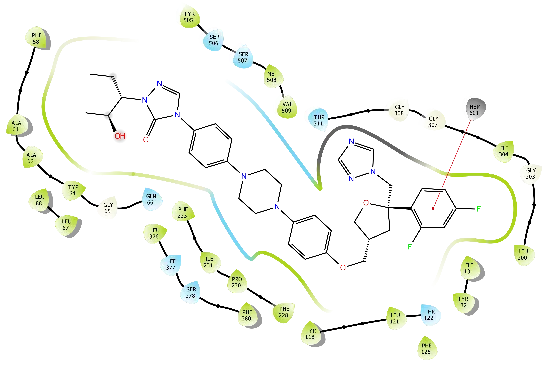
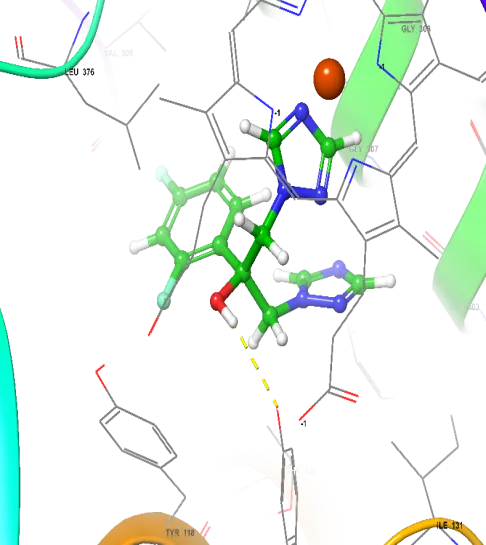
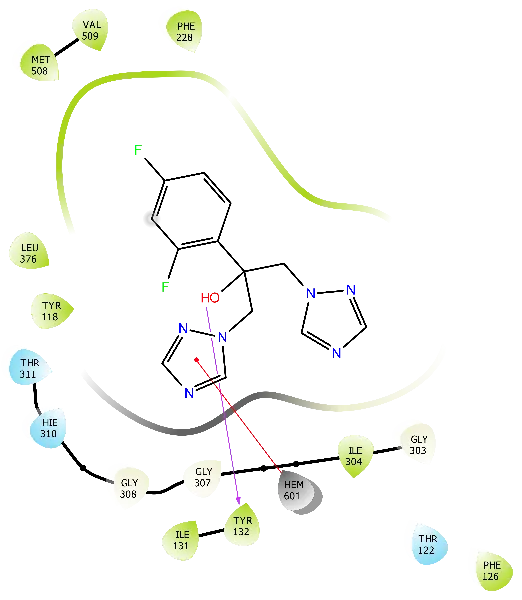
To identify the primary pharmacophores in charge of the antifungal activities, molecular docking studies were carried out. This study looked at how ligand posaconazole interacted with the corresponding protein targets 5V5Z. In comparison to the standard fluconazole, as indicated in Table 1, the molecular docking analysis of compound posaconazole showed good docking scores and remarkable interactions with the essential amino acid residues located within the receptor's binding pocket of 5V5Z. In comparison to fluconazole, posaconazole exhibit good scores as well as good binding patterns. Posaconazole exhibits the highest docking score of -11.952kcal mol−1 across all molecules, and it binds with the residues HEM601 pi-pi cation bond, it hydrophobically interacts with amino acid residues as TYR505, MET508, VAL509, ILE304, LEU300, ILE131, TYR132, LEU121, TYR118, PHE228, PRO230, ILE231, PHE233, TYR64, ALA62, ALA61 and PHE58 as indicated in fig.1(A) as compered by fluconazole which show comparable low docking score -4.607kcal mol−1 and binds with TYR132by hydrogen bonding and HEM601 as pi-pi cation. It hydrophobically interacts with amino acid residues is TYR118, ILE131, LEU376, PHE228, VAL509, MET508, ILE304 as indicated in fig 1(B).
|
|
(A) |
|
|
|
Figure 9 Docked images of the (A) Posaconazole and standard (B) fluconazole in a 2D and 3D interacting diagram for in protein (PDB ID: 5V5Z).
Table 5 Docking study of the compound Posaconazole and standard fluconazole (PDB ID:5V5Z).
|
Compound Code |
Structure |
PDB ID:5V5Z |
||||
|
G- Score |
Binding Energy |
Residue |
||||
|
Hydrogen bond |
Pi-pi cation |
Hydrophobic interactions |
||||
|
Posaconazole |
|
-11.952 |
-147.144 |
- |
HEM601 |
MET508 VAL509 ILE304 LEU300 ILE131 TYR132 LEU121 TYR118 PHE228 PRO230 ILE231 PHE233 TYR64 ALA62 ALA61 PHE58 |
|
Fluconazole |
|
-4.607 |
-55.218 |
TYR132 |
HEM601 |
TYR118 ILE131 LEU376 PHE228 VAL509 MET508 ILE304 |
Linearity:
Five points standardization curve was obtained in a concentration range from 2 and 10μg/ml for Posaconazole. The response of the drug was found to be linear within the investigation concentration range and the linear regression equation was y = 0.034x with correlation coefficient 0.999. (Table 7, Figure 10).
Table 6 Conc vs abs linearity study of posaconazole
|
Concentartion (μg/ml) |
Absorbance |
|
2 |
0.08 |
|
4 |
0.15 |
|
6 |
0.22 |
|
8 |
0.29 |
|
10 |
0.35 |
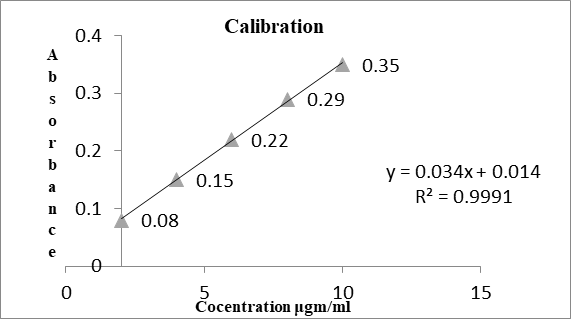
Figure 10 Calibration curve of posaconazole
Accuracy:
The accuracy of the developed method was evaluated using the standard addition method at three levels (80%, 100%, and 120%). The percentage recovery values ranged from 98.86% to 100.91%. The mean recoveries were found to be 100.00%, 100.17%, and 99.64% for 80%, 100%, and 120% levels, respectively. The %RSD values were below 2%, indicating that the method is accurate and reliable.
Table 7 Accuracy
|
% Level |
Conc.(μg/ml) |
Absorbance |
Conc. Found (μg/ml) |
% Recovery |
%RSD |
|||
|
80% |
4.4 |
0.162 |
4.35 |
98.65 |
- |
|||
|
80% |
4.4 |
0.165 |
4.44 |
100.91 |
- |
|||
|
80% |
4.4 |
0.164 |
4.41 |
100.23 |
1.02 |
|||
|
100% |
6.0 |
0.217 |
5.97 |
99.50 |
- |
|||
|
100% |
6.0 |
0.220 |
6.06 |
101.00 |
- |
|||
|
100% |
6.0 |
0.218 |
6.00 |
100.00 |
0.76 |
|||
|
120% |
8.4 |
0.297 |
8.32 |
99.05 |
- |
|||
|
120% |
8.4 |
0.300 |
8.41 |
100.12 |
- |
|||
|
120% |
8.4 |
0.299 |
8.38 |
99.76 |
0.54 |
|||
Precision:
The repeatability (inter-day) and intermediate precision (intra-day) precision studies (Table 9 and Table 10) of the developed method confirmed that the method is precise and reliable where all the RSD values were ˂2%.
Table 8 Interday precision
|
Day |
Concentration (μg/ml) |
Absorbance |
|
|
Day1 |
6 |
0.217 |
|
|
Day1 |
6 |
0.219 |
|
|
Day2 |
6 |
0.220 |
|
|
Day2 |
6 |
0.218 |
|
|
Overall mean |
- |
0.2185 |
|
|
S. D |
- |
0.00129 |
|
|
% RSD |
- |
0.59% |
|
Table 9 Intraday precision
|
Time |
Concentration (μg/ml) |
Absorbance |
|
|
Morning 1 |
6 |
0.217. |
|
|
Morning 2 |
6 |
0.218 |
|
|
Afternoon 1 |
6 |
0.220 |
|
|
Afternoon 2 |
6 |
0.221 |
|
|
Overall mean |
- |
0.219 |
|
|
S. D |
- |
0.00183 |
|
|
%RSD |
- |
0.84% |
|
LOD and LOQ:
The detection and quantitation limits as LOD and LOQ were calculated according to the formulae mentioned above. From the calculation, the LOD and LOQ values were found to be 0.143 (μg/ml) and 0.432 (μg/ml) respectively.
Robustness:
Table 10 Study of robustness
|
Condition |
Wavelength (nm) |
Absorbance |
|
Variation 1 |
258 |
0.216 |
|
Nominal |
260 |
0.218 |
|
Variation 2 |
262 |
0.219 |
|
Mean |
- |
0.2177 |
|
S. D |
- |
0.00153 |
|
%RSD |
- |
0.70% |
Ruggedness:
Table 11 Study of ruggedness
|
Analyst |
Concentration (μg/ml) |
Absorbance |
|
|
Analyst 1 |
6 |
0.216 |
|
|
Analyst 1 |
6 |
0.218 |
|
|
Analyst 2 |
6 |
0.221 |
|
|
Analyst 2 |
6 |
0.222 |
|
|
Overall mean |
- |
0.21925 |
|
|
S. D |
- |
0.00263 |
|
|
%RSD |
- |
1.20% |
|
CONCLUSION
The developed cubosomal formulation showed good compatibility and stability as confirmed by FTIR analysis. Molecular docking supported the drug’s interaction with the target site. The validated UV method met all required criteria for linearity, precision, and sensitivity. Overall, the study confirms the reliability of the formulation and analytical approach for antifungal applications.
REFERENCES


Anup Ladhake, Monika Jadhao, Shailesh Jawarkar, Vijay Waghulkar, Furqan Shah Formulation, Evaluation and Quality Assessment of Antifungal Cubosomes Drug Delivery System, Int. J. of Pharm. Sci., 2026, Vol 4, Issue 5, 7378-7392, https://doi.org/10.5281/zenodo.20411368
 10.5281/zenodo.20411368