

We use cookies to ensure our website works properly and to personalise your experience. Cookies policy
Deccan School Of Pharmacy, Osmania University, Hyderabad, Telangana, India-500001.
A quick, sensitive, and accurate RP-HPLC approach has been employed to identify and measure Acetaminophen and Oxycodone using a Waters PDA-detected HPLC mode. An Inertsil -ODS C18 (250 x 4.6 mm, 5) column was completely utilized for separation of Acetaminophen and Oxycodone, volumetric rate was 1.0 ml/min. The process's mobile phase was filtered and combined with degassed Methanol and Acetonitrile (85:15) and detection wave length was 247 nm
1.0 Introduction to HPLC:
High Performance Liquid Chromatography (HPLC) was derived from the classical column chromatography and, is one of the most important tools of analytical chemistry today.1In the modern pharmaceutical industry, high-performance liquid chromatography (HPLC) is the major and integral analytical tool applied in all stages of drug discovery, development, and production.2 HPLC is the method of choice for checking peak purity of new chemical entities, monitoring reaction changes is in synthetic procedures or scale up, evaluating new formulations and carrying out
quality control / assurance of the final drug products.3
1.1 HPLC Method Development:
Methods are developed for new products when no official methods are available. Alternate methods for existing (Non-Pharmacopoeial) products are to reduce the cost and time for better precision and ruggedness. When alternate method proposed is intended to replace the existing procedure comparative laboratory data including merit/demerits are made available. The goal of the HPLC-method is to try & separate, quantify the main active drug, any reaction impurities, all available synthetic inter-mediates and any degradants.5
Steps involved in Method development are. 4,5
Understanding the Physicochemical properties of drug molecule.
Selection of chromatographic conditions.
Developing the approach of analysis.
Sample preparation
Method optimization
Method validation.
1.2 Method Validation:
Validation of an analytical method is the process by which it is established by laboratory studies, that the performance characteristics of the method meet the requirements for the intended analytical application. Validation is required for any new or amended method to ensure that it is capable of giving reproducible and reliable results, when used by different operators employing the same equipment in the same or different laboratories. The type of validation program required depends entirely on the particular method and its proposed Applications.6Results from method .Validation can be used to judge the quality, reliability and consistency of analytical results; it is an integral part of any good analytical practice. Use of equipment that is within specification, working correctly and adequately calibrated is fundamental to the method validation process. Analytical methods need to be validated or revalidated.7
Before their introduction into routine use;
Whenever the conditions change for which the method has been validated
Whenever the method is changed
Typical parameters recommended by FDA, USP, and ICH are as follow.7,8
1. System suitability
2. Precision
3. Accuracy (Recovery)
4. Linearity
5. Robustness
6. Limit of Detection (LOD)
7. Limit of Quantification (LOQ)
2. MATERIALS
Tools-Instruments:
• HPLC – Waters Model NO.2690/5 Compact System consisting of panel with Inertsil-C18 ODS.
• Electronic equilibrium (SARTORIOUS)
• Sonicator (CLEAN FAST)
Chemical Substances:
• Methanol grade HPLC.
• HPLC Class buffer (KH2PO4).
Raw Stock:
Standards in dealing with Oxycodone and Acetaminophen.
2.1 METHOD FOR HPLC DEVELOPEMENT
Cellular phase: Methanol and Acetonitral were degassed at a 85:15 V/V ratio.
Preparation of a stock solution:
Reference remedy:
In order to prepare the solution, two volumetric flasks with a volume of 100.0 mL each were filled with 125.0 mg of Acetaminophen and 120.0 mg of precisely weighed Oxycodonethen sonicated for 20 minutes. Take 10.0 mL of each of the solutions and place them in a 100.0 mL volumetric flask. Next, add mobile phase, and after 10 minutes, sonicate the mixture.
The creation of a Standard Working Solution:
Along with the previously mentioned Oxycodone and Acetaminophen, For each medically, stock solutions varying in ranging from 20 to 80 ppm were made, sonicated, and filtered through a 0.45 membrane.
Optimised Chromatography Condition
|
Parameters |
Method |
|
|
Stage of Stationary (column) |
Inertsil -ODS C18(250 x 4.6 mm, 5 µ) |
|
|
Mobile Phase |
Methanol and Acetonitrile (85:15) |
|
|
Flow rate (ml/min) |
1.0 ml/min |
|
|
Duration of operation (minutes) |
8 min |
|
|
Temperature in the column (°C) |
Ambient |
|
|
Volume of injection loop (l) |
20 |
|
|
Wavelength of detection (nm) |
247 nm |
|
|
Drug RT (min) |
5.066 min for Oxycodoneand 7.266 for Acetaminophen. |
|
3.RESULTS
OPTIMIZED METHOD

Fig 1: Conventional Chromatogram
Inference: With RTs of 5.066 minutes for Oxycodoneand 7.266 minutes for Acetaminophen, a chromatogram was obtained.
3.1DATA-VALIDATION(VALIDATION DATA)
3.1.1 SYSTEM ACCOMPANY(SYSTEM SUITABILITY):
Validation Stock Solution Preparation:
Solution A :Take 125mg Oxycodone working standard in 100ml V.F add methanol sonicate it 30minets,(That is 1000ppm solution).
Solution B :Take 120mg Acetaminophen working standard in 100ml V.F add methanol sonicate it 30minets,(That is 1000ppm solution).
Validation Parameters Solutions Preparation:
Prepare a series of standard solutions from 20 ppm to 80 ppm by diluting 2 ml to 8 ml of stock solutions A and B into 100 ml volumetric flasks with methanol, followed by 10 minutes of sonication
TABLE- 1(a): Device Eligibility Information for Oxycodone(Data of System Suitability for Oxycodone)
|
Injection |
RT |
Peak Area |
USP Plate count |
USP Tailing |
|
1 |
7.266 |
779814 |
15231 |
1.15124 |
|
2 |
7.262 |
780101 |
15292 |
1.18749 |
|
3 |
7.264 |
778155 |
15225 |
1.17877 |
|
4 |
7.263 |
777520 |
15742 |
1.12460 |
|
5 |
7.267 |
778009 |
15236 |
1.18744 |
|
Mean |
7.2644 |
778719.8 |
15345.2 |
1.16334 |
|
SD |
0.002074 |
1158.527 |
------- |
------- |
|
% RSD |
0.028545 |
0.148773 |
------- |
------- |
TABLE-1(b): Device Eligibility Information for Acetaminophen
(Data of System Suitability for Acetaminophen)
|
Injection
|
RT |
Peak Area |
USP Plate count |
USP Tailing |
|
1 |
7.266 |
779814 |
15231 |
1.15124 |
|
2 |
7.262 |
780101 |
15292 |
1.18749 |
|
3 |
7.264 |
778155 |
15225 |
1.17877 |
|
4 |
7.263 |
777520 |
15742 |
1.12460 |
|
5 |
7.267 |
778009 |
15236 |
1.18744 |
|
Mean |
7.2644 |
778719.8 |
15345.2 |
1.16334 |
|
SD |
0.002074 |
1158.527 |
------- |
------- |
|
% RSD |
0.028545 |
0.148773 |
------- |
------- |

Fig: 2- Chromatogram compatible with devices (Standard 1)
3.1.2.PRECISION:
The method precision for Oxycodone was demonstrated by evaluating six replicate sample preparations
at a target concentration of 40 ppm, yielding a mean peak area of 471156.3 with a relative standard
deviation (% RSD) of 0.19%, which is well within the acceptable regulatory limit of 2.0%.
The method precision for Acetaminophen was demonstrated by evaluating six replicate sample preparations
at a target concentration of 40 ppm, yielding a mean peak area of 779276.3 with a relative standard deviation
(%RSD) of 0.03%, which is well within the acceptable regulatory limit of 2.0%.
3.1.3.ACCURACY:
TABLE 2 ( a) oxycodone
|
*Concentration
% of spiked level |
Amount added (ppm) |
Amount found (ppm) |
% Recovery |
Statistical Analysis of % Recovery |
|
|
50% Injection 1 |
20 |
19.92 |
99.78 |
MEAN %RSD |
99.87 0.68 |
|
100 % Injection 1 |
40 |
39.94 |
98.92 |
MEAN %RSD |
99.84 0.657 |
|
150% Injection 1 |
60 |
59.97 |
99.96 |
MEAN %RSD |
100.07 0.345 |
*Concentration % Of Spiked Level Has Been Performed 3 Times.
TABLE 2 (b) Acetaminophen
|
*Concentration
% of spiked level |
Amount added (ppm) |
Amount found (ppm) |
% Recovery |
Statistical Analysis of % Recovery |
|
|
50% Injection 1 |
0 |
19.89 |
99.87 |
MEAN %RSD |
99.97 0.874 |
|
100 % Injection 1 |
40 |
39.92 |
99.88 |
MEAN %RSD |
99.97 0.687 |
|
150% Injection 1 |
60 |
59.95 |
98.87 |
MEAN %RSD |
99.94 0.97 |
*Concentration % Of Spiked Level Has Been Performed 3 Times.

Fig-3:Accuracy Chromatograms (50 percent)
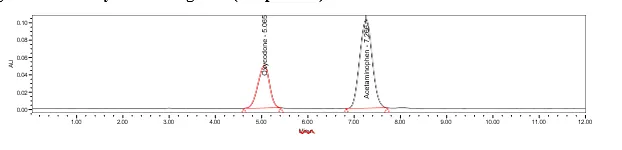
Figure 4: Accuracy Chromatograms (100 per cent)
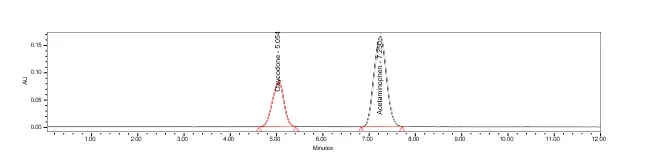
Figure -5: For Accuracy Chromatograms (150 per cent)
3.1.4.LINEARITY:
TABLE 3(a)Data of Linearity (Oxycodone)
|
S.NO |
Concentration |
Average Area |
|
1 |
0 |
0 |
|
2 |
20 |
230828 |
|
3 |
30 |
57053 |
|
4 |
40 |
469514 |
|
5 |
50 |
596111 |
|
6 |
60 |
719969 |
|
7 |
70 |
825875 |

Fig: 6(a) Linearity Plot of Oxycodone (Concentration Vs response)
TABLE 3(b)Data of Linearity (Acetaminophen)
|
S.no |
Concentration |
Average Area |
|
0 |
0 |
0 |
|
2 |
20 |
386907 |
|
3 |
30 |
581164 |
|
4 |
40 |
779814 |
|
5 |
50 |
986354 |
|
6 |
60 |
1181597 |
|
7 |
70 |
1374407 |
Statistical Analysis:
• Slope – 19719
• y Intercept -- -4847
• Corelation Coefficient – 0.999

Fig: 6(b) Acetaminophen linearity plot (Concentration Vs response)
3.1.5 Robust Durability(Robustness):
TABLE: 4(a) Information on Oxycodone's effects on flow rate variability:
|
Flow
0.8 ml |
Std
Area |
Tailing
factor |
Flow
1.0 ml |
Std
Area |
Tailing
factor |
Flow
1.2 ml |
Std Area |
Tailing
factor |
|
469237 |
1.103 |
470324 |
1.122 |
471845 |
1.103 |
|||
|
469284 |
1.110 |
470857 |
1.110 |
471324 |
1.116 |
|||
|
469320 |
1.102 |
470321 |
1.110 |
471084 |
1.134 |
|||
|
469271 |
1.131 |
470847 |
1.113 |
471382 |
1.101 |
|||
|
469824 |
1.122 |
470342 |
1.101 |
471082 |
1.102 |
|||
|
Avg |
469387. 2 |
1.1136 |
Avg |
470538. 2 |
1.1112 |
Avg |
7640789.5 4 |
1.1112 |
|
SD |
245.979 1 |
0.01258 2 |
SD |
286.593 3 |
0.0075 3 |
SD |
8786.021 |
0.01413 2 |
|
%RS D |
0.05240 4 |
1.1298 |
%RS D |
0.06090 8 |
0.6776 4 |
%RS D |
0.87741 |
1.2717 |
TABLE: 4(b)Information on the effects of flux rate variation (Acetaminophen)
|
Flow
0.8 ml |
Std
Area |
Tailing
factor |
Flow
1.0 ml |
Std
Area |
Tailing
factor |
Flow
1.2 ml |
Std
Area |
Tailing
factor |
|
778942 |
1.099 |
779351 |
1.128 |
780241 |
1.121 |

Fig-7: Robust Chromatograms
4.SUMMARY:
|
Validation Parameter |
Oxycodone Results |
Acetaminophen Results |
|
System Suitability |
• Mean RT: 5.0628 min
• Mean Peak Area: 471,351.6
• % RSD (Peak Area): 0.270572%
|
• Mean RT: 7.2644 min
• Mean Peak Area: 778,719.8
• % RSD (Peak Area): 0.148773%
|
|
Method Precision
(Repeatability at 40 ppm) |
• Mean Peak Area: 471,156.3
• % RSD (Peak Area): 0.193263%
|
• Mean Peak Area: 779,276.3
• % RSD (Peak Area): 0.02561%
|
|
Accuracy (Recovery) |
• 50% Level (20 ppm): 99.87%
• 100% Level (40 ppm): 99.84%
• 150% Level (60 ppm): 100.07% |
• 50% Level (20 ppm): 99.97%
• 100% Level (40 ppm): 99.97%
• 150% Level (60 ppm): 99.94% |
|
Linearity |
• Correlation Coefficient : 0.9997 |
• Correlation Coefficient : 0.9999 |
|
Sensitivity |
• LOD: 0.34 ppm
• LOQ: 1.03 ppm |
• LOD: 0.19 ppm
• LOQ: 0.59 ppm |
|
Robustness
(Flow Rate Variation) |
• 0.8 ml/min Mean Area: 469,387.2 (%RSD: 0.05%)
• 1.0 ml/min Mean Area: 470,538.2 (%RSD: 0.06%)
• 1.2 ml/min Mean Area: 7,640,789.54* (%RSD: 0.88%) |
• 0.8 ml/min Mean Area: 778,523.8 (%RSD: 0.04%)
• 1.0 ml/min Mean Area: 779,476.8 (%RSD: 0.04%)
• 1.2 ml/min Mean Area: 780,462.2 (%RSD: 0.02%) |
CONCLUSION
The analytical approach was developed through analysis of various parameters. First, maximum absorbance was observed at 254 nm for Oxycodone and 284 nm for Acetaminophen . Typical wavelength would be 247 nm, and the purity of peaks was excellent. The volume of injection was chosen as 20μl which gave a good peak area. The column used for analysis was Inertsil C18, a strong peak shape chosen by ODS. It has been found that ambient temperature suits the nature of the drug solution. Due to good peak area, adequate retention time and good resolution the flow rate was set at 1.0ml / min. Different mobile phase ratios were tested, mobile phase with Methanol and Acetonitrile (85:15) ratio was set due to good symmetrical peaks and good resolution. For the proposed analysis, instead, this mobile process was used.
The current recovery was found to be linear and precise over the same range as 98.0-101.50. Precision of both the device and the procedure has been found to be reliable and within limits. The detection limit for Acetaminophen was 0.25 Oxycodone, and 0.34. The study of linearity was, coefficient of correlation and curve fitting was found to be. For both the drugs, the analytical approach observed linearity over the 20-70ppm range of the target concentration. The analytical has passed tests of both robustness and robustness. Relative standard deviation was very satisfactory in both occasions.
REFERENCES





Mirza Osman Baig, Mohammad Irfan Sami, Wasifa Tabassum, Sana Sultana ,Iffath Rizwana Method Development and Method Validation of Oxycodone and Acetaminophen BY RP-HPLC, Int. J. of Pharm. Sci., 2026, Vol 4, Issue 7, 1145-1153, https://doi.org/10.5281/zenodo.21218014
 10.5281/zenodo.21218014