
We use cookies to ensure our website works properly and to personalise your experience. Cookies policy
Department of Pharmaceutical Analysis, Viswanadha Institute of Pharmaceutical Sciences, Anandapuram, Visakhapatnam.
A rapid, sensitive, and accurate RP-HPLC method was developed for the identification and quantification of Cobicistat and Darunavir using a Shimadzu HPLC system. Chromatographic separation was achieved on an Inertsil ODS-C18 column (250 × 4.6 mm, 5 µm particle size) with a flow rate of 1.0 mL/min. The mobile phase consisted of degassed and filtered Methanol: Water (68:32, v/v). Detection was performed at 245 nm, providing reliable resolution and measurement of both analytes
Prezcobix is a fixed-dose prescription medication used in combination with other antiretroviral agents to treat HIV-1 infection in adults and pediatric patients. It combines two drugs into one once-daily tablet: Darunavir (a protease inhibitor that stops the virus from replicating) and Cobicistat (a CYP3A inhibitor that boosts darunavir's effectiveness)
Cobicistat (6-7) is a pharmacokinetic enhancer (or "booster") with no antiviral activity of its own. Its primary mechanism of action is the potent, mechanism-based inhibition of the cytochrome P450 3A (CYP3A) enzyme system in the liver and intestines, which slows the metabolism of certain co-administered HIV medications. Cobicistat selectively and irreversibly binds to CYP3A enzymes (primarily CYP3A4). These enzymes are responsible for breaking down many antiretroviral drugs. By inhibiting them, cobicistat drastically reduces the breakdown of these drugs.
Darunavir (8) is an HIV-1 protease inhibitor that stops the virus from replicating. It selectively binds to the active site of the HIV protease enzyme and prevents its dimerization. This blocks the cleavage of viral polyproteins, resulting in the production of immature, non-infectious viral particles.
II. MATERIALS AND METHODS
Preparation of Stock solution: 10 mg each of Cobicistat and Darunavir was accurately weighed and is transferred into neat and dry volumetric flasks of 10ml. About 7ml of methanol was added and allow to sonicate to remove the air bubbles formed in it, which is again make up to mark with methanol to give 1000µg/ml or 1mg/ml.
Preparation of working solution: From the stock solution 0.15ml of Cobicistat and 0.795ml of Darunavir are taken to the 10ml volumetric flask which is again diluted with methanol up to the mark to get 15µg/ml Cobicistat and 79.5µg/ml Darunavir.
III. RESULTS AND DISCUSSION
Method validation: Validation parameters include specificity, linearity, range, accuracy, precision, limit of detection, limit of quantification, robustness and assay (1-5).
Specificity: Specificity is the ability to assessing equivocally the analyte in the presence of components which may be expected to be present. Typically, these components include impurities, degradants, matrix etc. Blank solution and standard solutions of Cobicistat (15μg/ml) and Darunavir (79.5μg/ml) were injected into the HPLC system. The peak purity data of Cobicistat and Darunavir were compared. There should not be any interference at the retention time of the main peaks.
Linearity: Linearity for the drugs Cobicistat and Darunavir (9-12) was determined by preparing the standard solutions at five concentrations levels in the range of 5-25μg/ml of Cobicistat and 26.23-131.90μg/ml of Darunavir from stock solution. The linearity charts of Cobicistat and Darunavir was shown in the figure no 2&3. The correlation coefficient was found to be 0.9998 and 0.9988 for Cobicistat and Darunavir respectively. Linearity results were tabulated in table 2.
Accuracy: Accuracy was performed by spiking known amounts of standard solution to sample solution at three different concentrations levels (50%, 100% and 150%) and there by analyzed for %RSD which should not be more than 2.0. The % recovery was calculated and was found to be 99.67 and 99.6 for Cobicistat and Darunavir respectively. The results were reported in table no. 3 & 4.
Precision: The precision (13-16) of the analytical method was studied by injecting five replicates of standard containing 15μg/ml of Cobicistat and 79.5μg/ml Darunavir which were injected into HPLC system. The % RSD was calculated and the results were reported in the table no. 5.
Limit of Detection (LOD) and Limit of Quantification (LOQ): The limit of detection was defined as the concentration which yields a signal - to – noise ratio 3:1 where as the limit of quantification was calculated to be the lowest concentration that could be measured with signal - to – noise ratio10:1. LOD and LOQ were calculated from slope and standard deviation. The results were tabulated in table no. 6.
Robustness: The smallest deliberate changes in method like change in flow rate are made but there were no predictable changes in the results and are in the range as per ICH guidelines. Conditions like decrease in flow rate (0.8 ml/min), increase in flow rate (1.2 ml/min) was maintained and samples were injected in duplicate manner. System suitability parameters were not much affected and all the parameters were passed. % RSD was found to be within the limits and results were tabulated in table no. 7.
Assay: Assay was conducted on marketed formulation and mean % assay was found. The results were tabulated in table no. 8.
Table 1: Optimised Chromatographic Conditions
|
Parameter |
Conditions |
|
Flow rate |
1ml/min |
|
Column |
Inertsil – C18, ODS (250x4.6mm, 5µ) |
|
Detector wave length |
245nm |
|
Column temperature |
35°C |
|
Mobile phase |
Degassed methanol: water (68:32) |
|
Injection volume |
10µl |
|
Run time |
6 min |
|
Retention time |
2.121 min for Cobicistat 3.643 min for Darunavir |
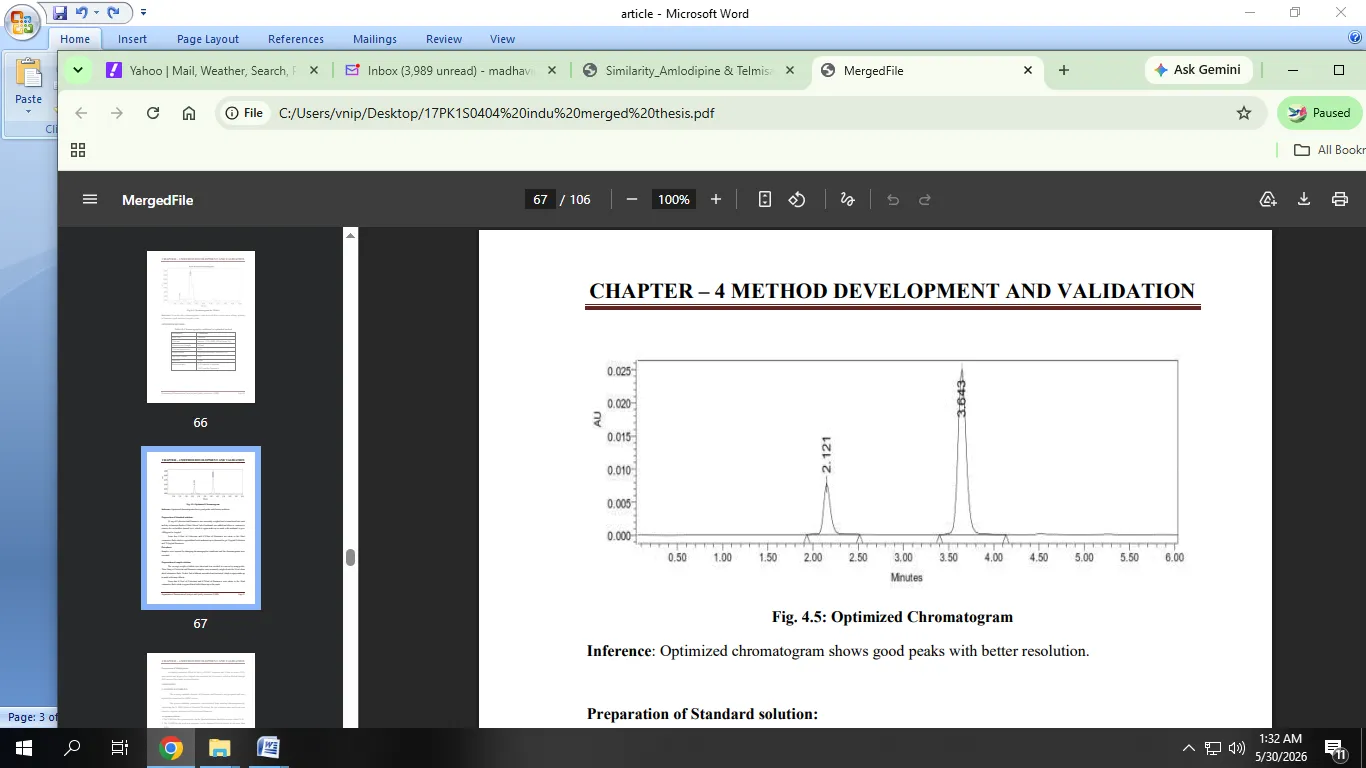
Figure 1: Optimized Chromatogram
Table 2: Linearity data of Cobicistat and Darunavir
|
Cobicistat |
Darunavir |
||
|
Conc (µg/ml) |
Peak area |
Conc (µg/ml) |
Peak area |
|
0 |
0 |
0 |
0 |
|
5 |
135005 |
26.23 |
489094 |
|
10 |
277120 |
52.47 |
1149397 |
|
15 |
405128 |
79.50 |
1657592 |
|
20 |
534643 |
105.70 |
2150412 |
|
25 |
672357 |
131.90 |
2748444 |
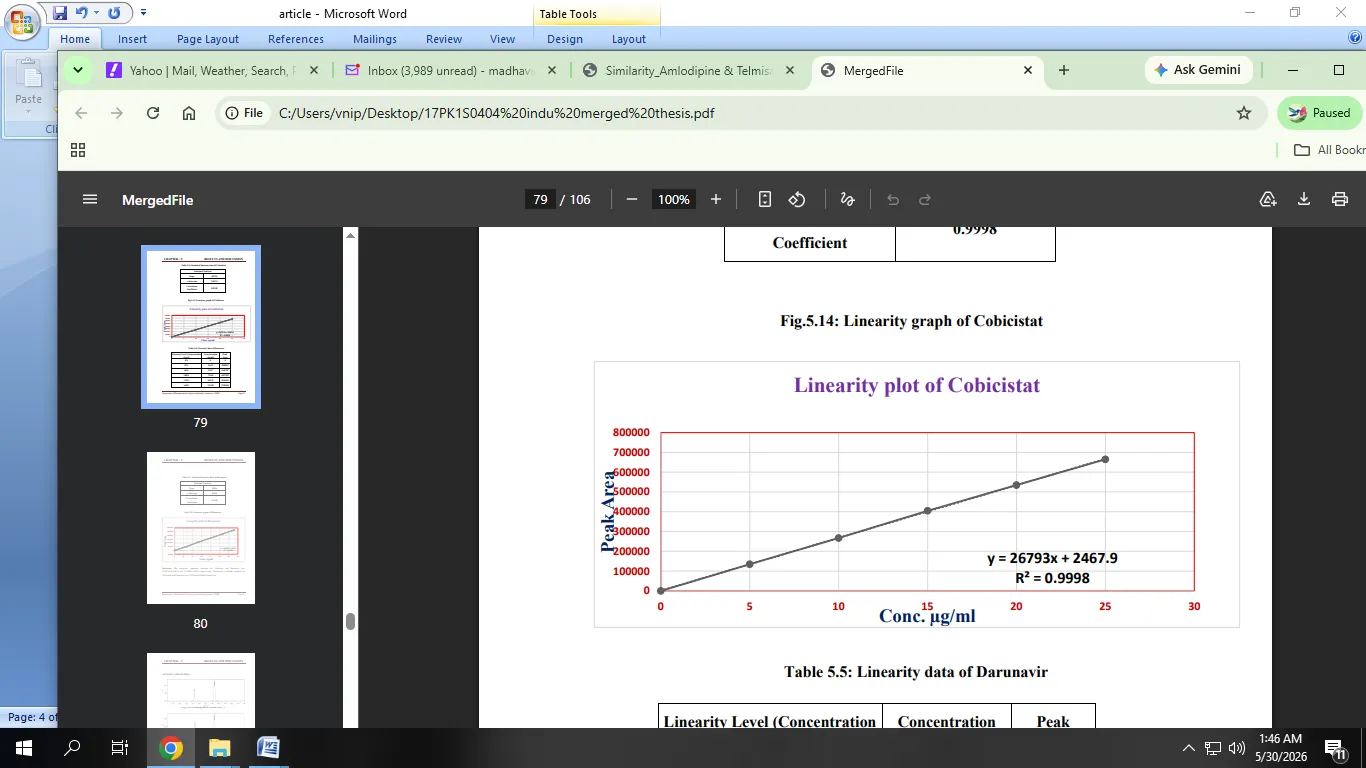
Figure 2: Calibration curve of Cobicistat
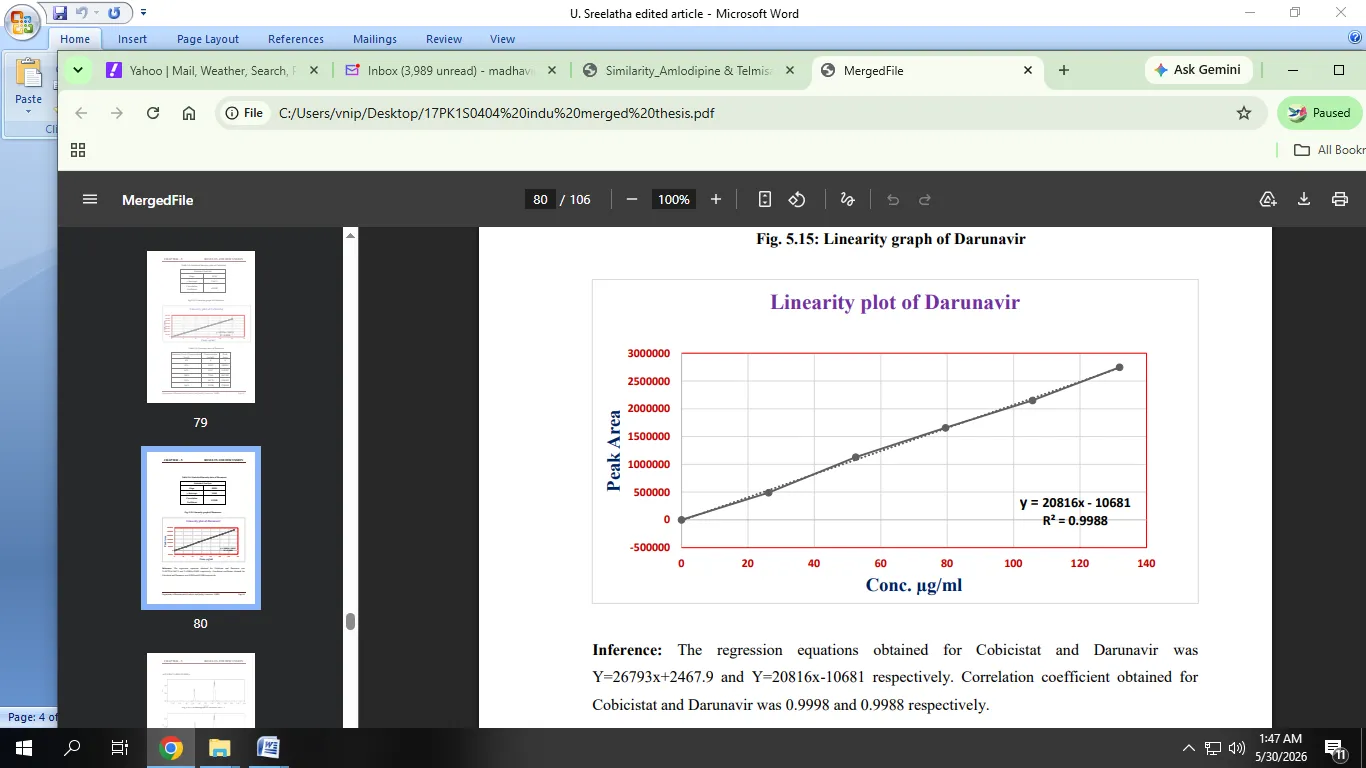
Figure 3: Calibration curve of Darunavir
Table 3: Accuracy Data of Cobicistat
|
% of spiked level |
Amount added (µg) |
Amount found (µg) |
% Recovery |
Statistical Analysis of % Recovery |
|
50% Injection - 1 |
7.5 |
7.477 |
99.70 |
MEAN=99.8 %RSD=0.66 |
|
50% Injection - 2 |
7.537 |
100.5 |
||
|
50% Injection - 3 |
7.44 |
99.2 |
||
|
100 %Injection - 1 |
15 |
14.91 |
99.4 |
MEAN=99.3 %RSD=0.21 |
|
100 %Injection - 2 |
14.86 |
99.1 |
||
|
100%Injection - 3 |
14.92 |
99.5 |
||
|
150%Injection - 1 |
22.5 |
22.39 |
99.53 |
MEAN=99.9 %RSD=0.35 |
|
150% Injection - 2 |
22.53 |
100.16 |
||
|
150% Injection - 3 |
22.52 |
100.12 |
Table 4: Accuracy Data of Darunavir
|
% of spiked level |
Amount added(µg) |
Amount found(µg) |
% Recovery |
Statistical Analysis of % Recovery |
|
50% Injection - 1 |
39.73 |
39.71 |
100.75 |
MEAN=99.9 %RSD=0.92 |
|
50% Injection -2 |
39.65 |
99.31 |
||
|
50% Injection - 3 |
39.60 |
99.02 |
||
|
100 % Injection - 1 |
79.5 |
79.48 |
99.70 |
MEAN=99.0 %RSD=0.41 |
|
100 % Injection - 2 |
79.54 |
100.30 |
||
|
100% Injection - 3 |
79.42 |
99.50 |
||
|
150% Injection - 1 |
119.25 |
119.29 |
100.21 |
MEAN=99.9 %RSD=0.31 |
|
150% Injection - 2 |
119.23 |
99.61 |
||
|
150% Injection - 3 |
119.27 |
100.10 |
Table 5: Precision data of Cobicistat
|
Injection |
Peak areas of Cobicistat |
Peak areas of Darunavir |
|
1 |
407673 |
1628262 |
|
2 |
406506 |
1615796 |
|
3 |
402118 |
1617864 |
|
4 |
400459 |
1618493 |
|
5 |
405412 |
1619626 |
|
Mean |
404433.6 |
1620008.2 |
|
SD |
3037.485 |
4819.422 |
|
% RSD |
0.75 |
0.30 |
Table 6: LOD and LOQ data of Cobicistat and Darunavir
|
Drug Name |
LOD (µg/ml) |
LOQ (µg/ml) |
|
Cobicistat |
0.5 |
1.5 |
|
Darunavir |
9.1 |
27.7 |
Table 7: Robustness data of Cobicistat and Darunavir
|
S No |
Drug Name |
Condition |
Peak area |
Tailing factor |
|
1 |
Cobicistat |
Decreased Flow rate of 0.8 ml/min |
398841 |
0.9 |
|
2 |
Increased Flow rate of 1.2 ml/min |
389947 |
1.1 |
|
|
3 |
Darunavir |
Decreased Flow rate of 0.8 ml/min |
1613422 |
0.9 |
|
4 |
Increased Flow rate of 1.2 ml/min |
1619138 |
0.8 |
Table 8: Assay data Cobicistat and Darunavir
|
S. No |
Peak areas of Cobicistat |
% Assay |
Peak areas of Darunavir |
% Assay |
|
1 |
406538 |
99.12 |
1609924 |
99.73 |
|
2 |
409975 |
1601840 |
||
|
3 |
402283 |
1602832 |
||
|
4 |
406538 |
1609924 |
||
|
5 |
409975 |
1601840 |
||
|
6 |
402911 |
1603821 |
CONCLUSION
The developed RP-HPLC method was validated as per ICH guidelines. All the system suitability parameters were within the range as stated by ICH guidelines. Interference peaks were not observed in blank, standard and sample chromatogram. Hence simple, precise and accurate, sensitive, specific and robust method was developed and validated. This can be used in quality control department with respect to routine analysis.
Acknowledgements: Authors are thankful to the management of Viswanadha Institute of Pharmaceutical Sciences (VNIPS) for providing facilities and support to carry out this work.
REFERENCES


Dr. P V Madhavi Latha, P. Siva Lalitha, K Suvarna, Dr. P Uma Devi, RP-HPLC Method Development and Validation for The Simultaneous Estimation of Cobicistat and Darunavir in Bulk and Solid Dosage Forms, Int. J. of Pharm. Sci., 2026, Vol 4, Issue 6, 7119-7125, https://doi.org/10.5281/zenodo.20991790
 10.5281/zenodo.20991790