

We use cookies to ensure our website works properly and to personalise your experience. Cookies policy
Rajarambapu College of Pharmacy, Kasegaon
The present study focuses on the development and validation of a simple, reliable, and efficient RP-HPLC method for the quantitative determination of Enzalutamide in tablet dosage forms. Separation of the drug was successfully achieved on a C18 chromatographic column using an optimized mobile phase under suitable operating conditions. Detection was carried out with a UV detector at the selected wavelength, resulting in well-defined and symmetrical chromatographic peaks. Validation was performed in accordance with ICH guidelines to ensure the method's suitability for routine analysis. Various validation parameters, including accuracy, precision, specificity, linearity, robustness, limit of detection (LOD), and limit of quantification (LOQ), were thoroughly evaluated. Recovery studies confirmed the accuracy of the method, while low %RSD values indicated a high degree of precision and reproducibility. The method was found to be specific, as no interference from formulation excipients was observed during analysis. Robustness testing further established the reliability of the method under small deliberate variations in analytical conditions. Hence, the developed RP-HPLC method can be effectively applied for routine quality control and assay analysis of Enzalutamide tablets in pharmaceutical laboratories
In the world, prostate cancer (PCa) ranks sixth in terms of cancer-related deaths among men and is the second most frequent cause of cancer.[1] Due to population increase and ageing, prostate cancer is predicted to cause1.7 million new cases and
499,000 deaths worldwide by 2030.[2] Oral enzalutamide (Xtandi®), a second-generation androgen receptor inhibitor, is indicated for the treatment of castration-resistant prostate cancer (CRPC) in numerous countries worldwide [3] Cancer is a condition where aberrant cells proliferate out of control, destroying bodily tissues. The current pharmacological treatments for cancer are not very successful.[4] One of the biggest and most significant classes of anticancer medications are DNA interaction agents, which work via a number of different pathway [5] Analytical methods are crucial to the development of pharmaceutical products and quality control.[6] Enzalutamide prevents prostate cancer cells from being exposed to testosterone. Testosterone is necessary for the growth of the majority of prostate malignancies. This may reduce the cancer's size and delay its growth [7] The most popular method for identifying, separating, and quantifying drugs is HPLC. To optimise the procedure, several chromatographic parameters were examined, including sample pretreatment, mobile phase selection, column selection, and detector selection.[8] We are estimating this medicine in pharmaceutical dosage form both qualitatively and quantitatively using a straightforward and cost-effective method This approach is widely used in biology for both pharmaceutical product quality control and research development [10] Analytical processes are essential to the creation, standardisation, and quality control of medical products.
They are essential for studies on drug metabolism and pharmacokinetics. Both are crucial for determining the duration of a reaction and assessing bioavailability. Analytical equipment is crucial for the development and evaluation of new products as well as for supporting consumers and the environment.[11] A technique that consistently divides a mixture into two phases is called chromatography. There are two phases: the stationary phase and the mobile phase. The mobile phase moves over the stationary phase continually. Chromatography, according to USP, is the technique of separating solutes by differential migration when one of two or more phases in a system flows steadily in one direction [12]
Chromatography Based Principles:
i) Adsorption Chromatography: This technique uses a liquid or gas as the mobile phase and a solid as the stationary phase. when dealing with liquids.
ii) partition chromatography: The preferred technique for both the stationary and mobile phase [13]
HPLC: HPLC is the best in analytical chemistry. A stationary phase and a mobile phase cooperate in HPLC to separate mixture components. These phases separate due to differences in their distribution coefficients. It is widely used in both quantitative and qualitative assessments of pharmaceutical products because to its accuracy[14]
2. METHOD DEVELOPMENT AND VALIDATION OF HPLC:
New techniques are developed for innovative things when approved processes are not available. When a new strategy is introduced as an alternative to the existing one, it is accompanied by comparative laboratory data that outlines the advantages and disadvantages. Identification and measurement of the primary active ingredient, reactive contaminants, chemical intermediates, and degradants are the primary objectives of the HPLC approach.[16] Mini-validation must be completed prior to routine, investigation, and stability sample analysis in order to create an analytical technique for drug products from the in-process to the final product phases.[17]
Method validation: "Documented evidence, which provides a high degree of assurance that a specific process will consistently produce, a product meeting its predetermined specifications and quality attributes"
Parameters of analytical method validation:
1. Accuracy
2. Linearity
3. Precision
a) Repeatability
b) Intermediate
c) Reproducibility
4. Specificity
5. Limit of Detection
6. Limit of Quantitation
MATERIAL AND METHOD
Chemical and Reagents :
Enzalutamide functioning standard was acquired from a reliable pharmaceutical supplier. The mobile phase and sample solutions were prepared using Milli-Q Water and HPLC-grade acetonitrile. Orthophosphoric acid (OPA, GR grade) were utilized for buffer preparation and pH correction. The mobile phase and sample solutions were filtered using a 0.45 µm Nylon 6,6 membrane filter (Pall Life Sciences) before chromatographic analysis. Every chemical and reagent utilized in the study was of analytical reagent (AR) or HPLC quality and didn't require any additional purification.
Table: Reagents and Synthetic Utilized
|
Sr No. |
Material Name |
Grade |
Make |
|
1 |
Water |
Milli-Q |
Inhouse |
|
2 |
Acetonitrile |
HPLC Grade |
Merk |
|
3 |
Methanol |
HPLC Grade |
Merk |
|
4 |
Potassium Dihydrogen Phosphate |
AR Grade |
Merk |
|
5 |
Potassium Hydroxide |
AR Grade |
Merk |
METHOD :
Preparation of diluent-1:
Mix well Water and Acetonitrile in the ratio of 10:90v/v
Preparation of diluent-2:
Mix well Water and Acetonitrile in the ratio of 30:70v/v
Preparation of Blank:
Pipette out 5 mL of diluent-1 into a 200 mL volumetric flask, add Diluent-2 to complete the volume, and thoroughly mix by aggressively shaking the flask in both top and bottom directions for 30 to 45 seconds.
Preparation of Standard Stock Solution :
In a 100 mL volumetric flask, precisely weigh 40 mg of enzalutamide working standard or reference standard. Then, add 70 mL of diluent-1 and sonicate to fully dissolve. After cooling to room temperature (about 25°C), dilute with diluent to the appropriate level and thoroughly mix by vigorously shaking the flask from top to bottom for 30 to 45 seconds.
Preparation of Standard Solution
Fill a 50 mL volumetric flask with 5 mL of the standard stock solution using a pipette. Use Diluent-2 to adjust the volume, then thoroughly mix by hand while violently shaking the flask in both top and bottom directions for 30 to 45 seconds.
Optimization of an analytical (RP-HPLC) method:
To develop an analytical method for assessing substances related to enzalutamide, the RP-HPLC procedure was optimised. The RP-HPLC technique was developed as a result of several investigations utilising various mobile phase compositions to enhance the mobile phase. Other chromatographic parameters, such as wavelength, flow rate, column temperature, etc., were also changed during the method development phase.
Optimization of mobile phase:
Mobile phase A [buffer pH 6.0 and acetonitrile (950:50 v/v)] at a flow rate of 1.0 mL/min in the gradient program was found to provide an appropriate retention duration and to exhibit satisfactory separation of the enzalutamide peak. The buffer used in optimum mobile phase was Potassium dihydrogen phosphate and Water (pH 6.0)
Optimization of Flow Rate for Mobile Phase:
By injecting the normal Enzalutamide solution at various flow rates between 0.8 and 1.2 mL/min, the mobile phase flow rate was optimised. The resolution, retention time, and peak form of each chromatogram were assessed. For the final assay procedure, a flow rate of 1.0 mL/min was chosen since it was shown to offer the optimum peak symmety and sufficient retention duration
Optimization of Stationary Phase:
To find the greatest performance for enzalutamide separation, the stationary phase was optimised by comparing various C18 columns with different lengths, particle sizes, and manufacturers. The same mobile phase was used for testing each column, and peak form, resolution, and retention duration were examined in the chromatograms. The Inert Sustain C18 Column was chosen for the assay procedure because it produced crisp peaks with the best retention.
Method Validation:
The goal of validation is to confirm that an analytical procedure is suitable for its intended usage. According to ICH Q2B recommendations, the following typical analytical performance attributes should be considered while verifying the different kinds of procedures:
A. Specificity:
i. The capacity to definitively evaluate the analyte in the presence of components that could be expected to be present is known as specificity. To demonstrate the method's specificity, the following solution will be made and injected. (The standard and test sample solutions' peak purity was verified.)
ii. Blank [Water: Acetonitrile absolute [80:20 %v/v]
iii. Enzalutamide Standard solution
iv. Tablet test sample solution
Placebo Sample solution preparation:
Enzalutamide's standard stock solution was made by precisely weighing 10 mg of the medication and dissolving it in 10 mL of methanol to achieve a concentration of 1000 µg/mL. To get the necessary working concentration for the test, this solution was further diluted with the diluent. Before being injected into the HPLC system for specificity validation, the produced solution was passed through a 0.45 µm membrane filter.
A. Linearity and Range:
Preparation of linearity solution:
The capacity of an analytical process to produce test results that are directly proportional to the concentration (quantity) of analyte in the sample (within a specified range) is known as linearity. By generating several concentrations of linearity levels between the ranges of 25% and 150% of the labelled value for enzalutamide, the assay method's linearity is ascertained.
Enzalutamide standard stock solution:
By precisely weighing 10 mg of enzalutamide and dissolving it in 10 mL of diluent to achieve a concentration of 1000 ppm, the standard stock solution for linearity validation was created. To create working solutions in the range of 10–60 ppm, this stock solution was further diluted with the diluent. Before being injected into the HPLC system, each solution was passed through a 0.45 µm membrane filter.
Accuracy:
The degree of agreement between the value found and the value that is recognised as either an acceptable reference value or a conventional true value is a measure of an analytical procedure's accuracy.
Enzalutamide standard stock solution:
By precisely weighing 10 mg of enzalutamide and dissolving it in 10 mL of diluent to achieve a concentration of 1000 ppm, the standard stock solution for accuracy validation was created.
Accuracy Level at 10%: (5 ppm)
To create a 5ppm solution, pipette out 1 mL of stock into a 200 mL volumetric flask, dilute it to the appropriate level with diluent, and thoroughly mix.
Accuracy Level at 100%: (50 ppm)
To create a 50ppm solution, pipette out 10 mL of stock into a 200 mL volumetric flask, dilute it with diluent to the appropriate level, and thoroughly mix.
Accuracy Level at 200%: (100 ppm)
Pipette out 1mL stock into 10mL volumetric flask, dilute up to the mark with diluent and mix well to form 100 ppm solution.
Precision:
The degree of agreement between individual test results when an analytical method is applied repeatedly to many samplings of a homogenous sample is known as its precision.
The standard deviation or relative standard deviation (coefficient of variation) of the measurement series is typically used to express the analytical method's precision.
System Precision:
In accordance with the recommended test procedure for system precision investigations, a standard solution was created. In a replication, the HPLC apparatus was injected five times. Five replicate injections should yield peak responses with a percentage RSD of less than or equal to 2.0.
Method Precision:
It is an analytical technique that, when used repeatedly to numerous samplings of a homogenous sample, provides a degree of agreement among the individual sample results
LOD and LOQ:
The smallest amount of a material in a sample that can be precisely and accurately measured is known as the limit of quantification. The lowest amount of a material in a specimen that can be precisely and accurately measured is known as the limit of quantification. A calibration curve was used to estimate the LOD and LOQ separately. The standard deviation (SD) can be calculated using the standard deviation of the regression line's y-intercept.
LOD = 3.3 x σ/s LOQ-10 x σ/s
Were, σ = Standard deviation of y intercept of regression lines, S = Slope of calibration curve
Robustness and Ruggedness:
The ability of an analytical procedure to withstand small but intentional changes in method parameters is known as its robustness, and it shows how reliable it is when used on a regular basis. During the stages of technique development, it is partially analysed. Finding the crucial operational factors for the method's successful implementation is the aim of the robustness study. These arguments should be carefully managed, and a warning should be included in the method documentation. Changing process variables like pH, flow rate, and column temperature within a suitable range is part of a robustness analysis for an HPLC technique. To identify the parameter that has the biggest influence on the technique, the system suitability parameters gathered for each scenario are analysed.
RESULTS
Optimization of HPLC method
Trial 1:
Column: Symmetry shield RP18, 250 x 4.6 mm , 5.0µ
Flow Rate : 1.2 ml/ minute
Wavelength: 210 nm
Injection Volume : 5µL
Column Temperature: 25 °C
Run Time: 110 minutes
Table : Gradient Programme Trial 1
|
Time (minutes) |
Mobile phase-A |
Mobile phase-B |
|
00 |
45 |
55 |
|
22 |
25 |
75 |
|
42.1 |
0 |
100 |
|
64 |
0 |
100 |
|
87 |
45 |
55 |
|
110 |
45 |
55 |
Changes Made: NA
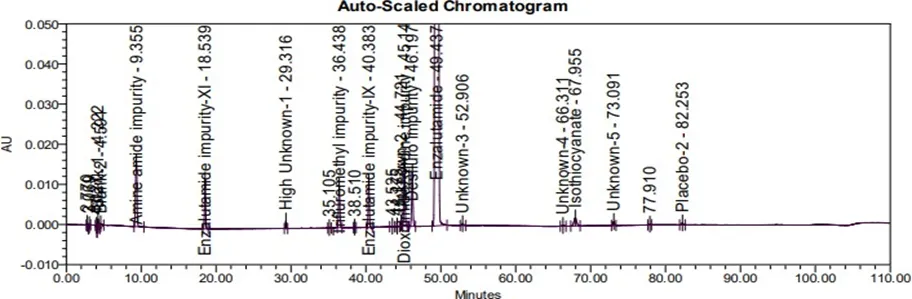
Fig. : Chromatogram Trial 1
Observation: Peak elutes at RT about 6.8 minutes, as 28 minutes run time is too long, need to develop method with shorter run time.
2. Chromatography same as Trial-2
Table : Gradient Programme Trial 2
|
Time ( minutes ) |
Mobile phase-A |
Mobile phase-B |
|
0 |
45 |
55 |
|
6 |
25 |
75 |
|
24 |
0 |
100 |
|
48 |
0 |
100 |
|
92 |
45 |
55 |
|
110 |
45 |
55 |
Changes Made:
1. Gradient Change
2. Column Temperature Change From 25°C to 30°C
3. Injection Volume changes from 5µL to 10 µL.
: Chromatogram Trial 2
Observation: Interference Observed in Blank solution. Run Time and RT is too long.
Chromatography same as Trial-3
Table : Gradient Programme Trial 3
|
Time (minutes) |
Mobile phase-A |
Mobile phase-B |
|
0 |
45 |
55 |
|
20 |
25 |
75 |
|
39.5 |
0 |
100 |
|
52 |
0 |
100 |
|
88 |
45 |
55 |
|
110 |
45 |
55 |
Changes Made : Buffer Changed
MP A: 1.36 g of Potassium dihydrogen phosphate in 1000 Ml of Water. Adjust pH 4.2 with TFA. MP B: Acetonitrile : Water (95:05v/v) Gradient Change
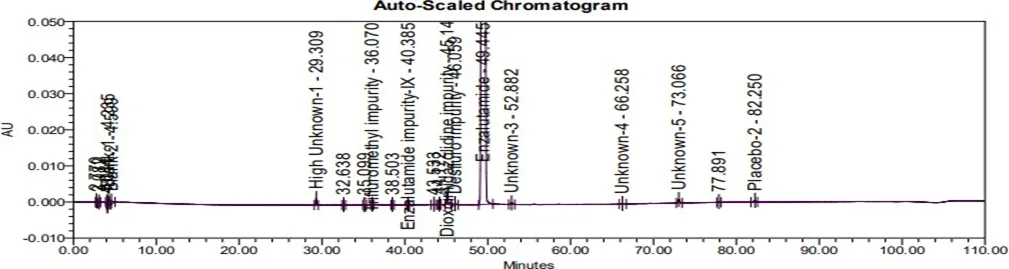
Fig. : Chromatogram Trial 3
Observation:
Interference observed in Blank Solution
Chromatography Same as Trial-6
MP-A : 1 ml of perchloric acid in 1000 ml of water MP-B : Acetonitrile: Water (95:05v/v)
Column: Inert sustain C18, 150 x 4.6 mm, 5.0µm Flow Rate: 1.2 ml/ minute
Wavelength: 210 nm Injection Volume: 5µL Coloumn Temperature: 25 °C Run Time: 17 minutes
Table : Gradient Programme Trial 6
|
Time ( minutes ) |
Mobile phase-A |
Mobile phase-B |
|
0 |
50 |
50 |
|
10 |
50 |
50 |
|
10.5 |
0 |
100 |
|
12.5 |
0 |
100 |
|
13 |
50 |
50 |
|
17 |
50 |
50 |
Changes Made:
Column change Inert sustain C18, 150 x 4.6 mm, 5.0µm
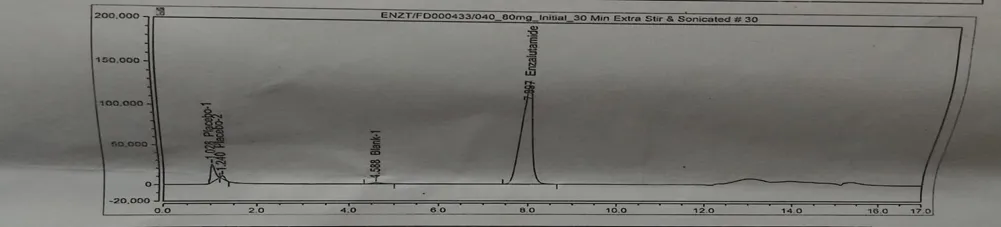
Fig. : Chromatogram Trial 6
Observation: Method found ok
HPLC Method Validation:
Specificity:
Reference Chromatograms for Specificity:
Blank Solution:
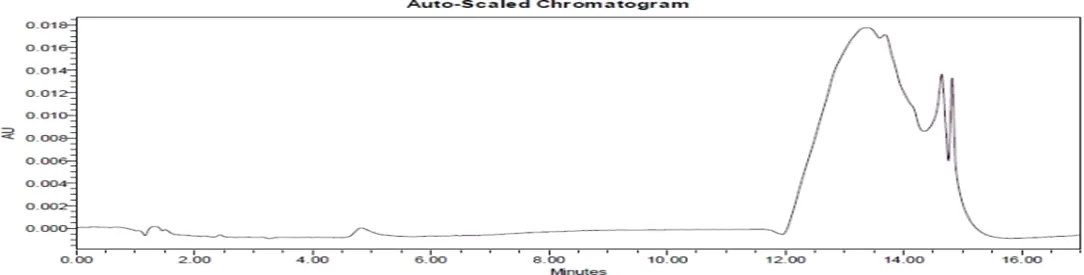
Fig. : Chromatogram of Blank Solution
Placebo Solution:
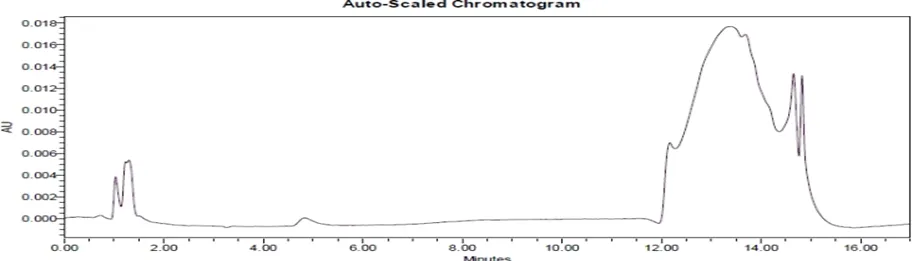
Fig. No. 11 : Chromatogram of Placebo Solution
Standard Solution:
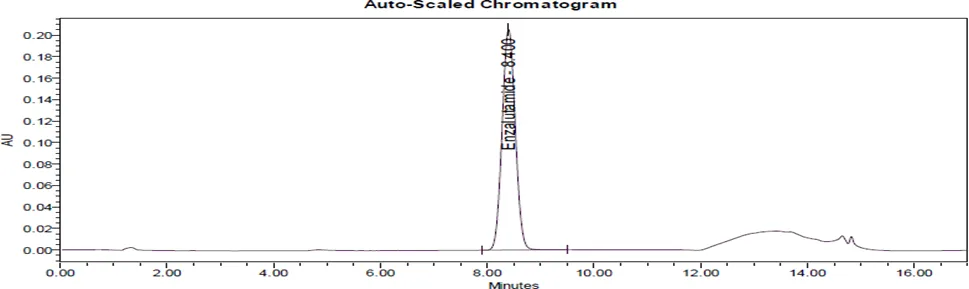
Fig. : Chromatogram of Standard Solution
Control Sample:
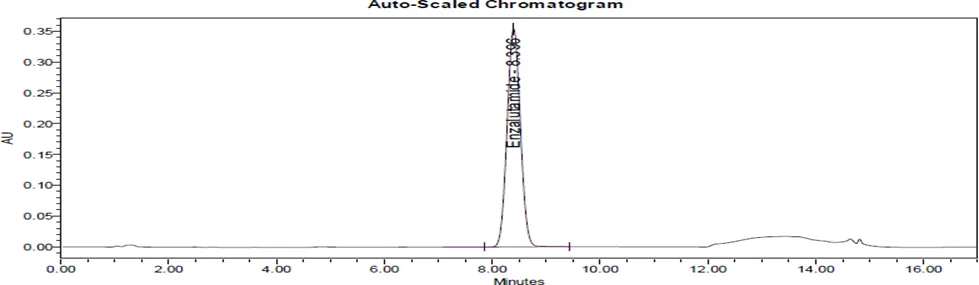
Fig. : Chromatogram of Control Sample
Conclusion:
All system suitability criteria found within acceptance limit, there was no interference found at the retention time of main peak due to blank, placebo and known impurities at the retention time of main peak. Hence the selected method is specific.
Linearity & Range: Prepared standard stock solution of Enzalutamide and dilute suitably to obtain desired concentration at about 10%, 25%, 50%, 100%, 150% and 200%.
|
Sr. No |
Level (%) |
Concentration (mcg/mL) |
Area |
|
1 |
10% |
4.801 |
172180 |
|
2 |
25% |
12.483 |
452627 |
|
3 |
50% |
24.006 |
861985 |
|
4 |
100% |
48.012 |
1724022 |
|
5 |
150% |
72.017 |
2590220 |
|
6 |
200% |
96.023 |
3433885 |
|
|
Slope |
35791.180 |
|
|
Intercept |
4057.5464 |
||
|
Correlation Coefficient (CC) |
1.0000 |
||
Conclusion:
It is concluded from the above observations that the method is linear over the range from 10 % to 200
% of specification level for Enzalutamide.
Accuracy:
The accuracy of an analytical procedure performed at three levels (20%, 100% and 200%)
|
Level |
Amount Added |
Amount Found |
%Recovery |
|
20% |
318.15 |
323.65 |
101.7 |
|
100% |
1589.49 |
1610.14 |
101.3 |
|
200% |
2384.34 |
2420.92 |
101.5 |
Level 20%:

Fig. No.: Chromatogram of Accuracy Level 20%
Level 100%:
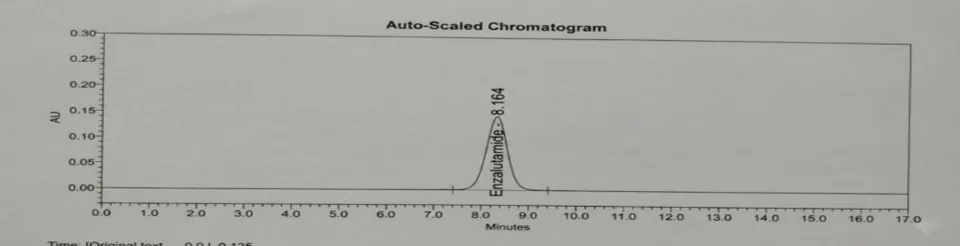
Fig. : Chromatogram of Accuracy Level 100%
Level 200%:
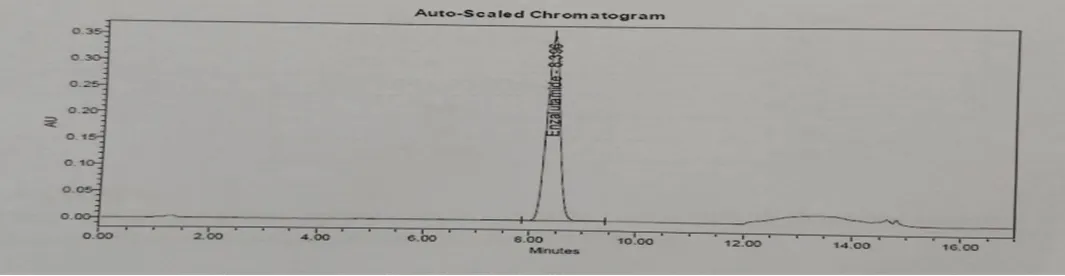
Fig. No. 17 : Chromatogram of Accuracy Level 200%
Conclusion:
The % Recovery found within the acceptance criteria hence the given method is found accurate.
Precision and Repeatability:
System Precision:
A standard solution was made as suggested test method for precision studies of the system. The HPLC system received five injections in replication. The peak responses of five replicate injections should have a % RSD less than or equal to 2.0
Table No 17 : System Precision
|
Sr. No. |
Injection |
Peak Area |
|
1 |
Injection-1 |
2783864 |
|
2 |
Injection-2 |
2783773 |
|
3 |
Injection-3 |
2781448 |
|
4 |
Injection-4 |
2764584 |
|
5 |
Injection-5 |
2781232 |
|
|
Mean |
2778980.2 |
|
SD |
8142.99774 |
|
|
%RSD |
0.29 |
Conclusion:
It is concluded from above results that the system complies with the acceptance criteria of system precision.
1. Method Precision: In the precision method, the analyze the same batch sample six times perform for the consistency. This shows if a method is providing reliable results for one batch. The % RSD of the six measurements must not exceed 2.
Table : Method Precision
|
Sr. No. |
Batch No. |
% Assay |
|
1 |
Sample 1 |
97.67 |
|
2 |
Sample 2 |
96.93 |
|
3 |
Sample 3 |
97.12 |
|
4 |
Sample 4 |
97.67 |
|
5 |
Sample 5 |
96.93 |
|
6 |
Sample 6 |
97.12 |
|
|
Mean |
97.24 |
|
SD |
0.384 |
|
|
%RSD |
0.39 |
Observation:
%RSD of Test Solution Observed 0.39 (Acceptance Criteria NMT 2.0%)
LOD &LOQ:
The limit of quantification refers to the smallest quantity of a substance in a sample that can be accurately and precisely measured. The limit of quantification is the minimum quantity of a substance in a specimen that can be accurately and precisely measured. The LOD and LOQ were determined individually using a calibration curve. The standard deviation of the y-intercept of the regression line can serve as the standard deviation (SD).
LOD =3.3xσ/s LOQ =10xσ/s
Where, σ = Standard deviation of y intercept of regression lines, S = Slope of calibration curve
LOD was found to be 0.011μg/ml LOQ was found to be 0.045μg/ml
CONCLUSION
A simple, precise, accurate, and reproducible Reverse Phase High-Performance Liquid Chromatography (RP-HPLC) method was successfully developed and validated for the quantitative estimation of Enzalutamide in tablet dosage form. The developed chromatographic method provided satisfactory separation with a well-defined peak and acceptable retention time, making it suitable for routine pharmaceutical analysis.
REFERENCES
Drugs, 78(18), 1913–1924.
Clinical pharmacokinetics, 54(10), 1057-1069.
Drugs, 78(18), 1913–1924.
Clinical pharmacokinetics, 54(10), 1057-1069.

Trupti Lade, Sarika Kumbhar, Pallavi Thombare, Sayali Chavan, RP-HPLC Method Development of Enzalutamide in Tablet Dosage Form and Its Validation, Int. J. of Pharm. Sci., 2026, Vol 4, Issue 7, 1478-1489, https://doi.org/10.5281/zenodo.21242667
 10.5281/zenodo.21242667