

We use cookies to ensure our website works properly and to personalise your experience. Cookies policy
Department of Pharmaceutical Quality Assurance, Vidya Niketan Institute of Pharmacy and Research Centre Bota, Tal- Sangamner, Dist- A. Nagar, Pin Code - 422602.
Analytical methods that can quantify the API in the presence of all the degradation products generated during the shelf life, manufacture and environmental stress conditions are required to ensure pharmaceutical products maintain their chemical integrity throughout their shelf life, which are not normally provided by standard assay methods. Stability-indicating chromatographic methods lie at the heart of quality assurance in the pharmaceutical industry, but the scientific principles underpinning their development, validation, and lifecycle management have been most dramatically revised over the last two decades, with ICH Q14 coming into force, and the revised ICH Q2(R2) in June 2024. This review critically analyzes the various mechanistic aspects for degradation of drugs under hydrolytic, oxidative degradation, degradation under light and degradation under thermal conditions, and how these forced degradation studies provide drug structural vulnerability to specificity evidence in method development. The relative analytical power of reversed-phase HPLC, UHPLC and hyphenated methods, such as LC-MS and LC-QTOF is compared and discussed in terms of resolving and characterizing structurally similar degradants. The use of Analytical Quality by Design (AQbD) principle, including Analytical Target Profiling (ATP) definition, Ishikawa and FMEA risk assessment, design of experiments (DoE) optimisation, and establishment of Method Operable Design Region (MODR) is proposed as the current methodological best practice in line with the ICH Q14 Lifecycle requirements. The expanded range of reporting, the reporting of confidence intervals and the requirements for validation under Q2(R2) are very much examined in the context of green analytical chemistry integration using standardised sustainability metrics. These methods are illustrated both broadly and translationally by applications across a range of therapeutic areas, such as cardiovascular, antidiabetic and oncology drugs, in both novel and complex dosage forms. An AI-driven method design approach, PAT integration and real-time release testing are clear emerging trends shaping the scientific direction of this field
Analytical methods for measuring pharmaceutical product quality over the shelf life of the product require more than just the detection, resolution and quantification of the API they must also be able to detect, resolve and quantify all the degradation products of the API that are chemically relevant to the product shelf life, manufacture or distribution [1]. Stability-indicating analytical methods (SIAMs) perform just this: They are validated quantitative methods that can identify changes in the quality attributes of the drug when degradation products, excipients and process impurities are present without causing mutual interference [2].
The United States Food and Drug Administration (FDA) has described a stability-indicating method as a method that is sufficiently specific and precise to measure the active ingredient without interference from degradation product(s) and the ICH Q2(R2) guideline defines a stability-indicating method as a method that can measure the active impurity in the presence of any degradation product(s) for which the method is specific, when the sample is subjected to appropriate stress conditions, such as acid, base, oxidation, thermal, and photolysis. Degradation is vital in the pharmaceutical field [3]. Therapeutic potency, presence of toxic impurities, bioavailability and immunogenic response (for biologics) are all critical parameters for patient safety that are affected by drug breakdown products. The identification and control of degradation pathways, therefore, can be considered a regulatory and scientific responsibility throughout a drug's lifecycle, from early drug development to post-approval change management. The most important part of this is forced degradation studies deliberate stress conditions applied to assure controlled breakdown which also yield a structurally rich sample matrix to validate chromatographic specificity. Stability Indicating Methods has undergone a significant development in regulations in the last decade [4].
Forced degradation is summarized within the ICH Q1 series, which includes Q1A(R2) long time and accelerated stability test, and Q1B, photostability [5]. ICH Q2(R1) and its recent update Q2(R2) and the recently effective ICH Q14 (June 2024), collectively recalibrate expectations around analytical procedure development and lifecycle management, launching new concepts like Analytical Target Profile and Method Operable Design Region, aligning chromatographic method development with the rest of the Quality by Design approach [6]. The USP general chapter (GC) 1220 (Analytical procedure lifecycle) and GC 1225 (Validation) have also been updated simultaneously, helping to further align expectations globally. In this context, Analytical Quality by Design (AQbD) concepts have evolved from being an academic concept into a regulatory requirement for stability-indicating method development, and risk-based optimisation and design of experiments (DOE) have joined the methodological mainstream of current pharmaceutical analysis. In parallel, in recent years, the attention of green analytical chemistry has added another goal to the design: sustainability, while maintaining specificity and sensitivity [7].
This review focuses on forced degradation methods, chromatographic platforms, regulatory requirements, integration with AQbD, and the future trends that are changing the face of method design, validation and maintenance in the pharmaceutical quality lifecycle.
2. Fundamentals of Drug Degradation and Stability Assessment
The molecular structure of the active pharmaceutical ingredient (API) determines the chemistry associated with the drug degradation, and therefore, the initial step in choosing a rational stability indicating method design is to understand the reactivity of the functional groups [8]. Hydrolysis is one of the main degradation pathways, occurring due to the nucleophilicity of water attacking ester, amide, lactam, lactone, carbamate, and carbonate bonds, which tend to occur at acidic and basic pH. For solutions and suspensions, ICH Q1A(R2) requires evaluation over the broad range of pH, and laboratory protocols commonly use 0.1–1 M hydrochloric acid or sulfuric acid for hydrolysis at acidic pH, and 0.1–1 M sodium hydroxide or potassium hydroxide for hydrolysis at alkaline pH, with temperature elevation to 50–70°C when hydrolysis is inadequate at room temperature within seven days [9].
Oxidative degradation is the second major pathway with predominately affecting drugs containing sulfide, thioether, aldehyde, phenolic and tertiary amine groups, and hydrogen peroxide is commonly used as an oxidising agent; other oxidising agents used in forced degradation include metal ions and radical initiators like azobisisobutyronitrile, to simulate free-radical oxidation [10]. Photolytic degradation is the degradation which takes place when a functional group, such as carbonyl, nitroaromatic, N-oxide, alkene, aryl chloride or polyene, absorbs ultraviolet or visible radiation resulting in a photochemical reaction including photo-oxidation by free radical mechanism; the maximum exposure of light recommended for confirmatory photostability studies is 6 million lux hours. Thermal degradation under dry heat is a degradation method that is performed under temperatures above 50°C, which are different from accelerated stability conditions (40°C/75%RH) and is especially relevant for solid-state dosage forms where moisture-mediated reactions do not occur but where polymorphic transitions, amorphous conversion and solid-state oxidation can take place [10].
To design forced degradation studies, it is important to note that the aim of the study should be to achieve controlled and meaningful degradation, not complete degradation. The 5–20% degradation window is considered a target for small molecule APIs that produces enough degradation products for use in specificity testing while maintaining a good chromatogram for peak resolution. Investigation outside this limits may yield secondary degradation products which are not clinically significant but will unnecessarily increase the complexity of the chromatogram [11]. For those drugs that are less soluble in water, co-solvents can be used to facilitate uniform exposure to stress reagents – the choice of co-solvent depends on the structure of the drug and the stress reagent. However, it is important to distinguish between forced degradation and formal accelerated stability testing and to avoid mixing the two. Forced degradation uses conditions significantly greater than the ICH accelerated storage conditions (40°C/75%RH) and is conducted in the early stages of method development to establish degradation pathways and to prove method specificity. Not suitable as a predictive tool for shelf-life estimation. Samples collected during the long-term and accelerated stability studies conducted under ICH Q1A(R2) under controlled temperature and humidity at specific time points are the best tools for shelf-life assignment and expiry date determination [12].
The samples prepared using forced degradation are used only to test the forced degradation method and are essential for the specificity arm of ICH Q2(R2) method validation. The understanding of these degradation fundamentals also guides formulation strategy, e.g., the presence of residual peroxides in polyethylene glycols and the alkaline microenvironment of magnesium stearate can result in additional drug product SIAM degradation variables that are not present in drug substance methods. Stress conditions and recommended reagents and expected degradation extents for different drug classes and dosage forms are summarized in Table 1 [13].
Table 1: Classification of Forced Degradation Conditions, Recommended Stress Parameters, and Typical Degradation Outcomes Across Drug Classes [14–18]
|
Stress Type |
Stress Conditions (Drug Substance) |
Reagents/Conditions |
Target Degradation (%) |
Common Susceptible Functional Groups |
Representative Drug Classes Affected |
|
Acid Hydrolysis |
0.1–1 M HCl; RT or 50–70°C; ≤7 days |
HCl/H₂SO₄ aqueous solution |
5–20 |
Esters, amides, lactones, lactams |
Beta-lactam antibiotics, ACE inhibitors, statins |
|
Base Hydrolysis |
0.1–1 M NaOH/KOH; RT or 50–70°C; ≤7 days |
NaOH/KOH aqueous solution |
5–20 |
Esters, carbamates, carbonate linkages |
NSAIDs, prodrugs, antihypertensives |
|
Oxidative |
3% H₂O₂; RT; 1–24 h |
H₂O₂; AIBN; metal ions |
5–20 |
Sulfides, thioethers, aldehydes, phenols, tertiary amines |
Sulfur-containing APIs, catecholamine derivatives |
|
Thermal (Dry Heat) |
>50°C; solid or solution; ≤7 days |
Oven/dry chamber, no humidity control |
Variable |
Thermolabile bonds, amorphous regions |
APIs prone to polymorphic conversion |
|
Photolytic |
UV (254 nm) + VIS (≥400 nm); 6 million lux h (Q1B) |
ICH Q1B-specified chamber |
5–20 |
Carbonyls, nitro groups, N-oxides, polyenes, alkenes |
Fluoroquinolones, phenothiazines, dihydropyridines |
|
Humidity |
≥75% RH; 40–50°C; applicable to solids |
Humidity chamber |
Drug-dependent |
Hygroscopic groups prone to hydrolysis |
Effervescent tablets, hygroscopic APIs |
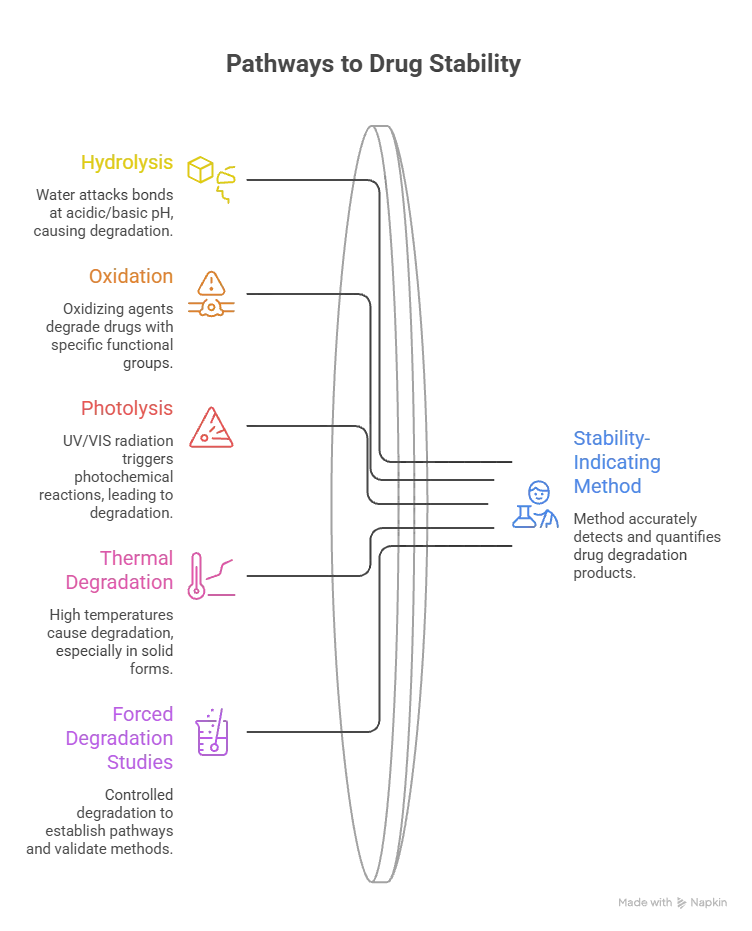
Figure 1: Pathways to determine the drug degradation study
3. Regulatory Framework Governing Stability-Indicating Methods
The regulatory framework for the development and upkeep of stability-indicating methods is complex, overlapping, and is the most significant change in two decades. The ICH Q1 series continues to be the basic reference for the design of stability testing: Q1A(R2) defines the conditions of stress and storage for long-term, accelerated and intermediate stability studies of drug substances and drug products, and Q1B is about photostability [19]. The guidelines are not a prescription of the analytical method itself, but rather the sample matrices (stressed, accelerated and long term) against which a stability-indicating method should be tested. The critical performance expectation, i.e. the analytical procedure should be able to resolve and quantify the API without being affected by degradation products of the API, is clearly stated in ICH Q2(R2), the updated version of the validation guideline which replaced ICH Q2(R1), published in 2023. Unlike its predecessor Q2(R1), Q2(R2) expands the scope of validation to include bioassays, multivariate analytical models, and non-chromatographic methods, and provides a more statistically sound approach to accuracy and precision: the reportable range, instead of the linear calibration model so common in Q2(R1) era methods [20].
The most groundbreaking change for stability-indicating method development is the release and enforcement of ICH Q14 in June 2024, the first regulatory guideline dedicated to the development of analytical procedures. ICH Q14 is applicable to new and revised analytical procedures after a risk-based approach for release, stability and other quality control applications [21]. The technology-independent document it has formally introduced, the Analytical Target Profile (ATP), contains measurable performance requirements such as acceptable measurement uncertainty, specificity, precision, etc., prior to the selection of any chromatographic method [22]. This methodology separates the analytical goal from the instrumental solution and allows for a rational choice of method and allows validation data to be compared to it. The Method Operable Design Region (MODR) is another important feature, representing a multidimensional space of chromatographic parameter values (mobile phase, flow rate, column temperature, pH) in which the method performance is consistently compliant with the ATP criteria. Critically, if changes are made within the established MODR, the method need not be submitted for regulatory review, which means that there is significant flexibility in method transfers, changing columns, or changing instruments from manufacturing location to manufacturing location [23].
The gap between guideline publication and industrial practice was found in the deployment of ATP across industries, with more than 60% of companies still in the process of implementing complete ATP deployment and defining MODR in 2024, as indicated in an ISPE/PDA industry survey. Complementing the ICH framework, in 2022 the United States Pharmacopeia added General Chapter ⟨1220⟩ Analytical Procedure Lifecycle that defines a three-stage model: design and development, validation and qualification, and a continual analytic procedure performance verification (OPPV) [24]. The systematic and prospective monitoring of method performance over the commercial life of the product on the basis of pre-defined statistical criteria is required in stage 3 OPPV consistent with the principles of ICH Q14 Lifecycle Approach and ICH Q12 Principles of Product Lifecycle Management. The new USP ⟨1221⟩ for ongoing verification and the revised USP ⟨1225⟩, published towards the end of 2025, further align USP expectations to the ICH framework. As of June 2024, the European Medicines Agency (EMA) has implemented ICH Q14 as a guideline and in March 2024, FDA published an equivalent final guidance, setting consistent expectations globally for the first time [24].
In the context of stability-indicating methods, these regulatory developments have definite consequences. The ATP must capture selectivity, sensitivity and range requirements that would be applicable to the simultaneous quantitation of API and degradants at reporting threshold concentrations as specified in ICH Q3A and Q3B impurity guidelines [25]. The breadth of the MODR must include enough compounds for the chromatographic resolution demands imposed by structurally similar degradation products, which is a much higher requirement than for cases where only a single analyte needs to be assayed with the method. Q14 (and ⟨1220⟩) also requires continuous monitoring of method performance once the method is deployed, and provides for a statistical control chart or other statistical tools for tracking the method attributes over time to detect drift prior to producing out-of-specification results [26].
4. Chromatographic Platforms for Stability-Indicating Analysis
4.1 RP-HPLC and UHPLC
The versatility of reversed-phase HPLC in drug molecules ranging from polar to moderately polar and lipophilic; the aqueous-organic mobile phase system; and the decades of experience garnered from pharmacopoeial and regulatory submissions have made it the favored platform for stability method development. The most common RP-HPLC setup consists of a C18 or C8 bonded silica stationary phase and gradient or isocratic elution with acetonitrile or methanol at acidic pH for good peak shape of basic compounds, with detection at a suitable UV wavelength (usually 210-280 nm) for the chromophoric group of the analyte. The challenge for a stability indicating method is significantly greater than the routine assay because the system should be capable of resolving the parent drug from all the degradation products formed from various stress routes, some of which may differ by only an oxygen atom from the parent molecule [27].
Literature indicates that resolution factors of 2.0 or higher between the API and nearest degradant should be considered adequate for demonstration of specificity. Ultra-high-performance liquid chromatography (UHPLC) uses stationary phases with sub-2-micron particles and high backpressures (over 1000 bar), delivering comparable and even better separation performance in terms of peak resolution and faster separation time than traditional HPLC systems, with a significant increase in sensitivity as well [28]. The other benefit of UHPLC for stability indicating applications is the ability to resolve the complex mixture of degradants in a much shorter time (which becomes more critical as pharmaceutical pipelines speed up) and also the sharpness of the peak profiles that improve the ability to detect minor degradation products, especially those present at or near ICH Q3A suggested reporting limits (0.05% daily intake for products>1 g). To ensure peak fidelity when switching between RP-HPLC and UHPLC conditions, attention must be given to the gradient dwell volume, detector response time, and rate of data acquisition. Method transfer should be done with a scientific rationale, not on an empirical basis, between HPLC and UHPLC platforms [29].
4.2 Hyphenated and Orthogonal Techniques
When chromatographic separation is not enough for the identity and purity of the peaks, orthogonal application of spectroscopic and mass spectrometric detection becomes indispensable. The PDA detector is a detector that measures the UV spectrum at every point in the chromatogram, giving a UV spectral profile for each peak of the chromatogram which enables peak purity analysis by spectral homogeneity. A peak purity of >999 on a normalised scale or a purity angle value below the purity threshold in the software integrated DA purity calculation indicates that there is no spectrally distinct co-eluting compound within the main peak. The major drawback of PDA purity assessment is its lack of ability to detect co-eluting impurities that have similar or identical UV chromophores to the parent drug, which is very common of structurally similar degradation products [30]. Coupling of mass spectrometry to the LC system (LC-MS or LC-MS/MS) surmounts this problem and allows detection of differences in m/z between co-eluting peaks regardless of whether they share a chromophoric group, making it the only orthogonal detector suitable for peak purity confirmation in complex degradant mixtures. In addition to peak purity, the platforms of LC and high-resolution LC-MS also play a key role in structural characterisation of unknown degradation products, which is a requirement when a degradant is found above the identification limits set by the ICH Q3A guidelines. Operated in positive or negative ion mode as appropriate to the ionisation characteristics of the analyte, the electrospray ionisation interface produces molecular ion adducts and characteristic fragment ions, which then can be used in conjunction with nuclear magnetic resonance data to make a structural assignment of novel degradants. Although powerful, LC-NMR is generally only used when MS fragmentation is not sufficient because of structural isomerism or low-mass ambiguity [31].
The specificity screening and structural confirmation by PDA and high-resolution MS of Elexacaftor, in a complex case, highlight how complementary the two techniques are and how the tiered approach to analysis that is present in modern regulatory submissions works in practice. The comparative features of these platforms are summarized in Table 2, including their detection modes, resolution, throughput and regulatory applications, to help practitioners make informed platform selection decisions depending on the analytical needs of their drug substance or product [32].
Table 2: Comparative Overview of Chromatographic Platforms Used in Stability-Indicating Method Development [33–36]
|
Platform |
Detection Mode |
Typical LOD Range |
Run Throughput |
Primary Application in SIAM |
Structural ID Capability |
Key Limitation |
|
RP-HPLC (C18/C8, 5 µm) |
UV, PDA |
0.01–0.1 µg/mL |
Moderate (15–40 min) |
Quantification, specificity, impurity profiling |
Peak purity via PDA only |
Co-eluting chromophorically similar impurities undetectable by UV |
|
UHPLC (sub-2 µm particles) |
UV, PDA, MS |
0.001–0.05 µg/mL |
High (3–12 min) |
Rapid impurity profiling, degradant resolution |
PDA purity; MS when hyphenated |
High backpressure; method transfer complexity |
|
LC-MS (single quadrupole) |
ESI-MS |
Sub-ng/mL |
Moderate |
Peak identity confirmation, molecular mass determination |
Molecular ion and adducts |
Limited fragmentation for structural elucidation |
|
LC-MS/MS (triple quadrupole) |
ESI-MS/MS |
Low pg/mL |
Moderate |
Quantitative impurity profiling in biological matrices |
MRM transitions for known impurities |
Requires prior knowledge of degradant structures |
|
LC-QTOF/HRMS |
ESI-HRMS |
Sub-ng/mL |
Moderate |
Novel degradant identification, mass accuracy <5 ppm |
Accurate mass; isotope pattern |
High instrument cost; data interpretation complexity |
|
LC-NMR |
NMR spectroscopy |
µg range (on-flow) |
Low |
Definitive structural characterisation of unknown degradants |
Complete structural information |
Poor sensitivity; impractical for routine QC |
5. Analytical Quality by Design in Stability-Indicating Method Development
5.1 ATP Definition, Risk Assessment, and DoE-Driven Optimization
For stability-indicating chromatographic methods, the AQbD framework starts with the definition of an Analytical Target Profile that relates the analytical purpose to measurable performance characteristics: Selectivity, to separate all the stressed degradation products, including those to be reported by the ICH Q3A guidelines, from the drug substance at their reporting levels; Precision, to ensure that the measurement uncertainty is within acceptable limits; and Sensitivity, to detect ICH Q3A reporting levels of degradation products at 0.05% relative to the drug substance. AQbD differs from the conventional method in that the parameters are not determined empirically (or from literature precedent) and then tested as fixed values but instead optimisation is a knowledge-building exercise and the result is not one single optimal set of parameters, but rather a multi-dimensional space of proven acceptable performance. After ATP definition, risk assessment tools are systematically used to identify the most critical analytical method parameters that can influence the achievement of analytical performance targets [37].
The Ishikawa cause-and-effect diagram or the fishbone diagram is a structured visualisation of all possible sources of variation, which is structured by instrument, method, analyst, environment, material, and measurement and is widely used as the first stage screening tool. Failure Mode and Effects Analysis (FMEA) is then used on each potential influencing factor to assign numeric scores reflecting the severity, frequency and detectability of each failure mode, resulting in a Risk Priority Number (RPN) that ranks the critical method parameters (CMPs) according to their potential to affect the critical analytical attributes (CAAs) of resolution, retention time, peak tailing factor, and theoretical plate count. Parameters that have RPN values that exceed a certain threshold are passed on to the experimental design stage and those with lower risks are fixed, significantly reducing the experimental load from testing all the parameters together [38]. The screening designs most frequently used are the Plackett-Burman design, which tests k factors with k+1 experiments, and Box–Behnken design, which tests 2k factors with 2k+1 experiments that allows for the investigation of interactions between factors. In a typical screening study, the following variables are studied for a stability-indicating HPLC method: the proportion of each organic phase (typically this is acetonitrile or methanol), the concentration of the buffer, the pH, the flow rate, the column temperature, and the slope of the gradient; the proportion of each organic phase is always found to be the most influential CMP for retention and resolution in reversed-phase systems. Confirmed CMPs are subsequently fed into a response surface methodology (RSM) design, typically the central composite design (CCD) or the Box-Behnken design, to model the main effect and interactions, including the quadratic terms, to create mathematical models, which enable prediction of the CAA responses in the experimental domain. The software package Design-Expert® and MODDE® are frequently used for model building and graphical optimisation. Additionally, Monte Carlo simulation has been used to probabilistically define the MODR boundaries instead of using only point estimates of the design space edge obtained from DoE results [39].
5.2 Method Operable Design Region and Robustness
Like ICH Q8 for formulation and manufacturing, once the MODR is established, it provides a range of CMP values for which the analytical procedure will meet all ATP performance criteria. It has practical application in that the changes in method made within the confirmed MODR do not need to be reguled, especially when the method is transferred to secondary manufacturing sites where the instrumentation might differ or when batches of columns or different buffer preparation procedures are used [40].
The MODR, when forwarded to the regulatory agency, is included in the analytical procedure control strategy and can be the basis for reporting the column substitution or mobile phase change at a lower regulatory change category as a post-approval change management protocol (PACMP). The robustness of the method is assessed as part of the AQbD framework, not as a validation study, and it is the traditional criteria of method robustness to minor unintentional variations that is evaluated as part of the MODR characterisation. This integrated approach overcomes the redundancy of a separate robustness test and also offers a more comprehensive and scientifically sound robustness characterisation than a conventional univariate approach [41].
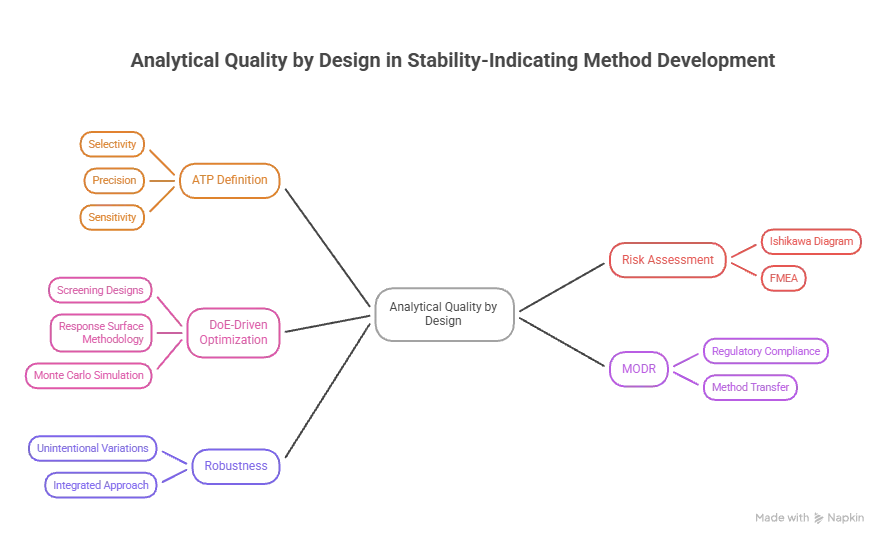
Figure 2: Analytical quality by design determining method development
6. Validation of Stability-Indicating Methods: ICH Q2(R2) Parameters and Lifecycle Considerations
The major difference between a stability-indicating method and a standard method of analysis is the increased requirement for specificity, the most scientifically critical parameter, and the only one that truly differentiates a method from the standard assay. Specificity is defined for a SIAM by the separation of the API peak from all of the degradation products that have been generated under the five standard stress conditions, all of the process-related impurities that are above the ICH Q3A reporting thresholds and all of the excipient peaks found in the drug product formulation [42]. The demonstration is carried out by injecting single stressed samples and it is shown that the API peak is not co-eluted with any degradant, which is confirmed by PDA peak purity analysis. In cases where structurally similar co-eluting degradants might have chromophoric similarity with the parent compound, mass spectrometric confirmation with an orthogonal technique is the only specificity confirmation that UV detection alone cannot provide [43].
Linearity under Q2(R2) builds upon the concept of Q2(R1) by adding the reportable range this is a range defined by specification acceptance criteria or the declared drug content which the analytical procedure shall demonstrate is linear. If a reference standard is not available, or if the parent drug is used as a surrogate to establish linearity, the linearity is carried out for each known degradant for stability-indicating impurity methods. The reporting threshold concentration to 150% of the drug specification limit for the assay is the linear dynamic range typically validated for the well-designed RP -HPLC methods and the correlation of the coefficient is routinely obtained (usually 0.999 or greater) [44]. Accuracy is evaluated by recovery experiments conducted at three or more levels with the added requirement of the Q2(R2) that recovery data be provided as a confidence interval rather than as a mean and %RSD value, which 76% of the respondents from the industry surveyed reported difficulty with because of the increased number of replicates required to obtain stable %RSD values. Precision is defined as repeatability, intermediate precision and reproducibility. Of all the precision parameters that must be reported in a HPLC method validation, repeatability measured by the same analyst on the same instrument within a single day and intermediate precision measured by different analysts on different instruments on different days are always measured [45].
The vast majority of the literature are based on the criterion % RSD ≤ 2.0% for assay level precision, and ≤ 5.0% for impurity level precision near the reporting level, although Q2(R2) reminds us that acceptance criteria must be scientifically established, appropriate for the intended use, and be predetermined. LOD and LOQ for stability-indicating methods, especially for degradation products that have to be quantified at or below 0.05% of the drug level in a high-dose drug substance, require sensitive method conditions and may require optimization of the detection wavelength, the gradient dwell time and injection volume to provide adequate signal-to-noise ratios without loss of API resolution [46].
A number of substantive changes are introduced for stability-indicating method practice when moving from Q2(R1) to Q2(R2). Multivariate analytical procedures and multivariate calibration models are now expressly mentioned in the guideline, which accepts the use of spectroscopic and array-based techniques in pharmaceutical stability assessment which is becoming more common. System suitability testing (Q2(R2) set of pre-analysis tests conducted on every analytical run to ensure that the system (instrument, column, mobile phase) is within defined limits is specifically related to the ATP performance criteria developed during the system development, providing a direct traceability chain from the ATP design to the analytical practice. In addition to SIAM data, it is expected that a mass balance demonstration will be submitted as part of a submission, which will confirm that the sum of the intact drug and all known degradants is present with the total drug input, usually within 98–102%. In the USP ⟨1220⟩ lifecycle approach, validation is just Stage 2 and Stage 3 requires continued verification of procedure performance, based on pre-defined statistical control tools applied to results obtained during routine sample analysis, which allows for prospective detection of method drift prior to impacting product release decisions [47].
7. Green Analytical Chemistry and Sustainability in Stability-Indicating Methods
The incorporation of green analytical chemistry (GAC) concepts in pharmaceutical method development is a well-recognized duty of science and institutions to minimize the environmental impact of analytical laboratories while maintaining the quality of the measurement. The 12 principles of GAC, which are similar in spirit to the 12 principles of green chemistry, but specifically applied to analytical science, encourage reduction of solvent use, elimination of hazardous reagents, minimization of wastes, minimizing energy use, and preference for direct analytical methods with minimal sample preparation [48]. In the field of stability-indicating HPLC methods, the practical implications involve using acetonitrile or ethanol-water as mobile phase instead of chlorinated solvents like dichloromethane or chloroform, using miniaturized HPLC systems (UHPLC) and minimizing reagent consumption with micro- and nano-scale injection techniques. The published methods have been evaluated against standardized methods to rate their greenness in a retrospective manner, which now has become part of method publications [48]. NEMI, the National Environmental Methods Index, is a simple four quadrant assessment consisting of the questions of whether the method produces hazardous waste, persistent and/or bioaccumulative reagents, corrosive chemicals, and/or toxic reagents, and each quadrant shaded green or red, creating a visual "fingerprint" of the method [49].
The more detailed GAPI (Green Analytical Procedure Index) is a semi-quantitative environmental profile subsequently introduced, that uses a pictogram with 15 fields that cover the whole analytical process, from sampling to detection. In 2020, the Analytical Greenness (AGREE) metric was developed by Pena-Pereira and colleagues, which takes the 12 principles of GAC and translates them into a single number from 0 to 1, with a score closer to 1 being more environmentally compatible; the optimization of cefotaxime sodium RP-HPLC method resulted in a score of 0.68, which was well above the 0.44 score of the comparator method reported in the literature, demonstrating the benefits of optimization for both analytical performance and environmental aspects as part of A QbD [50]. Introduced in 2023, BAGI moves the focus away from environmental impact and towards method practicality and applicability, as reflected in the throughput, sample preparation simplicity, instrument accessibility and cost, contributing to the "white analytical chemistry" dimension, alongside the focus of GAPI and AGREE on the environmental impact. When assessing the sustainability of current stability indicating methods, two to four of the following tools are usually combined, with the understanding that each tool highlights a unique element of sustainability, and that no single tool offers a full picture of sustainability. The assessment of drugs such as lobeglitazone, levetiracetam and ritlecitinib are published examples of a combination of all four tools: GAPI, AGREE, BAGI and AGREEprep, which have provided a practical example of the integration of multiple tools in SIAM publications. Even with the advances, there is a structural tension in the integration of GAC: For some labile molecules, the stability-indicating method will need to use gradient elution with high concentration of acetonitrile in the mobile phase and flow rates that are at least moderately high, which in turn points down on the volume-based greenness metrics. This can be achieved by replacing acetonitrile with ethanol, if selectivity allows, or by using UHPLC platforms which deliver the same resolution using significantly lower flow rates (typically 3-10 fold). The comparative features, scoring and limitations of various greenness assessment tools used for published stability indicating HPLC methods are summarized in Table 3 [51].
Table 3: Greenness and Whiteness Assessment Tools Applied to Stability-Indicating HPLC Methods [52–54]
|
Tool |
Type |
Principles Assessed |
Output Format |
Key Strength |
Key Limitation |
Representative SIAM Application |
|
NEMI |
Qualitative |
Hazardous waste, persistence, corrosivity, toxicity |
Four-quadrant pictogram (green/red) |
Rapid, simple visual assessment |
Binary; no grading of severity |
Widely used as first-tier screening in SIAM publications |
|
GAPI |
Semi-quantitative |
15 analytical process fields (sample to detection) |
15-field green/orange/red pictogram |
Holistic process coverage |
Subjective field assignment |
Applied to UHPLC ritlecitinib and antiretroviral SIAMs |
|
AGREE |
Quantitative |
12 GAC principles |
Score 0–1 (1 = greenest) |
Single numerical comparator |
Requires quantitative data inputs |
Cefotaxime DoE-HPLC: 0.68 vs. 0.44 for comparator |
|
AGREEprep |
Quantitative |
Sample preparation-specific sub-set of GAC principles |
Score 0–1 |
Targets sample prep sustainability |
Covers only pre-instrumental steps |
Used alongside AGREE in antidiabetic SIAMs |
|
BAGI |
Quantitative |
Practicality, throughput, cost, accessibility (White AC) |
Score 0–100 |
Captures non-environmental practical dimensions |
Not a greenness tool per se |
Paclitaxel HPLC method: method 3 scored 72.5 |
|
Analytical Eco-Scale |
Semi-quantitative |
Reagent hazard, waste, energy, safety |
Penalty deduction from 100 (≥75 = excellent) |
Quantitative penalty scoring |
Underweights detection-related factors |
Paclitaxel HPLC method 5: scored 90 |
8. Applications Across Drug Classes and Dosage Forms
8.1 Small Molecules: Cardiovascular, Antidiabetic, and Oncology Agents
Demand for stability-indicating chromatographic methods increases significantly when a new drug is newly approved since the degradation chemistry may not be fully understood, reference standards for impurities are not available and the regulatory dossier must be constructed from first principles. Cardiovascular agents are one of the most analytically productive classes of drugs for SIAM development, due to their large patient base, long-term use require for shelf-life of the drug and diversity in structure leading to different and sometimes unexpected degradation patterns. Stability-indicating RP-HPLC methods have been published for Finerenone, a first-in-class non-steroidal mineralocorticoid receptor antagonist, approved by the FDA for chronic kidney disease with type 2 diabetes, which have used both classical and AQbD-driven approaches. A validated stability-indicating RP-HPLC method for finerenone established the chromatographic separation on a Phenomenex C18 (4.6 × 250 mm, 5 µm) column, using a mobile phase of water, acetonitrile and triethylamine (450:550:10, pH 7) with detection at 252 nm, was linear over the range of 8–30 µg/mL for the assay and 0.2–1.4 µg/mL for unspecified impurities, and all five stress conditions acid, alkali, oxidation, photodegradation and thermal gave well-resolved degradant peaks [55].
Post-approval method management advantage of a defined MODR has been reported for finerenone SIAM development using AQbD-based approaches of Plackett-Burman screening and CCD optimisation. In the antidiabetic therapeutic area, the number of fixed-dose combinations (FDCs) has increased, especially combinations of SGLT2 inhibitors with DPP-4 inhibitors or with metformin, leading to a methodologically complex analytical landscape where the SIAM has to solve each component as well as its degradants without chromatographic overlap. Validated (RP-HPLC) triple drug combinations (metformin hydrochloride, linagliptin and dapagliflozin) have been reported with a linearity range of 20–140 µg/mL for metformin, 0.2–1.4 µg/mL for linagliptin and 0.6–2.8 µg/mL for dapagliflozin, and %RSD under 2% for precision studies and mass balance confirmation under all five stress conditions. The structural difference between the constituents of these types of FDCs usually allows for a good chromatographic separation at a single detection wavelength, but the concentration demands of the simultaneous determination of the impurities in the various constituents are very different, and the gradient slope and buffer ionic strength should be optimized accordingly [56].
Oncology drugs are a unique set of drugs due to the presence of heterocyclic core structures that are inherently photolabile or susceptible to oxidative degradation and the narrow therapeutic window for most oncology drugs, where even slight degradation has clinical consequences. A method for the characterisation of ritlecitinib, a second generation JAK3 inhibitor approved in the U.S., Japan and the EU for the treatment of severe alopecia areata, was developed using a stability-indicating UHPLC-DAD-MS/MS method with an LOD of 0.04 µg/mL and LOQ of 0.14 µg/mL, with precision (RSD ≤ 0.15%) and accuracy (99.9–100.3%), which identified four novel degradation products under forced degradation conditions and confirmed that basic degradation proceeded in 2nd order while oxidative degradation proceeded in 0th order. Larotrectinib, an FDA-approved selective TRK inhibitor for solid tumours with NTRK gene fusions, was characterised using an AQbD driven RP-HPLC SIAM using a Sunfire C18 column with a mobile phase of 0.1% orthophosphoric acid and acetonitrile (70:30, v/v) at an optimised MODR desirability value of 1 in a 5-minute total run time [57].
8.2 Complex Dosage Forms and Biological Matrices
The adoption of stability indicating methods to nanoparticulate drug delivery systems poses challenges which are not restricted to chromatography. The need for sample preparation (usually disrupting the nanocarrier matrix by organic solvent precipitation or sonication) prior to the extraction of the API means that this process must be optimized for drug extraction recovery without causing artefactual degradation. Other excipients such as poloxamers, PEG derivatives, and lecithins are important components in the formulation of nanoparticles, which should also be characterised for possible interference in the chromatographic detection in the range of the wavelength of the drug. Sample preparation methods reported for biological matrices (plasma, cell transport medium) are protein precipitation with acetonitrile and solid-phase extraction, the latter of which should also be validated for the presence of matrix effects in addition to the ICH Q2(R2) parameters [58].
9. FUTURE PERSPECTIVES
The development process of a stability indicating chromatographic method is becoming more and more of a model on which computational intelligence, real time measurement and regulatory flexibility are coming together to transform the way analytical quality is assured throughout the pharmaceutical product lifecycle. The biggest near-term opportunity is the incorporation of A.I. and machine learning into method development workflows: Machine learning algorithms, trained on past historical chromatograms, can now suggest the best mobile phase compositions, column chemistries, and gradient profiles for new chemical entities before any experiments are run, drastically reducing the time and resources required in the early stage screening phase [59]. These approaches can be used in parallel to experimental optimisation using AQbD, but their use as intelligent priors to guide the DoE into the most productive regions of the experimental domain can significantly reduce the number of CCD or Box-Behnken runs needed to define the MODR. Process Analytical Technology (PAT) tools such as near-infrared (NIR) spectroscopy, Raman spectroscopy, and in-line UV diode array sensors have been shown to be useful in continuous manufacturing processes for real-time quality monitoring and could be used to enable real-time release testing (RTRT) using PAT tools that combine with stability-indicating method concepts. Instead of the traditional end product stability test (which requires a validated off-line HPLC method to be used on a finished batch of product), RTRT requires continuous measurement of product in the process that gives real-time data on the levels of drug and impurities. PAT-integrated continuous manufacturing digital twins, which generate virtual models of manufacturing processes from real-time sensor data to improve API consistency to 99.95%, have been reported, and similar architectures can be conceptually applied to analytical systems where the performance of the chromatographic methods to be used is monitored and predicted in real time by computational models, rather than by retrospective measurement. AI/ML and PAT sensors and data analytics are predicted to lead to more autonomous real-time data analysis, a paradigm shift in pharmaceutical quality control. Miniaturisation (microfluidic HPLC chips and portable UHPLC systems are examples) of chromatographic platforms is evolving as tools for point-of-care and field-deployable pharmaceutical quality testing and validation protocols are being developed. These platforms decrease solvent consumption by several orders of magnitude from that of traditional benchtop HPLC systems, and are well aligned with the sustainability goals that green analytical chemistry metrics are designed to measure. In the field of personalised medicine, where small batch manufacturing is used, the versatility of the portable analytical system provides analytical coverage which is more difficult to obtain with the laboratory scale instruments [60].
CONCLUSION
Stability-indicating chromatographic methods play a fundamental role in pharmaceutical quality assurance and their scientific underpinning has been significantly enhanced by a combination of AQbD principles, ICH Q14 lifecycle approaches and the broader validation requirements of Q2(R2). Forced degradation strategies will give you the understanding of drug degradation chemistry, that would lead to method specificity, and DoE-driven optimisation and MODR definition will give you the regulatory flexibility that is required for post-approval method management. The drive for sustainability (which can be evaluated using a variety of greenness metrics) and the development of new computational and miniaturisation technologies are now simultaneously changing the nature, design and management of stability-indicating methods. Together, these developments place the stability-indicating chromatographic method firmly not only as a tool for compliance, but as a science-based, lifecycle-driven analytical tool of central importance for the quality mission of today's pharmaceutical science.
REFERENCES


Dnyaneshwar Garkal, Kiran Shinde, Stability-Indicating Chromatographic Methods for Pharmaceutical Quality Control: Forced Degradation Strategies, ICH Compliance and Emerging Trends, Int. J. of Pharm. Sci., 2026, Vol 4, Issue 7, 1386-1406, https://doi.org/10.5281/zenodo.21242045
 10.5281/zenodo.21242045