
We use cookies to ensure our website works properly and to personalise your experience. Cookies policy
Rajgad Dnyanpeeth's College of Pharmacy, Bhor, Pune 412206, India
A simple, accurate, precise, and robust reverse-phase high-performance liquid chromatography (RP-HPLC) method was developed and validated for the simultaneous estimation of Decitabine and Cedazuridine in pharmaceutical dosage form. Chromatographic separation was achieved on a C18 column using a mobile phase consisting of methanol and potassium dihydrogen phosphate buffer (70:30 v/v) with pH adjusted to 4.0. The flow rate was maintained at 1.0 mL/min and detection was carried out at 240 nm using a UV detector. Decitabine and Cedazuridine were well resolved with retention times of approximately 3.83 and 6.20 minutes, respectively. The developed method was validated in accordance with ICH Q2(R1) guidelines for parameters including specificity, linearity, accuracy, precision, robustness, limit of detection (LOD), and limit of quantification (LOQ). The method showed good linearity over the concentration range of 5–30 µg/mL for both drugs, with correlation coefficients greater than 0.998. Accuracy studies demonstrated satisfactory recovery values, indicating the reliability of the method. Precision studies revealed low %RSD values, confirming good repeatability and intermediate precision. The LOD and LOQ values indicated adequate sensitivity of the method. Robustness studies showed that small deliberate variations in chromatographic conditions did not significantly affect the results. The validated RP-HPLC method was successfully applied for the assay of Decitabine and Cedazuridine in marketed pharmaceutical formulations. The proposed method is simple, rapid, cost-effective, and suitable for routine quality control analysis.
Decitabine is a hypomethylating agent widely used in the treatment of myelodysplastic syndromes and acute myeloid leukemia due to its ability to inhibit DNA methyltransferase, resulting in reactivation of tumor suppressor genes. However, its clinical application is limited by rapid degradation caused by cytidine deaminase. Cedazuridine, a cytidine deaminase inhibitor, is co-administered with decitabine to enhance its oral bioavailability and therapeutic effectiveness. The fixed-dose combination of Decitabine and Cedazuridine has gained significant importance in modern anticancer therapy, necessitating reliable analytical methods for quality control and regulatory compliance.1
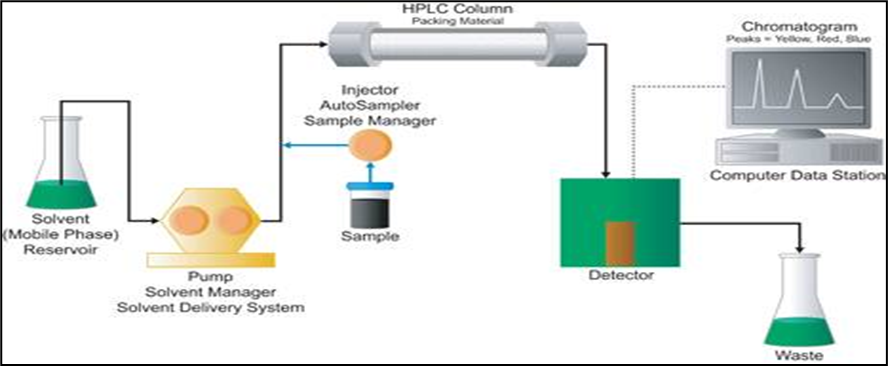
Figure 1: Components of HPLC 3
Accurate quantification of active pharmaceutical ingredients in combined dosage forms is a critical requirement during drug development, manufacturing, and routine quality assurance. High-performance liquid chromatography (HPLC) is one of the most preferred analytical techniques for such purposes due to its high sensitivity, precision, and reproducibility.2 Although several analytical methods have been reported for the individual estimation of Decitabine and Cedazuridine, limited validated methods are available for their simultaneous estimation in combined pharmaceutical dosage forms.3
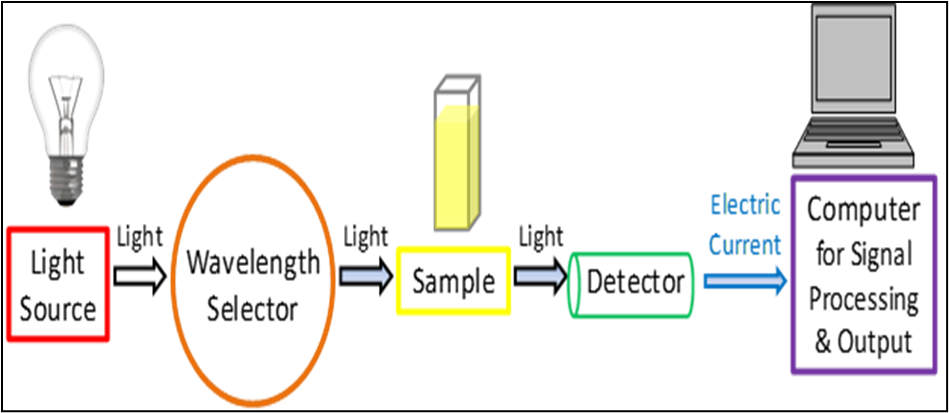
Figure 2: Components in a UV-Vis spectroscopy 4
Therefore, there is a need to develop a simple, rapid, and cost-effective RP-HPLC method capable of simultaneously estimating Decitabine and Cedazuridine with adequate resolution and accuracy. The present study aims to develop and validate a robust RP-HPLC method for the simultaneous estimation of Decitabine and Cedazuridine in pharmaceutical dosage form in accordance with ICH Q2(R1) guidelines. The developed method is intended to be suitable for routine quality control analysis and formulation assessment.
MATERIALS AND METHODS
Chemicals and Reagents:
Instrumentation :
Chromatographic analysis was performed using a Shimadzu LC-2030 HPLC system equipped with a quaternary pump, autosampler, UV–Visible detector, and LabSolutions software. A Kromasil C18 column (250 × 4.6 mm, 5 µm particle size) was used for separation. A calibrated pH meter (Mettler Toledo), analytical balance, and ultrasonic bath were used for sample preparation.
Table No. 1 List of instruments
|
Sr. No. |
Name of Equipment’s/ Instruments |
Model /Specification |
Manufacturer |
|
1
|
HPLC |
LC2030 |
Shimadzu (I Prominence Plus) |
|
Pump |
PU2030 |
||
|
Sample Injection Port |
Autosampler |
||
|
UV/Vis Detector |
UV 2030 plus |
||
|
Software |
LabSoltuion |
||
|
2 |
pH Meter |
F20 |
Mettler Toledo |
|
3 |
Balance |
AY-120 |
Mettler Toledo |
|
4 |
Sonicator |
UCB-40 |
Rolex |
|
5 |
Deep Freezer |
- |
Blue Star |
|
6 |
Refrigerator |
- |
Godrej |
Chromatographic Conditions
Separation was achieved on a C18 column using a mobile phase consisting of methanol and potassium dihydrogen phosphate buffer in the ratio of 70:30 (v/v), with the pH adjusted to 4.0 using orthophosphoric acid. The mobile phase was filtered and degassed prior to use. The flow rate was maintained at 1.0 mL/min and detection was carried out at 240 nm. The injection volume was 20 µL and the analysis was performed at ambient temperature. 7
Preparation of Standard Solutions
Accurately weighed quantities of Decitabine and Cedazuridine working standards were transferred to a volumetric flask and dissolved in the mobile phase. The volume was adjusted with the same solvent to obtain stock solutions. Appropriate dilutions were made from the stock solutions using the mobile phase to obtain working standard solutions within the linearity range. 8
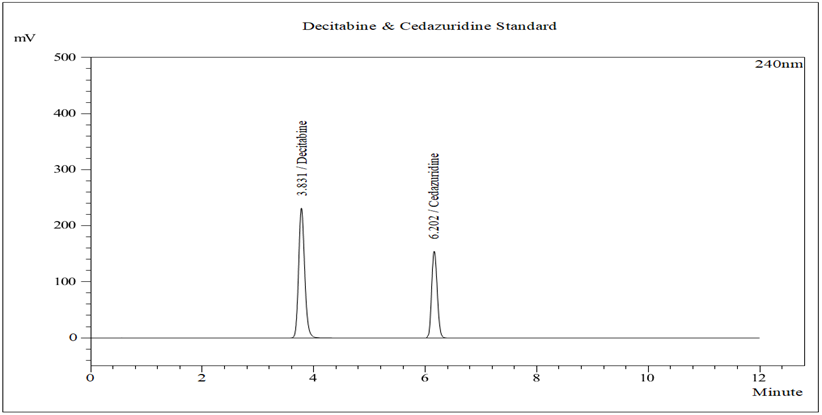
Figure 3: Typical chromatogram of Standard
Preparation of Sample Solution
An accurately weighed quantity of the marketed formulation equivalent to the labeled amount of Decitabine and Cedazuridine was transferred into a volumetric flask containing mobile phase. The solution was sonicated for complete extraction of the drugs and diluted to volume with mobile phase. The resulting solution was filtered through a 0.45 µm membrane filter and further diluted to obtain the required concentration for analysis.

Figure 4: Typical chromatogram of Sample
Method Validation
The developed RP-HPLC method was validated in accordance with ICH Q2(R1) guidelines. Validation parameters included specificity, linearity, accuracy, precision, limit of detection (LOD), limit of quantification (LOQ), robustness, and system suitability. Linearity was evaluated by analyzing standard solutions at different concentration levels and constructing calibration curves. Accuracy was assessed by recovery studies at different concentration levels. Precision was evaluated in terms of repeatability and intermediate precision, and robustness was studied by making small deliberate changes in chromatographic conditions.
RESULTS AND DISCUSSION
Method Development and Optimization
The RP-HPLC method was systematically optimized to achieve efficient separation of Decitabine and Cedazuridine with good peak shape, resolution, and acceptable retention times. Several mobile phase compositions were evaluated using different ratios of organic solvents and aqueous phases. Initial trials using acetonitrile–water and methanol–water combinations resulted in poor resolution and peak splitting for one or both drugs. Optimization of the mobile phase composition and pH led to the selection of methanol and potassium dihydrogen phosphate buffer (70:30 v/v) adjusted to pH 4.0, which provided symmetrical peaks, adequate theoretical plates, and satisfactory resolution between the analytes.
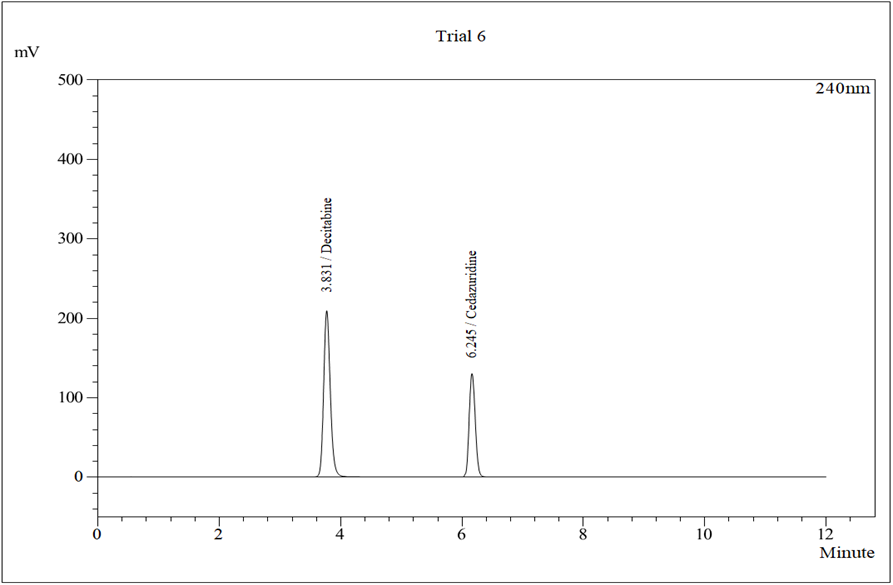
Figure 5: Typical Chromatogram Trial 6
Table No.2: Chromatographic Condition for Trial-6
|
Mobile phase |
Sodium phosphate buffer: Methanol : Acetonitrile (20:40:40 v/v/v) pH adjusted to 3.5 |
|
Selection of column |
Kromasil C18 (4.6mm x 250mm, 5µ particle size) column |
|
Flow rate |
1.0 ml/min |
|
Column temperature |
Room Temperature |
|
Detection wavelength |
240nm |
|
Conclusion |
Good Peak Properties, Less retention time and great resolution in both peak, Optimized Chromatographic condition. |
Chromatographic separation on a Kromasil C18 column under optimized conditions resulted in well-resolved peaks with retention times of approximately 3.83 minutes for Decitabine and 6.20 minutes for Cedazuridine. The total run time was short, making the method suitable for routine quality control analysis.
Specificity
Specificity of the method was confirmed by analyzing blank, standard, and sample solutions. No interfering peaks were observed at the retention times of Decitabine and Cedazuridine, indicating that common excipients present in the pharmaceutical formulation did not interfere with the analysis. The method demonstrated its ability to unequivocally assess both analytes in the presence of formulation components.
Table 3: Specificity of Decitabine
|
Specificity |
||||
|
Sample |
Label Claim (mg) |
Amount Found |
Recovery |
Retention Time |
|
Infusion |
44 |
43.91 |
99.79545 |
3.831 |
|
Infusion |
100 |
99.91 |
99.91 |
6.201 |
Linearity
Linearity was evaluated over a concentration range of 5–30 µg/mL for both Decitabine and Cedazuridine. Calibration curves were constructed by plotting peak area versus concentration. A linear relationship was observed across the studied range with correlation coefficients (R²) of 0.999 for Decitabine and 0.998 for Cedazuridine, demonstrating excellent linearity of the method.
Table 4: Linearity of Decitabine and Cedazuridine
|
Sr. No. |
Injection |
Peak Area |
|||
|
Concentration (µg/ml) |
Decitabine |
Concentration (µg/ml) |
Cedazuridine |
||
|
1 |
1 |
12 |
1425368 |
5 |
986476 |
|
2 |
2 |
24 |
2850736 |
10 |
1972952 |
|
3 |
3 |
36 |
4226104 |
15 |
2909428 |
|
4 |
4 |
48 |
5701472 |
20 |
3945904 |
|
5 |
5 |
60 |
7126840 |
25 |
4932380 |
|
6 |
6 |
72 |
8552208 |
30 |
5918856 |
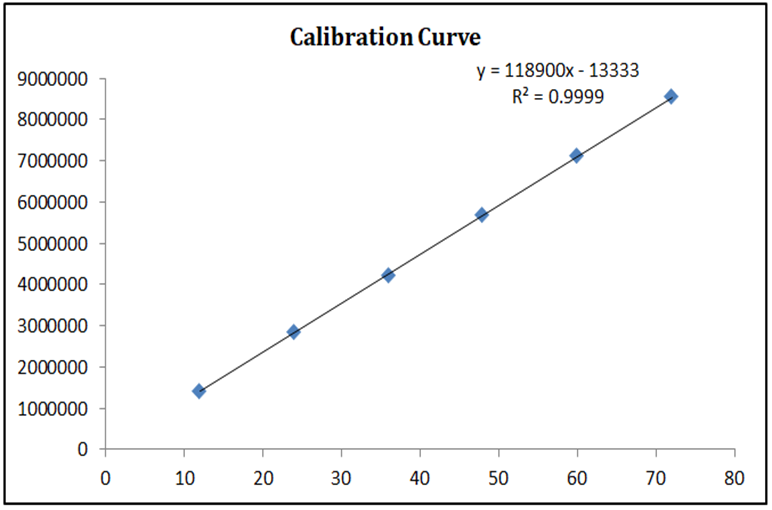
Figure 6: Calibration Curve of Decitabine
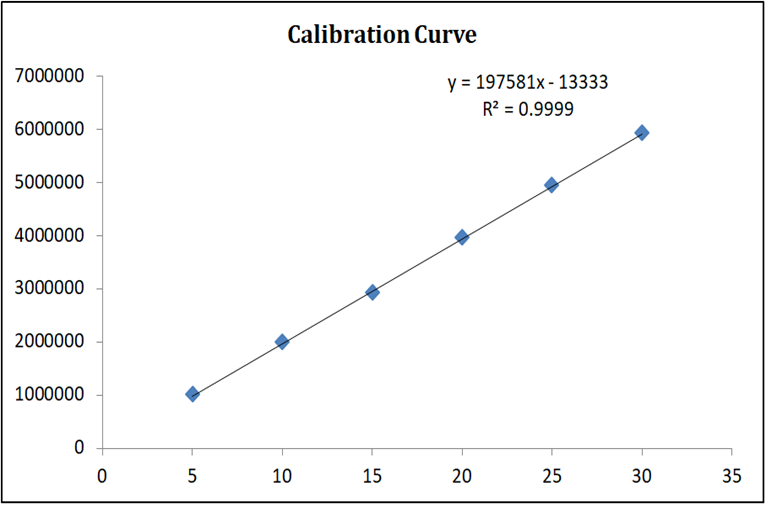
Figure 7: Calibration Curve of Cedazuridine
Accuracy
Accuracy of the method was assessed by recovery studies using the standard addition technique at different concentration levels. The percentage recovery values for both drugs were found to be within acceptable limits, indicating that the method is accurate and free from matrix interference. The low variability in recovery results further confirms the reliability of the proposed method.
Table 5: Recovery study for Decitabine
|
Accuracy |
||||
|
Sr. No |
Concentration (μg/mL) |
Peak area |
Found Concentration (μg/mL) |
% Recovery |
|
1 |
38.4 |
4549059.2 |
38.39 |
99.97 |
|
2 |
48 |
5686324 |
47.99 |
99.98 |
|
3 |
57.6 |
2843162 |
57.69 |
100.15 |
Table 6: Recovery study for Cedazuridine
|
Accuracy |
||||
|
Sr. No |
Concentration (μg/mL) |
Peak area |
Found Concentration (μg/mL) |
% Recovery |
|
1 |
16 |
3144604.8 |
15.99 |
99.92 |
|
2 |
20 |
3930756 |
19.99 |
99.95 |
|
3 |
24 |
4716907.2 |
24.09 |
100.36 |
Precision
Precision of the method was evaluated in terms of repeatability (intra-day precision) and intermediate precision (inter-day precision). The %RSD values obtained for both drugs were less than 2%, demonstrating good precision and reproducibility of the method under normal operating conditions.
Table 7: Intra Day & Inter Day Precision of Decitabine
|
Precision |
|||
|
Sr. No |
Concentration (μg/mL) |
Intraday |
Interday |
|
1 |
48 |
5706977 |
5756977 |
|
2 |
48 |
5699828 |
5767178 |
|
3 |
48 |
5704507 |
5828392 |
|
4 |
48 |
5685800 |
5843862 |
|
5 |
48 |
5756719 |
5853760 |
|
6 |
48 |
5704460 |
5863641 |
|
Average |
5709715.2 |
5818968 |
|
|
Standard Deviation |
22140.80 |
41712.85 |
|
|
RSD% |
0.3878 |
0.717 |
|
Table 8: Intra Day & Inter Day Precision of Cedazuridine
|
Precision |
|||
|
Sr. No |
Concentration (μg/mL) |
Intraday |
Interday |
|
1 |
20 |
3951409 |
4001409 |
|
2 |
20 |
3944260 |
4011610 |
|
3 |
20 |
3948939 |
4072824 |
|
4 |
20 |
3930232 |
4088294 |
|
5 |
20 |
4001151 |
4098192 |
|
6 |
20 |
3948892 |
4108073 |
|
Average |
5709715.2 |
3954147.2 |
|
|
Standard Deviation |
22140.80 |
22140.80 |
|
|
RSD% |
0.3878 |
0.5599 |
|
Limit of Detection and Limit of Quantification
The sensitivity of the method was determined by calculating the limit of detection (LOD) and limit of quantification (LOQ). The LOD values were found to be 0.6280 µg/mL for Decitabine and 0.3779 µg/mL for Cedazuridine, while the LOQ values were 1.9029 µg/mL and 1.1451 µg/mL, respectively. These results indicate that the method is sufficiently sensitive for the estimation of both drugs in pharmaceutical dosage forms.
LOD=3.3σS…………….. equation 1
Where, σ – standard deviation
S – Slope of calibration curve
LOQ=10 σS …………….. equation 2
Where, σ – standard deviation
S – Slope of calibration curve
Table 9: LOD & LOQ of Decitabine and Cedazuridine
|
LOD & LOQ |
|||
|
1 |
LOD (μg/mL) |
0.6280 |
0.3779 |
|
2 |
LOQ (μg/mL) |
1.9029 |
1.1451 |
Robustness
Robustness was evaluated by making small deliberate variations in chromatographic conditions such as flow rate, mobile phase composition, and detection wavelength. These changes did not produce significant variations in retention time or peak area, confirming the robustness and reliability of the developed method.
Table 10: Robustness of Decitabine
|
Robustness |
|||||
|
Sr. No |
Parameter |
Response |
Parameter |
Response |
|
|
Methanol: Potassium Di. Phosphate buffer |
Retention Time (min) |
Detection Wavelength |
Peak Area |
||
|
(V/V) |
(nm) |
||||
|
1 |
69 |
31 |
3.734 |
238 |
5643345 |
|
2 |
70 |
30 |
3.831 |
240 |
5701660 |
|
3 |
71 |
29 |
3.93 |
242 |
5734924 |
|
Average |
3.832 |
Average |
5693310 |
||
|
Standard Deviation |
0.080 |
Standard Deviation |
37850.36 |
||
|
RSD% |
2.088 |
RSD% |
0.665 |
||
|
Flow Rate |
Retention Time (min) |
pH of Buffer |
Peak Area |
||
|
(mL/min) |
(mmol/L) |
||||
|
1 |
0.9 |
3.962 |
3.8 |
5729732 |
|
|
2 |
1 |
3.831 |
4 |
5701833 |
|
|
3 |
1.1 |
3.8269 |
4.2 |
5626212 |
|
|
Average |
3.873 |
Average |
5685926 |
||
|
Standard Deviation |
0.0627 |
Standard Deviation |
43733.13 |
||
|
RSD% |
1.620 |
RSD% |
0.7691 |
||
Table 11: Robustness of Cedazuridine
|
Robustness |
|||||
|
Sr. No |
Parameter |
Response |
Parameter |
Response |
|
|
Methanol: Potassium Di. Phosphate buffer |
Retention Time (min) |
Detection Wavelength |
Peak Area |
||
|
(V/V) |
(nm) |
||||
|
1 |
69 |
31 |
6.104 |
238 |
3887777 |
|
2 |
70 |
30 |
6.201 |
240 |
3946092 |
|
3 |
71 |
29 |
6.3 |
242 |
3979356 |
|
Average |
6.202 |
Average |
3937742 |
||
|
Standard Deviation |
0.080 |
Standard Deviation |
37850.36 |
||
|
RSD% |
1.290 |
RSD% |
0.961 |
||
|
Flow Rate |
Retention Time (min) |
pH of Buffer |
Peak Area |
||
|
(mL/min) |
(mmol/L) |
||||
|
1 |
0.9 |
6.332 |
3.8 |
3974164 |
|
|
2 |
1 |
6.201 |
4 |
3946265 |
|
|
3 |
1.1 |
6.1969 |
4.2 |
3870644 |
|
|
Average |
6.243 |
Average |
3930358 |
||
|
Standard Deviation |
0.0627 |
Standard Deviation |
43733.13 |
||
|
RSD% |
1.005 |
RSD% |
1.1127 |
||
Application to Pharmaceutical Formulation
The validated RP-HPLC method was successfully applied to the assay of Decitabine and Cedazuridine in marketed pharmaceutical formulations. The assay results were found to be within acceptable limits, confirming the suitability of the method for routine quality control analysis.
CONCLUSION
A simple, accurate, precise, and robust RP-HPLC method was successfully developed and validated for the simultaneous estimation of Decitabine and Cedazuridine in pharmaceutical dosage form. The optimized chromatographic conditions provided good separation, acceptable retention times, and satisfactory peak symmetry for both drugs. The method was validated in accordance with ICH Q2(R1) guidelines and demonstrated excellent linearity, accuracy, precision, sensitivity, specificity, and robustness. The validated method was effectively applied to the analysis of marketed formulations, confirming its suitability for routine quality control and formulation analysis. Owing to its simplicity, rapid analysis time, and cost-effectiveness, the proposed RP-HPLC method can be reliably employed in pharmaceutical quality assurance laboratories.
REFERENCES

Dattatray Yadav, Dr. Deepak Kardile, Dr. Vishwas Bhagat, Tushar Shinde, Dr. Rajkumar Shete, Development and Validation of RP-HPLC Method for the Simultaneous Estimation of Decitabine and Cedazuridine in Pharmaceutical Dosage Form, Int. J. of Pharm. Sci., 2025, Vol 3, Issue 12, 3377-3386. https://doi.org/10.5281/zenodo.18017106
 10.5281/zenodo.18017106