
We use cookies to ensure our website works properly and to personalise your experience. Cookies policy
Department of Quality Assurance, Sandip Institute of Pharmaceutical Sciences, Mahiravani, Nashik 422213.
In this study, a novel, selective, sensitive, reliable, accurate, and robust RP-HPLC technique has been successfully developed and validated for simultaneous analysis of Amlodipine (AML) and Chlorthalidone (CHL) in their bulk powder and tablet formulation. Chromatographic analysis was carried out by HPLC system integrated with LC Solution software with Agilent Zorbax C18 column (250 × 4.6 mm, 5 µm). The maximum wavelength (?max) at 242 nm. A mobile phase composed of 0.01 M buffer and acetonitrile (50:50v/v) was delivered with a flow rate of 1.0 mL/min. Under these conditions, Amlodipine (AML) and Chlorthalidone (CHL) exhibited retention times of about 3.0 min and 5.8 min, respectively. Validation of method was performed by assessing its linearity, accuracy, precision, and specificity. Linearity of the developed method with a coefficient of correlation for the standard curve is 0.9997 and 0.9996 for Amlodipine and Chlorthalidone respectively. The RSD for the precision of the method were found less than 2.0 %. The percentage recoveries of Amlodipine and Chlorthalidone were found to be 100.52 % and 100.04 % for respectively
The problem of hypertension is among the most important public health issues and the main factor contributing to the development of cardiovascular diseases. High blood pressure can lead to such dangerous pathologies as stroke, myocardial infarction, heart failure, renal disease, and other problems associated with the vascular system. Since hypertension involves various factors, monotherapy is sometimes ineffective in obtaining therapeutic results. Thus, using combination therapy that uses antihypertensive drugs with complementary mechanisms of action has proved to be an efficient approach. [1]
Amlodipine (AML) is a long-lasting calcium channel antagonist belonging to the dihydropyridines. This drug interferes with the movement of Ca2+ ions across the membrane into the cell, specifically L-type calcium channels in the vascular smooth muscle and. Chlorthalidone (CHL) belongs to the thiazides and acts upon the distal convoluted tubules of the nephron. This increases excretion of sodium and chloride in urine. Water excretion increases secondary to sodium loss. It reduces plasma volume and extracellular fluid volume. Long-term use decreases peripheral vascular resistance, thereby lowering blood pressure. Their combination provides a synergistic antihypertensive effect and widely used in the treatment of hypertension. [2,3]
Various techniques like UV spectrophotometric analysis and RP-HPLC analysis have been documented for quantitation of these medicines either individually or along with other medicines. But some of these methodologies are found lacking in certain aspects such as sensitivity, specificity, separation of degradation products, complex composition of mobile phase, long running time, large consumption of solvents, and incomplete validation process. Moreover, some methodologies were devised for multiple drugs rather than a binary drug mixture of Amlodipine (AML) and Chlorthalidone (CHL). [4,5,6]
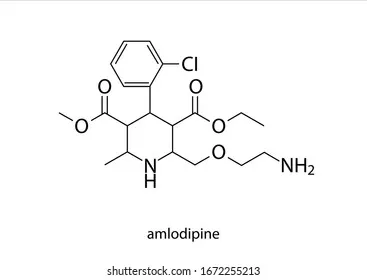
Fig.1. Structure of Amlodipine [7]
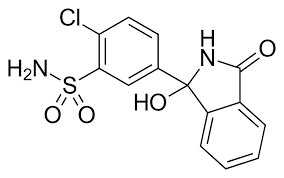
Fig.2. Structure of Chlorthalidone [7]
MATERIAL AND METHOD
The analysis was carried out on a Shimadzu LC-2010CHT HPLC system with LC Solution software for data acquisition and processing. All sample solutions were produced using a sonicator (Life Care Instruments Pvt. Ltd.) to guarantee full analyte dissolution. The WebMan analytical balance was used to accurately weigh standards and samples. To obtain efficient separation and consistent results, the entire system was run under chromatographic settings that were optimized. For selection of wavelength UV-VIS Spectrophotometry of LABMAN LMSP-UV 100B system was used.
Chemicals and reagents
The Amlodipine and Chlorthalidone’s working standard were provided by Arni Analytical, Nashik. The marketed formulation i.e. Amlodac 17.5 mg was procured from local medical store. The reagents and standards used in the study included potassium dihydrogen orthophosphate (AR grade), methanol, acetonitrile and water (HPLC grade), all procured from Fisher Scientific.
Selection of analytical wavelength:
Individual stock solutions for Amlodipine and Chlorthalidone were prepared separately. 10 mg of Amlodipine and Chlorthalidone were individually measured and dissolved in 100 mL volumetric flasks using methanol. Methanol up to 70 mL was added to the flasks containing the drugs and sonicated for 5 to 10 minutes until the substances were completely dissolved. The volumetric flasks were filled up with methanol, creating 100 µg/mL individual stock solutions for both Amlodipine and Chlorthalidone. By using methanol as blank the baseline was stabilized. The solution run in between 200- 400 nm and λmax found at 242 nm. Therefor, 242 nm is the selected wavelength for further analysis.
Chromatographic conditions:
Table. 1. Typical chromatographic conditions
|
Equipment |
Shimadzu (LC-2010CHT) |
|
Column |
Agilent Zorbax C18, (250 x 4.6 mm),5µm |
|
Mobile Phase |
0.01M buffer: Acetonitrile (50:50v/v) |
|
Flow Rate |
1.0 ml / min |
|
Wavelength |
242 nm |
|
Temperature |
40°C |
|
Injection volume |
20 µl |
Preparation of standard solution:
Take 25 mg Chlorthalidone and 10 mg Amlodipine in 100 ml of volumetric flask. Add 60 ml of Acetonitrile and sonicate for 5 min. Make the volume with Acetonitrile. Then dilution of 5 ml in 50 ml Acetonitrile.
Preparation of sample solution:
Weigh accurately 10 tablets and calculate the average weight. Crush the tablets for fine powder. Weigh the powder equal to average weight in 50 ml volumetric flask. Add 30 ml Acetonitrile and sonicate it for 10 min. Make the volume with Acetonitrile. Filter the solution by using Whatman filter paper no 41. Then dilution of 5 ml in 50 ml Acetonitrile.
Optimization of HPLC method:
The HPLC conditions were optimized using a Shimadzu LC-2010 CHT system equipped with LC Solutions chromatographic software. The system comprised a dual-plunger micro-volume pump and a UV detector, and separation was achieved on an Agilent Zorbax C18 column (250 mm × 4.6 mm, 5 µm). An isocratic mobile phase consisting of 0.01 M buffer and acetonitrile in a (50:50 v/v) ratio was employed.
Method validation:
Parameters studied for validation of analytical procedure for Amlodipine and Chlorthalidone are as follows:
System suitability:
It is performed to analyse the effectiveness and suitability of system. It is evaluated by injecting a standard solution and assessing parameters such as retention time, peak area, theoretical plates, tailing factor, and resolution. A method is deemed appropriate when %RSD of peak area is within limits (generally not more than 2%), peaks are well-resolved, and column efficiency is adequate. [8]
Specificity:
In method validation, specificity ensures that analyte peak is well separated and free from interference by another substances in sample matrix. It is typically demonstrated by analysing blank solutions, placebo mixtures, standard solutions, and stressed samples. Relative Standard Deviation of Amlodipine and Chlorthalidone must not exceed 2.0%. [8,9]
Precision:
It reflects the closeness of individual results and indicates the reproducibility of the analytical method. Precision is commonly evaluated at different levels, including repeatability, intermediate precision and reproducibility. The relative standard deviation for Amlodipine and Chlorthalidone must not exceed 2.0%. [8]
Intermediate Precision:
Precision of the analysis under repeatability conditions, that is, when separate determinations have been made on identical samples of the substance in the same place by same analyst using same apparatus during a short time interval under similar operating conditions. % Assay is NLT 90.0% and NMT 110.0%. [8,9]
Accuracy:
Accuracy refers to how close the values obtained in analysis match up to the true value of a particular concentration. The concept of accuracy is reflected by the term “closeness to the true value,” which is measured using % recovery. It is determined through recovery studies performed at three levels, namely 80%, 100%, and 120% of the nominal standard concentration. The % recovery for AML and CHL in each of the injections made from different concentrations should be within the range 98%-102%. [8,9]
Linearity:
It is assessed by analysing a set of standard solutions at different concentration levels and constructing a calibration curve of response versus concentration. The relationship is evaluated using regression analysis, and is typically expressed by the correlation coefficient. Coefficient of correlation limit for the standard curve should never be below 0.99. [8,9]
Stability of solution:
Amlodipine and Chlorthalidone solution stability in the assay method were performed by allowing the working standard to be incubated at room temperature in tightly closed volumetric flasks for 32 hours. Assay Sample Preparation and Stability Study for 24 Hours: Percentage difference between initial solution and at various intervals is NMT 2.0 %. [8,9]
Robustness:
Robustness refers to the stability of an analysis method when there are slight deliberate alterations to the parameters involved in the method. Robustness also determines the reliability of the analysis method during normal operation. Furthermore, variation in assay findings under normal conditions and those obtained after a change in wavelength was found to be not more than 2.0%. [8,11]
Limit of Detection and Limit of Quantification:
LOD is the lowest amount of a reliable analyte identified at a specified level of statistical confidence, although accurate quantification may not be possible. LOQ refers to the minimum level of the analyte that can be measured accurately and precisely. Typically, the signal-to-noise (S/N) ratio for LOD is about 3:1, while for LOQ it is approximately 10:1. Additionally, the analyte response at this level should be sufficiently consistent and accurate to allow reliable quantitative determination. [8,11]
RESULT AND DISCUSSION:
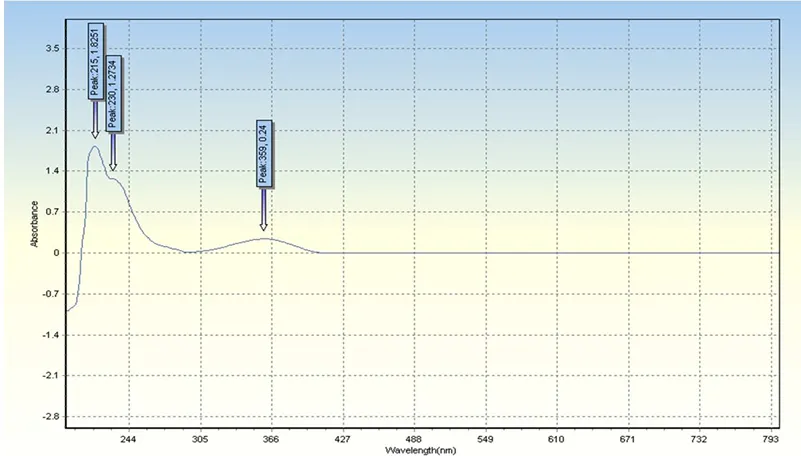
Fig.3. UV Spectra of Amlodipine and Chlorthalidone
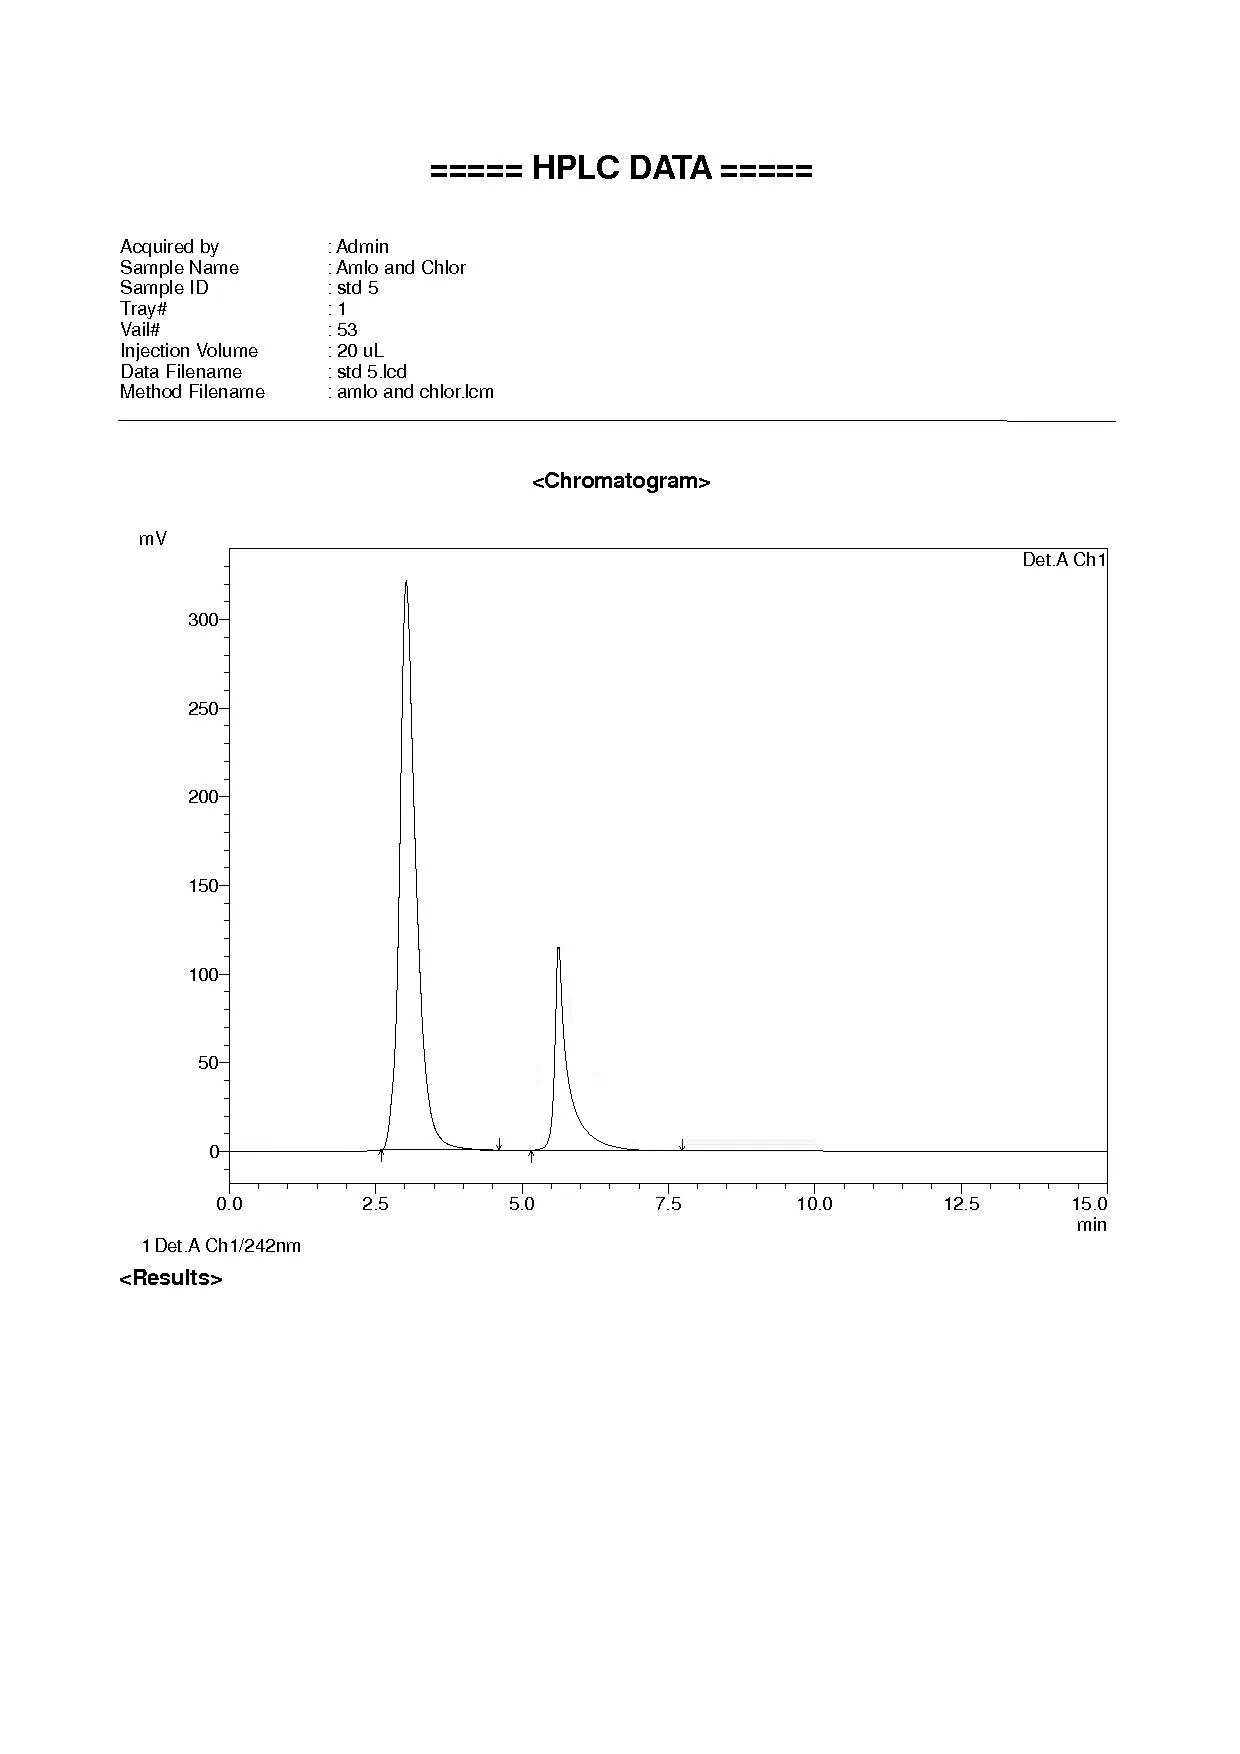
Fig.4. Optimized method chromatogram
Table.2. System suitability parameters of specificity
|
Sr. No. |
Parameters |
AML |
CHL |
|
1 |
Retention Time |
3.000 min |
5.883 min |
|
2 |
Theoretical plates |
5109.848 |
5705.414 |
|
3 |
Tailing factor |
1.552 |
1.553 |
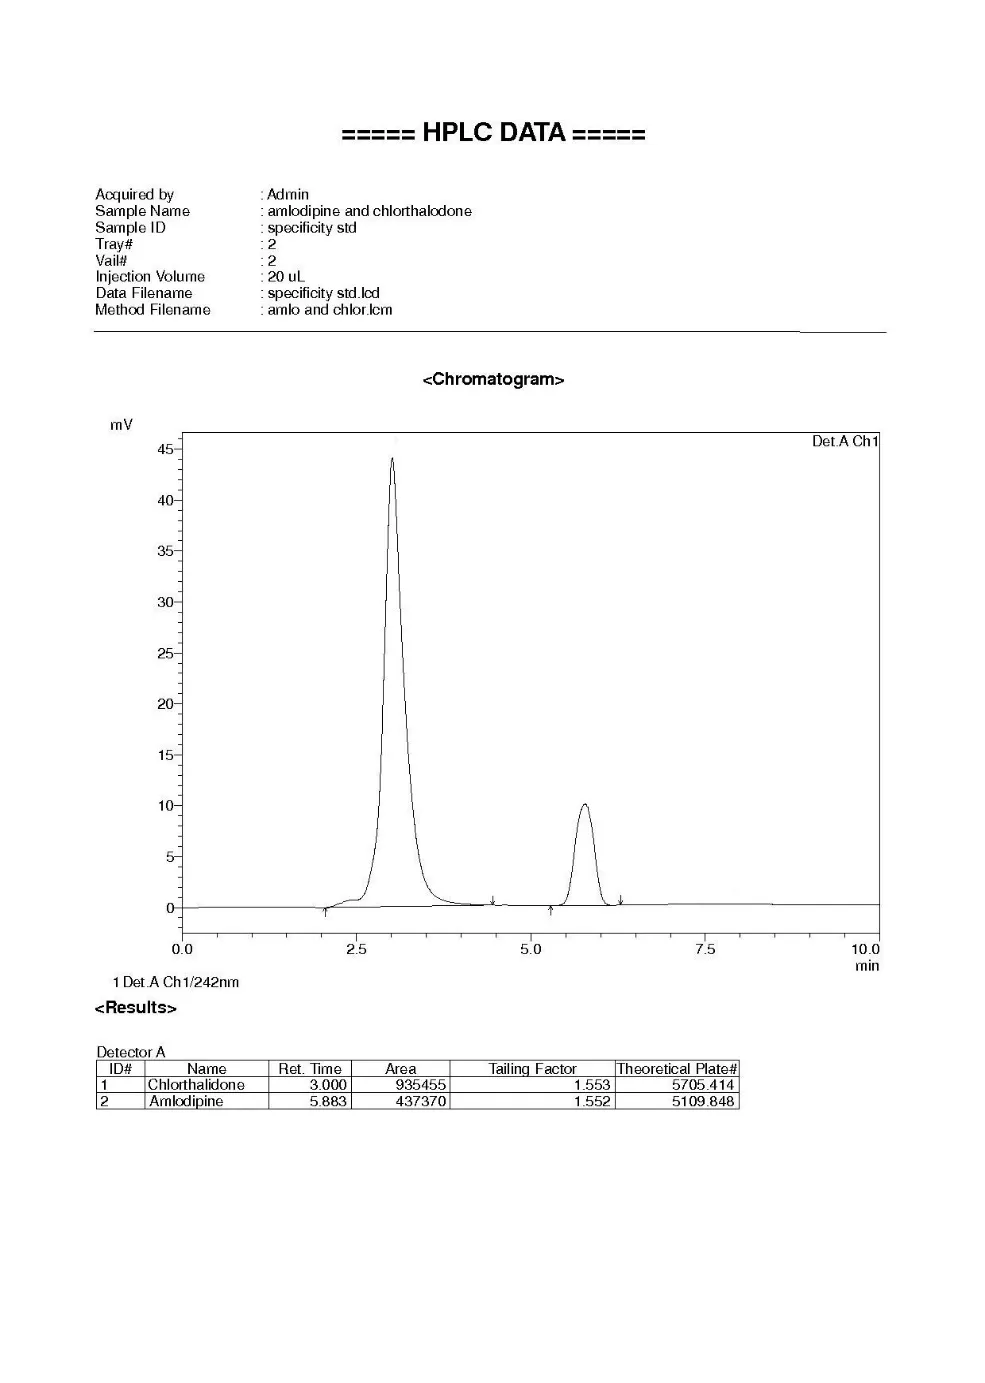
Fig.5. Chromatogram of specificity Standard
Table.3. Precision of Amlodipine and Chlorthalidone
|
Sr. No |
Area |
% Assay |
||
|
CHL |
AML |
CHL |
AML |
|
|
1 |
914914 |
419770 |
100.55 |
100.85 |
|
2 |
914724 |
419274 |
100.53 |
100.73 |
|
3 |
913502 |
417455 |
100.39 |
100.3 |
|
Average |
914380 |
418833 |
100.49 |
100.63 |
|
Std.dev |
766 |
1218.8794 |
0.0872 |
0.2892 |
|
%RSD |
0.08 |
0.29 |
0.09 |
0.29 |
Table.4. Intermediate precision of Amlodipine and Chlorthalidone
|
Sr. No. |
Area |
% Assay |
||
|
CHL |
AML |
CHL |
AML |
|
|
1 |
932682 |
429889 |
100.09 |
100.05 |
|
2 |
932294 |
429370 |
100.05 |
99.93 |
|
3 |
932065 |
430007 |
100.03 |
100.07 |
|
Average |
932347 |
429755.3333 |
100.0571 |
100.0154 |
|
Std.dev |
312 |
339 |
0.03 |
0.08 |
|
%RSD |
0.03 |
0.08 |
0.03 |
0.08 |
Table.5. Accuracy of Amlodipine
|
Sr. No. |
Level |
mg of drug spiked |
Amlodipine Area |
mg of drug Recovered |
% Recovery |
|
1 |
80% |
0.008000 |
750121 |
0.008061 |
100.76 |
|
2 |
100% |
0.010000 |
917322 |
0.010059 |
100.59 |
|
3 |
120% |
0.012000 |
1096395 |
0.012023 |
100.19 |
|
Average |
100.52 |
||||
|
Std. dev |
0.29 |
||||
|
%RSD |
0.29 |
||||
Table.6. Accuracy of Chlorthalidone
|
Sr. No. |
Level |
mg of drug spiked |
Chlorthalidone Area |
mg of drug Recovered |
% Recovery |
|
1 |
80% |
0.020000 |
345672 |
0.020007 |
100.03 |
|
2 |
100% |
0.025000 |
432475 |
0.025030 |
100.12 |
|
3 |
120% |
0.030000 |
518477 |
0.030008 |
100.3 |
|
Average |
100.06 |
||||
|
Std. dev |
0.05 |
||||
|
%RSD |
0.05 |
||||
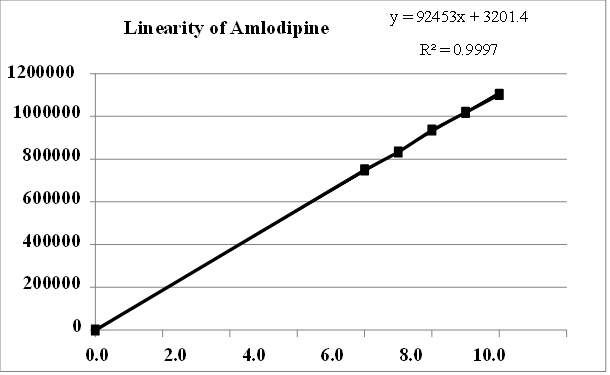
Fig.6. Linearity of Amlodipine
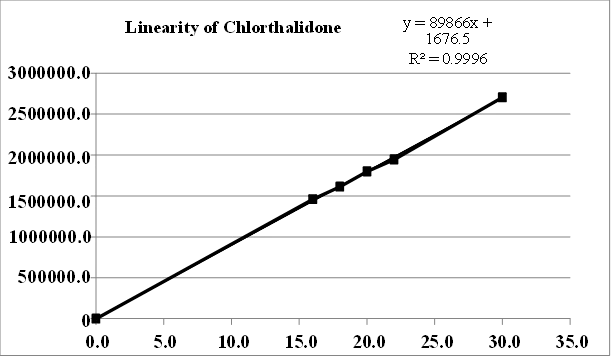
Fig.7. Linearity of Chlorthalidone
Table.7. Linearity concentration level of Amlodipine
|
Sr. No. |
Concentration in ppm |
Concentration of Solution |
Diluted to |
Area |
|
1 |
8.0 |
80 |
50 |
749938 |
|
2 |
9.0 |
90 |
50 |
833284 |
|
3 |
10.0 |
100 |
50 |
936119 |
|
4 |
11.0 |
110 |
50 |
1019371 |
|
5 |
12.0 |
120 |
50 |
1103153 |
Table.8. Linearity concentration of Chlorthalidone
|
Sr. No. |
Concentration in ppm |
Concentration of Solution |
Diluted to |
Area |
|
1 |
20.0 |
80 |
50 |
340857 |
|
2 |
22.5 |
90 |
50 |
382681 |
|
3 |
25.0 |
100 |
50 |
414494 |
|
4 |
27.5 |
110 |
50 |
454583 |
|
5 |
30.0 |
120 |
50 |
492546 |
Table.9. Solution stability of Amlodipine and Chlorthalidone
|
Sr. No. |
Hours |
Area |
% Assay |
%Assay Difference |
|||
|
AML |
CHL |
AML |
CHL |
AML |
CHL |
||
|
1 |
Initial |
922920 |
444869 |
100.49 |
100.63 |
----- |
----- |
|
2 |
4 Hour |
927498 |
445837 |
100.50 |
100.22 |
0.01 |
0.41 |
|
3 |
24 Hour |
927066 |
445755 |
100.45 |
100.20 |
0.04 |
0.43 |
Table.10. Robustness of Amlodipine
|
Sr. No |
Composition |
Flow rate |
||
|
Composition 1 |
Composition 2 |
0.9 ml/min |
1.1 ml/min |
|
|
1 |
945216 |
954661 |
934512 |
926545 |
|
2 |
946528 |
954361 |
934681 |
926453 |
|
3 |
945316 |
954768 |
932645 |
926465 |
|
Mean |
945687 |
954590 |
933946 |
926488 |
|
STDEV |
730.330 |
208.238 |
1129.863 |
50.013 |
|
RSD |
0.08 |
0.02 |
0.12 |
0.01 |
Table.11. Robustness of Chlorthalidone
|
Sr. No |
Composition |
Flow rate |
||
|
Composition 1 |
Composition 2 |
0.9ml flow |
1.1ml flow |
|
|
1 |
431564 |
452611 |
414561 |
421535 |
|
2 |
431864 |
452678 |
416543 |
421656 |
|
3 |
431786 |
452678 |
413654 |
421685 |
|
Mean |
431738 |
452656 |
414919 |
421625 |
|
STDEV |
155.653 |
38.682 |
1477.458 |
79.563 |
|
RSD |
0.04 |
0.01 |
0.36 |
0.02 |
Table.12. LOD and LOQ of Amlodipine and Chlorthalidone
|
Sr. No |
Drug name |
LOD |
LOQ |
|
1 |
AML |
0.51 |
1.53 |
|
2 |
CHL |
0.03 |
0.10 |
CONCLUSION
All the above parameters are achieved, analysed, and then compared with the acceptance criteria for each one of them. Based on the above data and analysis, it is confirmed that the above validation technique is ideal for use in estimating the amounts of Amlodipine and Chlorthalidone in tablets. The method has been successfully validated using the RPHPLC method according to the ICH guidelines. The technique showed strong specificity and no influence from blank solutions. Precision studies showed %RSD values within acceptable limits, indicating high reproducibility. The accuracy values were between 98 and 102%, which confirmed the validity of the technique. The robustness and solution stability tests provided additional evidence that the technique was consistent and stable.
CONFLICT OF INTEREST
The authors have no conflicts of interest regarding this investigation.
ACKNOWLEDGMENTS
The authors express their sincere gratitude to Sandip Institute of Pharmaceutical Sciences, for providing the necessary facilities and a supportive environment to carry out this research work on the development and validation of an RP-HPLC method for the simultaneous estimation of Amlodipine and Chlorthalidone. The authors are thankful to Arni Analytical Laboratory for providing the required laboratory facilities and technical support during the experimental studies.
REFERENCES


Vaishnavi Rasal, Dr. Deepali Kadam, Laximikant Borse, Simultaneous Estimation of Amlodipine and Chlorthalidone in Combined Dosage Form: Method Development and Validation, Int. J. of Pharm. Sci., 2026, Vol 4, Issue 6, 1304-1312, https://doi.org/10.5281/zenodo.20555977
 10.5281/zenodo.20555977