

We use cookies to ensure our website works properly and to personalise your experience. Cookies policy
1Pharm D Scholars, Abhinav Education Society’s College of Pharmacy, Narhe, Pune, Maharashtra, India
2 Pharm.D Scholars, Abhinav Education Society’s College of Pharmacy, Pune, Maharashtra, India
3 Pharm.D Scholars, Abhinav Education Society’s College of Pharmacy, Narhe, Pune, Maharashtra, India
4 Principal and Research Guide, Abhinav Education Society’s College of Pharmacy, Narhe, Pune, Maharashtra, India
5Clinical Pharmacologist and Co-Guide, Sahyadri Super Speciality Hospital, Deccan, Pune, Maharashtra, India
Background : Intravenous fluids are frequently administered to hospitalized patients, but the selection, volume, rate of administration, and even indication for their use can be mismanaged in ways that lead to avoidable harm.Objective: Quality indicators related to the administration of intravenous fluids help measure the appropriateness of their use. This study describes the use of intravenous fluids by adult inpatients at a tertiary care hospital and presents quality indicators for their administration.Methods: The utilization of intravenous fluids and administration-related quality indicators were measured in a record-based observational study at Sahyadri Super Speciality Hospital, Deccan, Pune, for a period of six months from September 2024 to February 2025. The study included the records of 100 adult inpatients in whom intravenous fluids were administered. The patient profiles were filled in a structured form. Summary statistics were prepared for demographic variables, type of fluid used, method of administration, indication for use, and supporting clinical and laboratory information where available.Results:Of the 100 patients studied, 61% were female and 39% male. Of the fluid types studied, normal saline was used in 81% of cases, Ringer’s lactate solution in 17%, dextrose normal saline in 1%, and multivitamin solution in 1% of cases. Bolus administration was the most common method of administration, used in 81% of cases, followed by administration at a constant rate of 100 mL/hr in 10% of cases and 75 mL/hr in 7% of cases. The main indication for the use of fluids was for hydration in 63% of cases, followed by maintenance in 16% of cases and management in 15% of cases. For the quality assessment data available for 100 records, 73 (73%) had no error, while the most common error identified was for IV fluid volume (8%), followed by documentation error in 4% of cases and error in flow-rate in 4% of cases.Conclusion: Normal saline was the most commonly used fluid, and bolus administration was the most common method of administration of IV fluids in this patient group. Findings from this study support the need for structured prescription, documentation, monitoring, and reassessment of intravenous fluid therapy. However, the supplied aggregate data file did not contain complete case-level patient-factor and outcome data and, therefore, no quantitative associations with comorbidities, with renal function, or with clinical outcomes can be inferred from the data supplied for this study
Intravenous fluid therapy is a fundamental component of inpatient care and is used for resuscitation, maintenance, replacement of ongoing losses, correction of electrolyte or metabolic abnormalities, and support of patients who cannot meet their fluid needs enterally. Because IV fluids are administered directly into the circulation, the prescription of fluid type, volume, rate, and duration requires the same degree of clinical consideration applied to other therapies. Contemporary guidance emphasizes assessment of fluid and electrolyte needs, a clear indication, explicit prescription of volume and rate, and regular reassessment during treatment [1,2].
The principal classes of IV fluids used in clinical practice include crystalloids and colloid solutions. Common crystalloids include 0.9% sodium chloride (normal saline) and balanced solutions such as Ringer’s lactate. The composition of a solution can influence chloride load, acid-base status, electrolyte balance, and renal physiology, particularly when larger volumes are administered [1,3,4]. Large clinical trials have evaluated balanced crystalloids versus saline in critically ill and noncritically ill adults, underscoring that fluid choice should be individualized to the clinical context rather than determined solely by local habit [5,6].
Excessive fluid administration may contribute to fluid accumulation and organ dysfunction, especially in patients with acute kidney injury or other conditions associated with limited fluid tolerance [4,7]. Similarly, omissions or errors in prescription, documentation, and infusion rate can compromise safe administration. A structured review of real-world IV fluid utilization can therefore identify common patterns and process-level risks that may be addressed through education, protocol adherence, and multidisciplinary review.
1.1 Aim
To describe the utilization patterns of intravenous fluids and documented quality indicators of their administration among patients admitted to a tertiary care hospital.
1.2 Objectives
• To describe the demographic distribution of adult patients receiving IV fluids.
• To identify the types of IV fluids, infusion patterns, and indications most frequently recorded.
• To document administration-related quality indicators, including errors in volume, rate, indication, and documentation.
• To summarize available patient factors such as age, comorbidities, and renal/electrolyte laboratory parameters relevant to IV fluid use without inferring unreported associations.
2. MATERIALS AND METHODS
2.1 Study design and setting
This was a record-based observational study conducted at Sahyadri Super Speciality Hospital, Deccan, Pune, Maharashtra, India. The study period was six months, from September 2024 to February 2025. The study included 100 adult inpatients who received IV fluids during hospitalization. The supplied project documents inconsistently describe the temporal design as prospective and retrospective; the present manuscript uses the neutral term record-based observational to avoid assigning a design that cannot be independently resolved from the supplied aggregate materials.
2.2 Eligibility criteria
Inclusion criteria were: patients aged ≥18 years, admitted to the hospital, and receiving IV fluid therapy. Pediatric patients (<18 years) and patients who did not receive IV fluids were excluded. The available project documents did not specify additional department-level exclusion criteria.
2.3 Data collection
Data were retrospectively extracted using a structured patient profile/data collection form from inpatient medical records, medication charts, and available laboratory reports. Recorded variables included age, sex, admission and discharge dates, diagnosis, relevant medical history/comorbidities, medication history, IV fluid type, route, dose/volume where documented, infusion rate or bolus administration, indication, and administration-related quality observations. Laboratory variables listed in the study form included sodium, potassium, chloride, bicarbonate, calcium, urea, creatinine, and magnesium, when available.
2.4 Data analysis
Descriptive statistics were used. Categorical variables were summarized as frequencies and percentages. No inferential statistical testing or causal analysis was performed because the supplied study materials consisted of aggregate descriptive results rather than a complete case-level analytical file.
3. RESULTS
A total of 100 adult inpatients receiving IV fluid therapy were included in the study summary. The reported distributions of fluid type, sex, age group, infusion pattern, indication, and quality observations are presented below.
3.1 Type of IV fluid used
Normal saline was the most frequently recorded IV fluid, accounting for 81% of administrations (n=81). Ringer’s lactate accounted for 17% (n=17), while dextrose normal saline and multivitamin infusion each accounted for 1% (n=1).
Table 1. Distribution of IV fluid types recorded in the study.
|
IV fluid |
Number (n) |
Percentage |
|
Normal saline (NS) |
81 |
81% |
|
Ringer’s lactate (RL) |
17 |
17% |
|
Dextrose normal saline (DNS) |
1 |
1% |
|
Multivitamin infusion (MVI) |
1 |
1% |
|
Total |
100 |
100% |
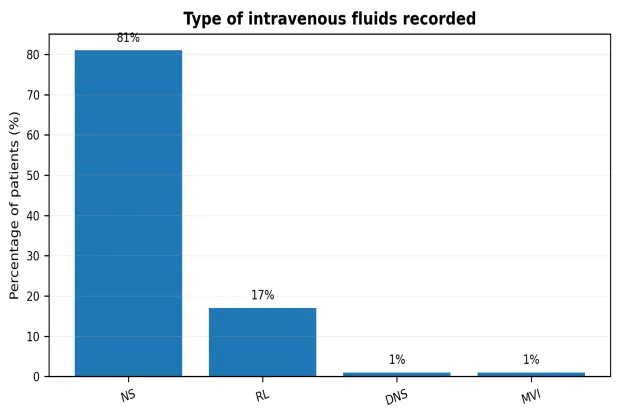
Figure 1. Type-wise distribution of IV fluids recorded.
3.2 Gender-wise distribution
Among the 100 patients, 61 (61%) were female and 39 (39%) were male.
Table 2. Gender distribution of study participants.
|
Gender |
Number (n) |
Percentage |
|
Male |
39 |
39% |
|
Female |
61 |
61% |
|
Total |
100 |
100% |
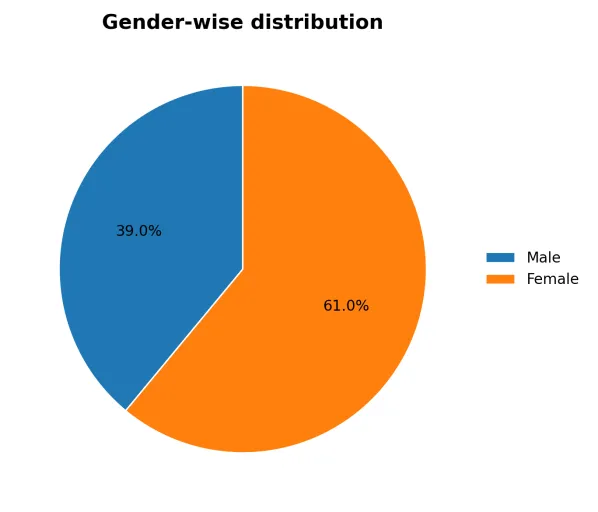
Figure 2. Gender-wise distribution of study participants.
3.3 Age-wise distribution
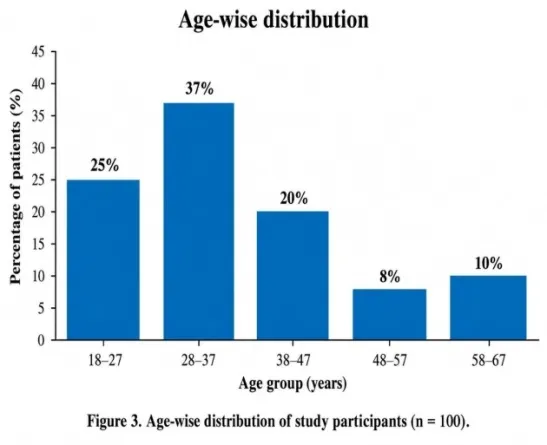
The largest reported age group was 28-37 years (37%), followed by 18-27 years (25%) and 38-47 years (20%). The 48-57 and 58-67 year groups represented 8% and 10%, respectively.
Table 3. Age distribution
|
Age group (years) |
Number (n) |
Reported percentage |
|
18-27 |
25 |
25% |
|
28-37 |
37 |
37% |
|
38-47 |
20 |
20% |
|
48-57 |
8 |
8% |
|
58-67 |
10 |
10% |
3.4 IV fluid infusion pattern
Bolus administration was the most frequently reported pattern (81%). Infusion at 100 mL/hr was reported in 10% of cases and 75 mL/hr in 7%. Administration at 150 mL/hr and over 1 hour each accounted for 1%.
Table 4. Reported IV fluid infusion patterns
|
Infusion pattern |
Number (n) |
Percentage |
|
75 mL/hr |
7 |
7% |
|
100 mL/hr |
10 |
10% |
|
150 mL/hr |
1 |
1% |
|
Bolus |
81 |
81% |
|
Over 1 hour |
1 |
1% |
|
Total |
100 |
100% |
.
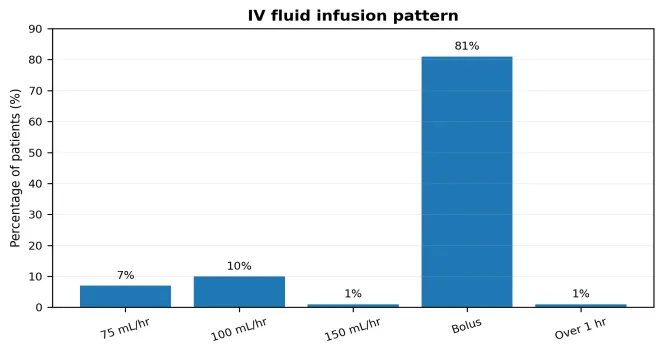
Figure 4. IV fluid administrations according to infusion pattern.
3.5 Indications for IV fluid use
Hydration was the most frequently reported indication (63%), followed by maintenance (16%) and management-related use (15%). Correction accounted for 4%, while low blood glucose and giddiness each accounted for 1%.
Table 5. Indications recorded for IV fluid administration.
|
Indication |
Number (n) |
Percentage |
|
Management |
15 |
15% |
|
Maintenance |
16 |
16% |
|
Low blood glucose |
1 |
1% |
|
Hydration |
63 |
63% |
|
Giddiness |
1 |
1% |
|
Correction |
4 |
4% |
|
Total |
100 |
100% |
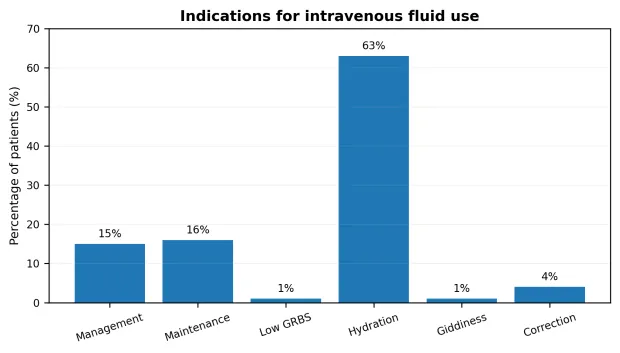
Figure 5. Indication-wise distribution of IV fluid use.
3.6 Quality and administration-related observations
Quality-assessment data were available for 100 records. 73/100 (73%) had no identified quality error. Among the documented deviations, IV fluid volume error was most frequent (8/100, 8%), followed by documentation error and flow-rate issue (4/100, 4% each). Wrong indication and omission of flow rate were each recorded in 3/100 records (3%), time-spacing error in 2/100 (2%), and incomplete therapy chart, adverse reaction, and contraindication in 1/100 each (1%).
Table 6. Quality observations in the assessable IV fluid records.
|
Quality observation |
n |
% of n=100 |
|
No identified quality error |
73 |
73% |
|
IV fluid volume error |
8 |
8% |
|
Documentation error |
4 |
4% |
|
Flow-rate issue |
4 |
4% |
|
Wrong indication |
3 |
3% |
|
Omission of flow rate |
3 |
3% |
|
Time-spacing error |
2 |
2% |
|
Incomplete therapy chart |
1 |
1% |
|
Adverse reaction |
1 |
1% |
|
Contraindication |
1 |
1% |
|
Total assessable records |
100 |
100% |
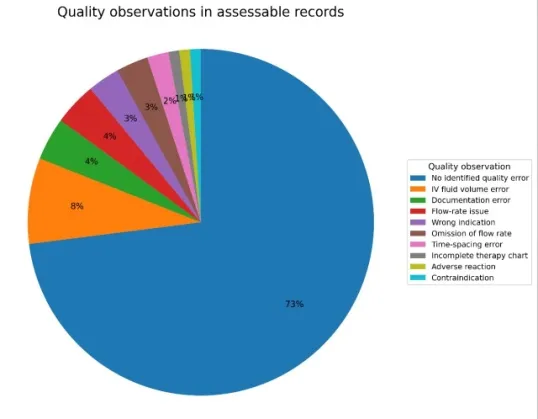
Figure 6. Distribution of quality observations in the assessable records.
4. DISCUSSION
The present study provides a descriptive overview of IV fluid utilization among 100 adult inpatients in a tertiary care hospital. Normal saline accounted for 81% of recorded administrations, with Ringer’s lactate accounting for 17%. The strong concentration of use in these two crystalloids is consistent with their widespread availability and routine clinical use. However, contemporary fluid guidance emphasizes that the indication, patient physiology, volume requirement, and monitoring plan should determine the prescription rather than habitual selection of one solution [1,2].
The predominance of normal saline should be interpreted in the context of broader evidence on crystalloid composition. Normal saline contains a relatively high chloride concentration, and chloride load has been associated with hyperchloremia and acid-base disturbances; observational research has also reported associations between higher chloride exposure and adverse outcomes in selected acutely ill populations [3,8]. At the same time, major randomized trials have not established a universal rule that every patient should receive a balanced crystalloid. . In the SMART trial of critically ill adults, the use of balanced crystalloids was associated with fewer major adverse kidney events compared to saline . However, the SALT-ED trial in noncritically ill adults showed no difference in hospital-free days but a lower incidence of major adverse kidney events with the use of balanced crystalloids [5,6].These findings support individualized fluid selection and regular reassessment.
Hydration was the leading recorded indication (63%), followed by maintenance (16%) and management-related use (15%). NICE recommends that IV fluids be given when oral or enteral intake cannot meet requirements and that clinicians explicitly distinguish resuscitation, routine maintenance, replacement, redistribution, and reassessment [2]. The current dataset did not contain enough clinical detail to judge the appropriateness of each indication against a standardized guideline, so the findings should be interpreted as utilization patterns rather than appropriateness determinations.
Bolus administration accounted for 81% of recorded patterns. A high proportion of bolus use may indicate that rapid fluid delivery was common in the reviewed records, but the clinical appropriateness of a bolus depends on the patient’s hemodynamic state, indication, fluid responsiveness, and risk of accumulation. This is particularly important in patients with renal dysfunction or other limited fluid tolerance, in whom fluid overload may be harmful [4,7].
The quality-assessment subset contained 100 records and showed no identified error in 73% of entries. The most frequent documented deviation was an IV fluid volume error (8%), followed by documentation and flow-rate issues (4% each). These process findings are clinically relevant because safe IV fluid therapy requires a clear prescription of fluid type, volume, and rate, together with ongoing assessment and monitoring [1,2]. The findings therefore identify practical areas for medication-safety and fluid-stewardship interventions, particularly standardized prescriptions, documentation checks, and pharmacist/nursing review.
The study materials identified age, comorbidities, and renal/electrolyte laboratory parameters as variables of interest. However, the supplied aggregate results did not provide complete case-level cross-tabulations linking these variables to particular fluid choices, errors, or outcomes. Accordingly, no association or risk estimate has been claimed. Future work using the original patient-level dataset could examine relationships between patient characteristics and IV fluid utilization or administration quality outcomes [10].
5. CONCLUSION
Normal saline was the most frequently recorded IV fluid (81%), followed by Ringer’s lactate (17%), and bolus administration was the predominant infusion pattern (81%). Hydration was the leading indication for IV fluid use (63%). In the 100-record quality-assessment subset, 73% of records had no identified quality error, while volume, documentation, and flow-rate issues were among the principal documented deviations. The findings support protocol-based IV fluid prescribing, explicit documentation of fluid type/volume/rate, regular reassessment, and multidisciplinary review. Because complete case-level patient-factor and outcome data were not supplied, the present study should be interpreted primarily as a descriptive utilization and process-quality assessment.
6. FUTURE SCOPE
• Development and periodic audit of standardized IV fluid prescribing and monitoring protocols.
• Use of electronic prescribing and decision-support tools to reduce documentation and rate/volume errors.
• Fluid stewardship programs that emphasize indication, reassessment, de-escalation, and avoidance of unnecessary fluid exposure.
• Prospective or multicenter studies using patient-level data to examine associations with renal function, electrolyte abnormalities, fluid overload, length of stay, and other outcomes.
• Multidisciplinary education involving physicians, pharmacists, and nursing staff to strengthen safe IV fluid administration.
7. LIMITATIONS
• The study was conducted at a single tertiary care hospital, limiting generalizability.
• The sample size was limited to 100 patients.
• The observational, record-based design does not establish causality or permit random assignment of fluid therapy.
• The aggregate results supplied for analysis did not contain complete patient-level cross-tabulations for comorbidities, renal/electrolyte parameters, duration of therapy, or clinical outcomes.
•Since this was a retrospective analysis using medical records, there were cases where the information were not documented completely and thus may not be correct.
• The exact duration for the IV fluid therapy could not be consistently derived from all records.
• There was no long-term follow-up post hospital discharge carried out as part of this study.
• Variability in prescribing habits of different physicians may have impacted the patterns of IV fluid use.
• Economic impact of the various IV fluids or their cost-effectiveness was not evaluated within this study.
ACKNOWLEDGMENT
The authors acknowledge Dr. Trupti Tuse, Principal, Abhinav Education Society’s College of Pharmacy, Pune; Dr. Trupti Tuse, research guide; Dr. Manoj Pisure, clinical co-guide; Sahyadri Super Speciality Hospital, Deccan, Pune; and the patients who participated in the study.
REFERENCES

Dr. Mazharuddin Mainuddin, Dr. Rajesh Gupta, Dr. Shubham Suradkar, Dr. Trupti Tuse, Dr. Manoj Pisure, An Observational Study of Utilization Patterns and Quality Indicators of Intravenous Fluid Administration in a Tertiary Care Hospital, Int. J. of Pharm. Sci., 2026, Vol 4, Issue 9, 3446-3455, https://doi.org/10.5281/zenodo.23009849
 10.5281/zenodo.23009849