

We use cookies to ensure our website works properly and to personalise your experience. Cookies policy
Department of Pharmaceutical Quality Assurance, Vidyabharti College of Pharmacy, Amravtati, Maharashtra ,India.
A simple and easy to use method was developed to measure the amount of S-(-)-Amlodipine in medicine. This method uses a machine called a Shimadzu HPLC system with a UV detector and a Zorbax SB-C8 column. The mixture used to help the machine work is made of ammonium acetate and acetonitrile. The machine pushes this mixture through the column at a rate of 1.0 mL per minute. The machine detects S-(-)-Amlodipine by measuring how light it absorbs at 238 nm.This method is very good at measuring S-(-)-Amlodipine over a range of amounts. It works well from “3.12 to 100 /µg mL. The method is also very repeatable which means it gives the same results every time it is used. To test this the method was used times on the same day and on different days. The results were very consistent. The method was also tested to see if it could handle changes in how it is used such as changing the flow rate or the mixture. It worked well even when these things were changed.The method was also tested to see if it could accurately measure S-(-)-Amlodipine in medicine. It was able to recover the S-(-)-Amlodipine from the medicine at levels of 80%, 100% and 120%. This method is a way to measure S-(-)-Amlodipine in medicine because it is accurate easy to use and does not cost too much. It is a choice, for regularly checking the quality of S-(-)-Amlodipine in pharmaceutical dosage forms
S-Amlodipine (s-Amlodipine), (S)-[2-(2-aminoethoxy)-5-(4-chlorophenyl)-1,3-thiazol-4-yl][4-(2-chlorophenyl)-2-methyl-6-ethyl-3,5-dihydro-2H-pyrazolo[3,4-b]quinolin-3-yl]methanol, has been proposed as an antihypertensive drug. As an effective and safe dihydropyridine drug currently prescribed by the clinicians, Amlodipine displays a long lasting pharmacological effect. The efficacy of Amlodipine in treating heart diseases has been drawing increasing attention from scientists. The quantitative determination of s-Amlodipine in human plasma is very necessary to ensure its efficacy. At present, many chromatographic methods, for example, HPLC with fluorimetric detection and ultraviolet spectrometry, LC-MS/MS, LC-TOF-MS, and UPLC, have been established to determine the concentration of Amlodipine in drugs and biofluids. Though many of them can reach high sensitivity for the requirement, they are not able to quantify plasma level of s-Amlodipine because of the disadvantages of complicated sample preparation, time-consuming procedure, and lack of precision. In addition, there is few method used to determine s-Amlodipine
Pharmacological Profile:
S-Amlodipine is a type of medicine that helps stop calcium from getting into the blood vessels. It is mostly used to treat blood pressure and chest pain. Since S-Amlodipine is a form of the medicine it works better and has fewer side effects than other forms of the medicine.
Need for Bioanalytical Estimation:
We need to be able to measure how much S-Amlodipine is in the body. This is important, for understanding how the drug gets absorbed, distributed and removed from the body. By knowing this we can get an idea of how S-Amlodipine works and make sure it is safe to use
Requirement of the Study:
Given the complexities of biological samples, there is a significant requirement for a highly sensitive and robust validated RP-HPLC method. This study aims to fulfill this necessity by developing a method that ensures high precision and accuracy for routine clinical and research applications."
2. MATERIAL AND METHOD
2.1 Chemicals and Reagensts
The reference standard of S-(-)-amlodipine was purchased from Jigs Chemical Limited, Ahmedabad, Gujrat. Ammonium acetate was purchased from Merck Ltd. (Mumbai-India) HPLC grade acetonitrile, methanol and HPLC grade water were purchased from Merck (Mumbai, India). 0.20µ and 0.45µ nylon membrane filters were used and purchased from UltraChrom Innovatives Pvt. Ltd. (India). All other chemicals and reagents were used of HPLC grade.
2.2 Instrumentation
The high-performance liquid chromatography (HPLC) of Shimadzu SCL-10A inbuilt with binary pump (LC-10AT), UV detector (SPD-10A), Rheodyne 20µl loop capacity manual Injector (P/N 77251) was used throughout the analysis. The LC-Solution software was used to interpret the HPLC reports. Zorbax-SB C8, 100A (5um: 150 x 4.6 mm ID.) column was purchased from Agilent (Maharashtra, India) was used throughout the analysis. Digital weighing balance (ME-204) purchased from Mettler-Toledo (USA), ultra-sonicator Labman purchased from UltraChrom Ltd, India. Digital pH meter from Mettler-Toledo was purchased from (Mumbai-India). 50 µ micro-syringe was purchased from Hamilton USA. 0.20µ and 0.45µ nylon membrane filters were purchased from Phenomenex Mumbai, India.
2.3 Reagents and reference samples
The reference standard of S-(-)-amlodipine was purchased from Jigs Chemical Limited, Ahmedabad, Gujrat. Ammonium acetate was purchased from Merck Ltd. (Mumbai-India) HPLC grade acetonitrile, methanol and HPLC grade water were purchased from Merck (Mumbai, India). 0.20µ and 0.45µ nylon membrane filters were used and purchased from UltraChrom Innovatives Pvt. Ltd. (India). All other chemicals and reagents were used of HPLC grade.
2.4 Selection of solvent and wavelength
S-(-)-amlodipine is insoluble in water but soluble in acetonitrile and partially soluble in methanol. Furthermore the standards stock solution of 5-(-)-amlodipine was prepared in a HPLC grade methanol. S-(-)-amlodipine exhibit maximum UV absorbance (A) at 238 nm wavelength. therefore this particular UV wavelength was used throughout the HPLC analysis.
2.5 Preparation of standard solution
Exactly, 2.5 mg of each S-(-)-amlodipine standard was weighed and dissolved in 5 ml of acetonitrile to get the 500 ppm (500 µg/ml) solution. It was sonicated for 10-15 minutes and then as per the need, their serial dilutions were made to determine the validation studies including repeatability, precision and robustness.
2.6 Chromatographic conditions
Exactly, 20 µl of freshly prepared stock solution of S-(-)-amlodipine was injected into the Zorbax-SB CB, 100A (5µm; 150 x 4.6 mm ID.) column and eluted using the mobile phase as 20mM ammonium acetate-acetonitrile (20:80%, v/v) at 1.0 ml/mins flow rate for 10 mins. Isocratic elution was considered for the separation and performed at room temperature and wavelength 238 nm.
2.7 System suitability studies
Freshly prepared stock solution of S-(-)-amlodipine (100 ppm) was injected 6 times to determine the closeness of results achieved for relative standard deviation (RSD) in percentage; The calculated values should always less than 2%. Moreover, other system suitability parameters including, retention time, capacity factor (k'), theoretical plates (N), tailing factor/peak asymmetry (As) and separation factor (a) were calculated.
2.8 Precision studies of the proposed method
Freshly prepared stock solution of S-(-)-amlodipine (100 ppm) was analyzed in triplicate thrice within a same day (intraday precision) and triplicate in three successive days (interday/intermediate precision) were tested and evaluated. Furthermore, their mean, standard deviation and relative standard deviation (RSD) were calculated which should be less than 2% as per the ICH guidelines.
2.9 Robustness for the chromatographic method
The flow rate of the mobile phase was changed by 1.00 ±1 decimal from 1 mL/min to 1.1 mL/min and to 0.9 mL/min to evaluate the effect of the flow rate on separation pattern of S-(-)-amlodipine. Similarly, small but deliberate variation of organic modifier as solvent Bas acetonitrile was changed by 80±2% in its initial gradient elution mode to investigate the effects on retention time (tr), capacity factor (k') and theoretical plates (N). Finally, the effect of wavelength was monitored by making deliberate variation from 238 ±2 nm to 240 and 236 nm and the differences in retention time (ta), capacity factor (k'), resolution (R) and theoretical plates (N) were tested and evaluated. Robustness study was performed as per the procedure mentioned under the chromatographic condition (section 5.5).
2.10 Sample preparation for Linearity/Calibration studies
Prior to the analysis, 500 ppm (500 µg/ml) of S-(-)-amlodipine standard was made. Furthermore, serial dilutions of four different concentrations ranging between. concentrations 3.12 100 ppm of S-(-)-amlodipine were made. They were sonicated and then analyzed as per the chromatographic condition mentioned in experimental section 5.5. Furthermore, the calibration curve (linearity graph) was plotted by calculating the peak area against known 4 different concentrations to determine their regression equation, regression coefficient (R), limit of quantification (LOQ) and limit of detection (LOD).
2.11 Sample preparation for drug accuracy studies of S-(-)-amlodipine
Exactly 5 tablets of ESAM-2.5mg manufactured by Torrent Pharma Ltd. consisting 2.5 mg S-(-)-amlodipine were weighed and the average weight was calculated. They were mixed and crushed to fine powder into the mortar and pestle. An accurately weighed amount of the finely powdered equivalent to 2.5 mg was dissolved in 5 ml of acetonitrile. It was then ultrasonicated for 5-10 mins and then filtered through 0.45µ nylon filter. Furthermore, serial dilutions were made in accordance to get the final concentration 100 ppm for S-(-)-amlodipine and considered they are 100%. The solution was then sonicated and analyzed as per the chromatographic condition mentioned in experimental section 5.5. The drug recovery of S-(-)-amlodipine from marketed formulation of concentrations; 80%, 100% and 120% were evaluated with the 100% concentration of reference standard.
CONCLUSION
This study was able to create and validate an accurate method for measuring S-(-)-Amlodipine in medicine. The method used a column and a mixture of liquids to separate the S-(-)-Amlodipine. The liquids were mixed in a ratio and flowed through the column at a speed of 1.0 mL per minute. The S-(-)-Amlodipine was detected using a light with a wavelength of 238 nm. The method was. Found to be good and reliable. It was also able to produce results.
The method was tested times and the results were very close to each other. This means that the method is good and can be trusted. The method was also able to detect S-(-)-Amlodipine in medicines that're already available in the market. The method is sensitive. Does not cost too much. It is also good for quality control checks. So this method can be used to measure and validate S-(-)-Amlodipine in medicines and other related fields.
ACKNOWLEDGEMENT
The author wants to thank the University Department of Pharmaceutical Sciences in Nagpur for providing the equipment and support to complete this study. The author is grateful to the research guide, teachers and laboratory staff for their help and encouragement throughout the study.
The author also wants to thank the companies that provided the materials and chemicals for the study including the reference standard for S-(-)-Amlodipine. These materials were very important for the study. The author is thankful to have received them. The author is thankful, for all the help and support received during the study.
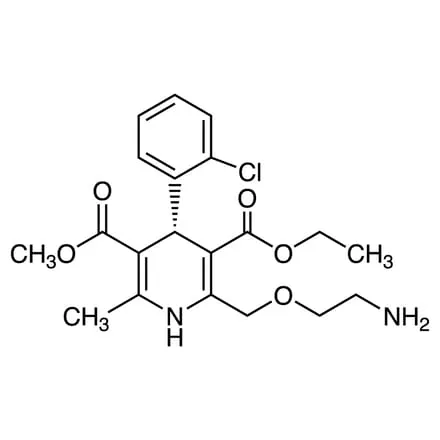
Figure 1. Structure of S-(-)-Amlodipine
RESULTS AND DISCUSSION
UV-Visible absorption spectrum of S-Amlodipine during spectroscopic study. This technique of spectroscopy has been the most common tool for identifying and estimating various pharmaceutical compounds since it gives details about the electronic transitions within the molecules.
In this case, absorbance (Abs.) is represented on the Y-axis, while the wavelength (nm) is represented along the X-axis on a scan range of 215–800 nm. In addition, there are two significant peaks of S-Amlodipine in this spectrum.
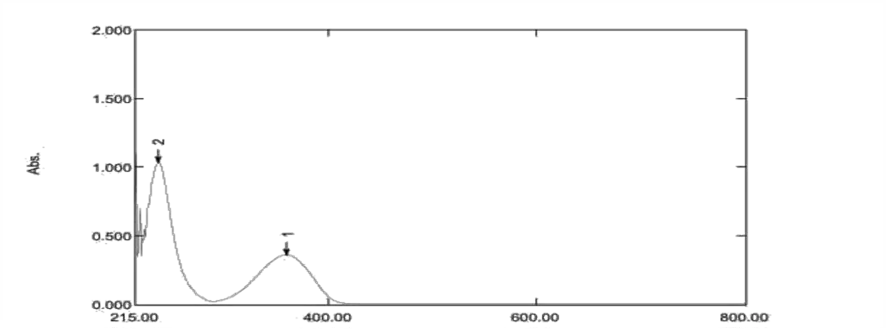
UV-Visible graph of S- Amlodipine
METHOD VALIDATION:
Accuracy:
Percentage drug accuracy of three different concentrations; 80%, 100% and 120% (injected thrice) to estimate the S-amlodipine from developed formulation and results obtained have been reported in Table 8.26 . Accuracy can be studied by applying the calibration curve; the Y-intercept and the slope of the graph were used to determine the % drug recovery, attributed to the developed method for the quantification of S-amlodipine or by comparing with similar concentration of reference standard. As resulted, the achieved drug recovery of S-amlodipine was in the range of 100.4-100.7 and 100-105, respectively. As recommended by international conferences of Harmonization (ICH) guidelines the drug recovery should be within the range of 90-110% and the RSD in percentage should be less than 2%. Hence, the calculated drug recoveries for estimation of S-amlodipine represents the drug recovery were in the acceptance limit given by ICH guidelines.
Table 1. Accuracy study of S-amlodipine (120 ppm)
|
Peak |
Ret. Time |
Height |
Area |
Area% |
T.Plate |
Tailing F. |
k' |
Separation |
|
1 |
1.355 |
16595 |
172984 |
2.0394 |
472.695 |
1.324 |
0 |
0 |
|
2 |
4.657 |
727958 |
8208980 |
97.9606 |
4043.047 |
1.476 |
2.437 |
0 |
Table 2. Accuracy study of S-amlodipine ( 100 ppm)
|
Peak |
Ret. Time |
Height |
Area |
Area% |
T.Plate |
Tailing F. |
k' |
Separation |
|
2 |
1.698 |
3739 |
23354 |
0.3525 |
1367.201 |
-- |
0.247 |
0 |
|
3 |
1.895 |
2263 |
26178 |
0.3951 |
537.918 |
-- |
0.392 |
1.586 |
|
S-amlodipine |
4.624 |
594933 |
6491334 |
97.9854 |
4143.748 |
1.371 |
2.397 |
6.11 |
Table 3.Accuracy study of S-amlodipine (80 ppm)
|
Peak |
Ret. Time |
Height |
Area |
Area% |
T.Plate |
Tailing F. |
k' |
Separation |
|
1 |
1.354 |
9775 |
95314 |
2.5954 |
539.826 |
1.323 |
0 |
0 |
|
2 |
1.692 |
3975 |
22650 |
0.6168 |
1712.062 |
1.186 |
0.25 |
0 |
|
3 |
4.66 |
324501 |
4754412 |
96.7878 |
4373.111 |
1.425 |
2.442 |
9.765 |
Table 4. Drug accuracy studies of S-amlodipine
|
Details of active pharma ingredient (API) |
Details of drug in marketed formulation |
||||||
|
Drug Name: S-amlodipine |
Drug content: 2.5 mg |
Marketed formulation: ESAM 2.5 Tablet |
|||||
|
Std. conc. (%) |
Std. (ppm) |
Peak area |
Drug (%) |
Drug (ppm) |
Peak area |
Avg. peak area |
Drug Rec. (%) |
|
100% |
100 |
2545893 |
80% |
80 |
4754412 |
4767574 |
92.66% |
|
80 |
4780736 |
||||||
|
100% |
100 |
6461361 |
6456706 |
100.39% |
|||
|
100 |
6452051 |
||||||
|
120% |
120 |
8208980 |
8208526 |
106.36% |
|||
|
120 |
8208072 |
||||||
|
|
Drug recovery Range (%) as per ICH = 100 ± 10% |
100 ± 6.8% |
|||||
Intraday precision
Implementing the procedure mentioned under experimental section (5.3), the sample of S-amlodipine of same concentrations was tested in a day. Its RSD in percentage was calculated and it was found less than 2% for S-amlodipine. Results shown in Table .
Table 1.Intraday precision studies of S-amlodipine
|
Peak |
Ret. Time |
Height |
Area |
Area% |
T.Plate |
Tailing F. |
k' |
Separation |
|
1 |
1.361 |
12053 |
83931 |
1.2788 |
790.394 |
1.132 |
0 |
0 |
|
2 |
1.698 |
3316 |
18099 |
0.2758 |
1831.214 |
1.162 |
0.247 |
0 |
|
S-amlodipine |
4.624 |
594535 |
6461361 |
98.4455 |
4148.559 |
1.37 |
2.397 |
9.689 |
Table 2.Inter-day (intermediate) precision
Implementing the procedure mentioned under experimental section (5.3), S-amlodipine of three replicates of same concentration was tested in three successive days (inter-day/intermediate precision). The RSD in percentage was calculated and it was found less than 2%. Results shown in Table
|
Peak |
Ret. Time |
Height |
Area |
Area% |
T.Plate |
Tailing F. |
k' |
Separation |
|
1 |
1.361 |
11717 |
81432 |
1.2553 |
789.114 |
1.136 |
0 |
0 |
|
2 |
1.698 |
2779 |
15022 |
0.2316 |
1842.755 |
1.164 |
0.248 |
0 |
|
S-amlodipine |
4.624 |
587634 |
6390403 |
98.5131 |
4149.585 |
1.372 |
2.397 |
9.675 |
Linearity data of S-amlodipine
|
Name of Drug; S-amlodipine |
||
|
S. No. |
Concentration (µg/mL) |
Area |
|
1 |
100 µg/mL |
6491334 |
|
2 |
50 µg/mL |
3254412 |
|
3 |
25 µg/mL |
1654977 |
|
4 |
12.5 µg/mL |
907850 |
|
5 |
6.25 µg/mL |
415665 |
|
6 |
3.12 µg/mL |
213995 |
|
Regression Equation |
y= 64527x + 39083 |
|
|
Correlation coefficient (R2) |
0.9998 |
|
|
Standard error of intercept |
20939.83283 |
|
|
Standard Deviation of intercept |
51291.90573 |
|
|
Limit of quantification (LOQ) |
7.95 µg/mL |
|
|
Limit of detection (LOD) |
2.38 µg/mL |
|
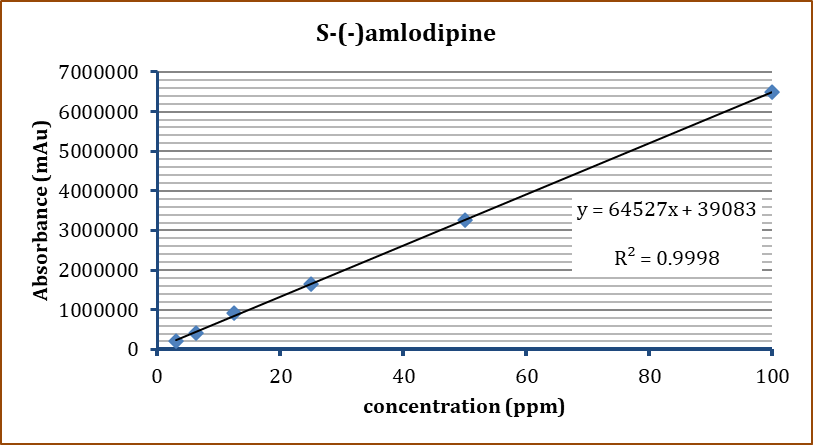
Calibration curve of S-(-)amlodipine
Table : Human Plasma S-(-) Amlodipine recovery
|
Details of Std. (S amlodipine) |
Details of BLOOD |
Details of BFPPT |
|
|
Peak area |
6491334 |
941634 |
923886 |
|
Concentration (ppm) |
100 |
20 |
20 |
|
Injection volume (µL) |
20 |
20 |
20 |
|
Purity of Drug |
0.98 |
NA |
NA |
|
S-(-) amlodipine recovered in Human plasma (%) |
71.08% |
69.74% |
|
Table : Robustness data of S-(-) Amlodipine
|
Selected Variables |
Drug name: S-amlodipine |
|||
|
tR (min) |
Retention Factor (k') |
Tailing Factor (Tf) |
Theoretical Plates (N) |
|
|
Flow rate (1.1 mL/min) |
4.17 min |
2.4 |
1.36 |
4035 |
|
Flow rate (0.9 mL/min) |
5.05 min |
2.46 |
1.44 |
4179 |
|
Solvent B (82% ACN) |
4.62 min |
2.36 |
1.38 |
4182 |
|
Solvent B (78% ACN) |
4.58 min |
2.4 |
1.45 |
4236 |
|
wavelength (240 nm) |
4.6 min |
2.36 |
1.38 |
4230 |
|
wavelength (236 nm) |
4.6 min |
2.36 |
1.38 |
4230 |
|
Mean ± S.D. |
4.60±0.28 |
2.39±0.04 |
1.40±0.04 |
|
REFERENCES

Mahesh Katkade, Amol Sawale, Bioanytical Method Development and Validation for The Estimation Of S- (-)-Amlodipine Using HPLC in Human Plasma, Int. J. of Pharm. Sci., 2026, Vol 4, Issue 7, 4583-4591, https://doi.org/10.5281/zenodo.21492402
 10.5281/zenodo.21492402