

We use cookies to ensure our website works properly and to personalise your experience. Cookies policy
Student of Sigma Institute of Pharmacy, Sigma University, Pioneer Pharmacy College.
Ultraviolet–visible (UV–Vis) spectroscopy is an established absorption spectroscopic technique used for the qualitative characterization and quantitative determination of substances capable of absorbing radiation in the ultraviolet and visible regions. The analytical response arises from electronic excitation within molecules, and the resulting absorption spectrum can provide useful information about chromophoric systems and analyte concentration. This review consolidates the fundamental concepts of UV–Vis spectroscopy, including electronic transitions and the Beer–Lambert relationship, followed by a systematic description of the principal components of a spectrophotometer. Radiation sources, monochromators, sample cells, and commonly used detectors—including photovoltaic cells, phototubes, and photomultiplier tubes—are discussed with emphasis on their operating principles. Derivative spectrophotometry is also reviewed, with attention to zero-, first-, second-, third-, and fourth-order spectra, zero-crossing measurements, spectral resolution, and quantitative applications. The review further summarizes major advantages, limitations, and analytical applications relevant to pharmaceutical and laboratory practice. Recent literature continues to describe UV–Vis spectroscopy as a practical, economical, and versatile technique, while modern mathematical and chemometric approaches can extend its usefulness when spectral overlap limits conventional measurements
Spectroscopy concerns the interaction of electromagnetic radiation with matter. When radiation of appropriate energy interacts with a substance, energy may be absorbed or emitted in discrete quantities, producing measurable spectroscopic responses. In UV–Vis absorption spectroscopy, the measured response is associated primarily with electronic transitions and is therefore particularly useful for compounds containing chromophoric groups.
UV–Vis spectroscopy has remained important in pharmaceutical and analytical laboratories because measurements can be rapid, relatively inexpensive, and straightforward when the analyte has suitable absorption characteristics. Recent reviews describe its continuing use in pharmaceutical quality control, quantitative analysis, stability studies, and broader bioanalytical applications. Modern approaches such as derivative methods, multicomponent mathematical treatments, and chemometrics can improve the usefulness of UV–Vis measurements when conventional spectra overlap.[1,2]
FUNDAMENTAL PRINCIPLE
The basic principle of UV–Vis spectroscopy is the absorption of electromagnetic radiation that promotes electrons from a lower-energy molecular orbital to an energetically higher orbital. The commonly considered ground-state orbitals are σ bonding, π bonding, and non-bonding (n) orbitals, while the corresponding antibonding orbitals include σ* and π*. Depending on molecular structure and radiation energy, transitions such as σ→σ*, n→σ*, π→π*, and n→π* may occur.
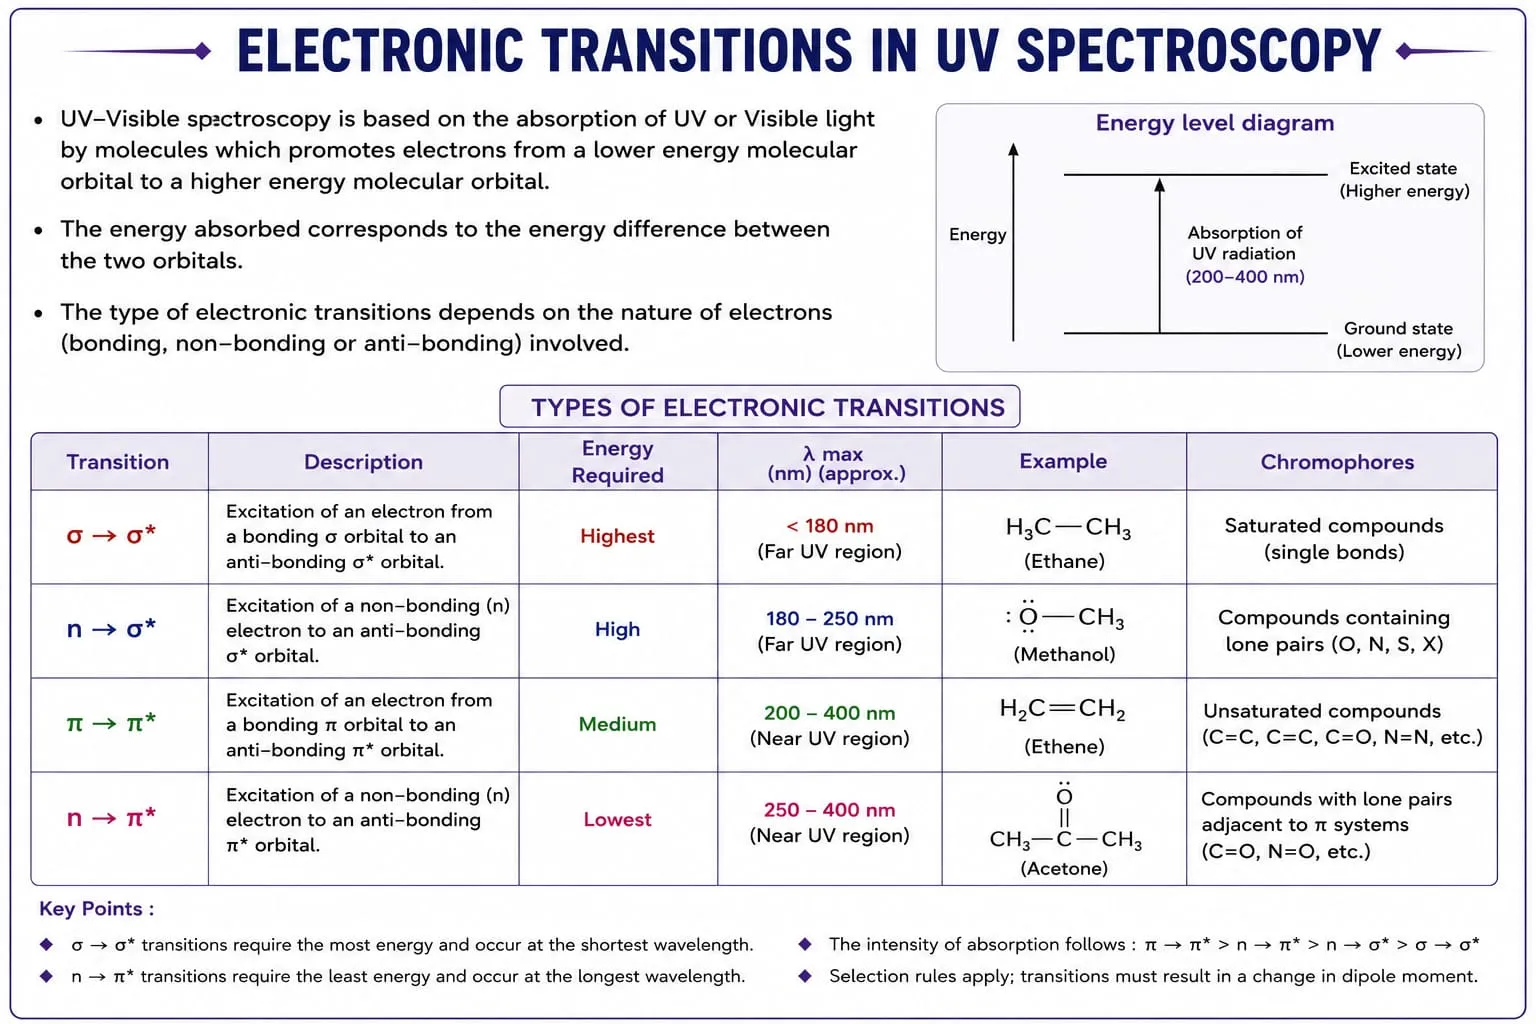
Fig: 1 Electronic Transition
The position and intensity of an absorption band depend on the electronic structure of the absorbing species and its chemical environment. Consequently, an absorption spectrum may be used as a qualitative fingerprint within appropriate experimental conditions, while absorbance measurements at selected wavelengths can be used for quantitative analysis. [3]
BEER–LAMBERT LAW
When a beam of incident radiation (I₀) passes through an absorbing sample, the transmitted intensity (I) is lower than the incident intensity. The Beer–Lambert relationship connects absorbance with the concentration of the absorbing species and the optical path length. It is expressed as:
A = −log(I/I₀) = εbc
where A is absorbance, I₀ is incident intensity, I is transmitted intensity, ε is molar absorptivity, b is the optical path length, and c is the concentration of the absorbing species. Under conditions in which the law is obeyed, a plot of absorbance against concentration is linear and has a slope of εb. This relationship forms the basis of many quantitative UV–Vis assays.
Deviations from ideal linearity may arise from chemical interactions, instrumental limitations, concentration effects, or changes in experimental conditions. Therefore, analytical methods should be developed and validated under controlled conditions rather than assuming unrestricted linearity.[4]
INSTRUMENTATION OF UV–VIS SPECTROPHOTOMETER [5,6]
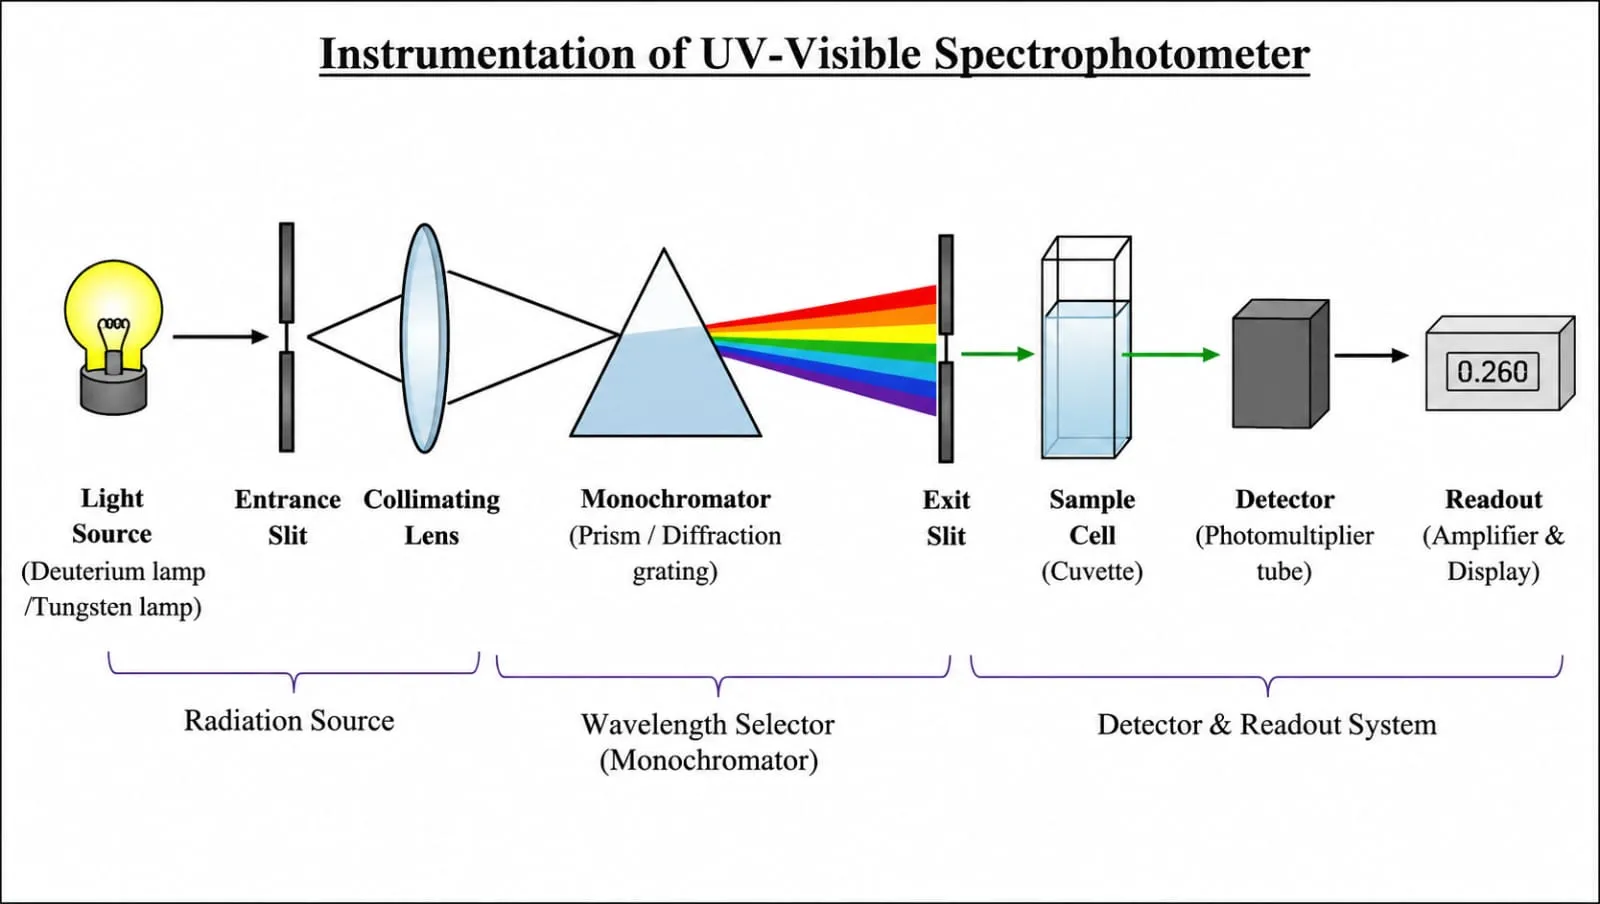
Fig 2: Instrumentation of UV spectrophotometer
A conventional UV–Vis spectrophotometer comprises a radiation source, wavelength-selection system or monochromator, sample compartment containing a suitable cuvette, detector, and electronic signal-processing/recording system. The components operate together to select radiation, pass it through the sample, detect the transmitted radiation, and convert the optical response into a measurable signal.
Radiation Sources
A suitable source should provide stable and sufficiently continuous radiation over the wavelength region required for measurement. The source described in the supplied manuscript includes hydrogen, deuterium, tungsten, and xenon lamps.
Hydrogen lamps can provide continuous ultraviolet radiation and have been described over approximately 160–380 nm. Deuterium discharge lamps are widely used as UV sources and cover approximately 160–450 nm. Tungsten lamps are commonly associated with the visible region, with a practical range of approximately 330–900 nm. Xenon discharge lamps provide broad radiation and may be used over ultraviolet and visible regions depending on instrument design.
Monochromator
The monochromator isolates a selected wavelength or narrow wavelength band from polychromatic radiation. Radiation enters through an entrance slit and is collimated before reaching a dispersing element. A prism or diffraction grating separates the component wavelengths, and the required radiation is directed through the exit slit. The principal elements are therefore the entrance slit, collimating optics, dispersing element, focusing optics, and exit slit.
Two commonly described monochromator configurations are prism monochromators and grating monochromators. Their purpose is the same—controlled wavelength selection—although the dispersion mechanism differs.
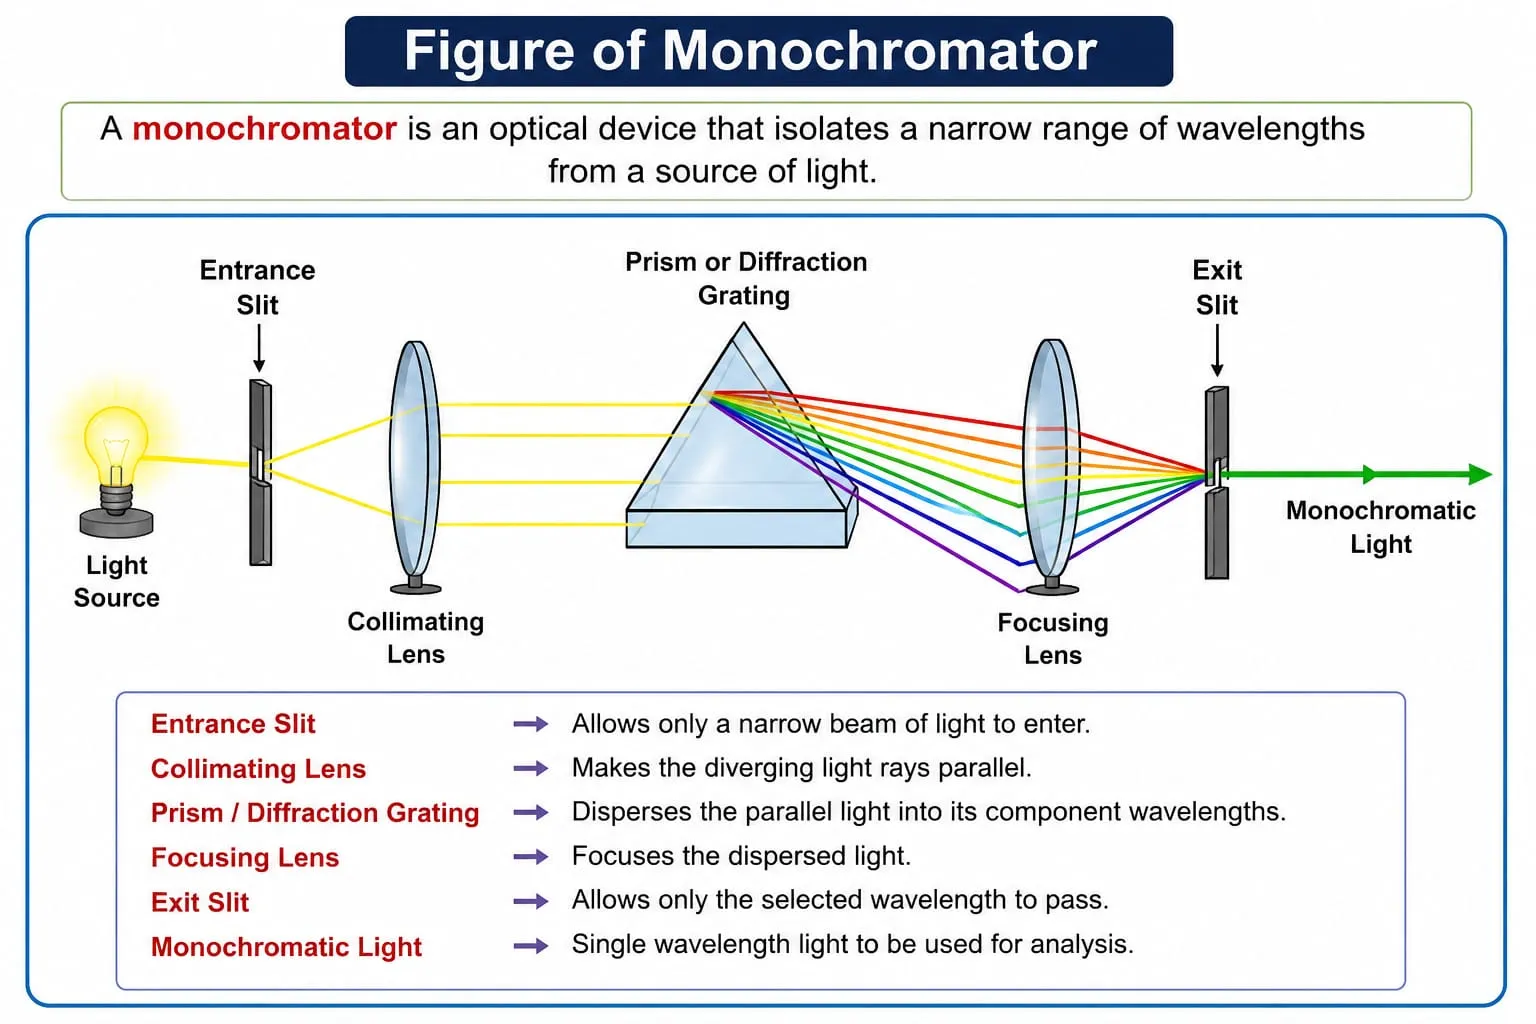
Fig 3: Monochromator
Sample Containers
Cuvettes are optical cells used to contain the sample during measurement. Quartz cells are particularly important for measurements in the ultraviolet region because they transmit UV radiation more effectively than ordinary glass. A standard analytical cuvette commonly has a 1 cm path length. Cell material, cleanliness, orientation, and optical quality can influence measurement reliability.
Detectors
The detector converts transmitted optical radiation into an electrical signal that can be processed by the instrument. The supplied manuscript discusses three traditional detector categories: photovoltaic or barrier-layer cells, phototubes, and photomultiplier tubes.
Photovoltaic or Barrier-Layer Cell [7]
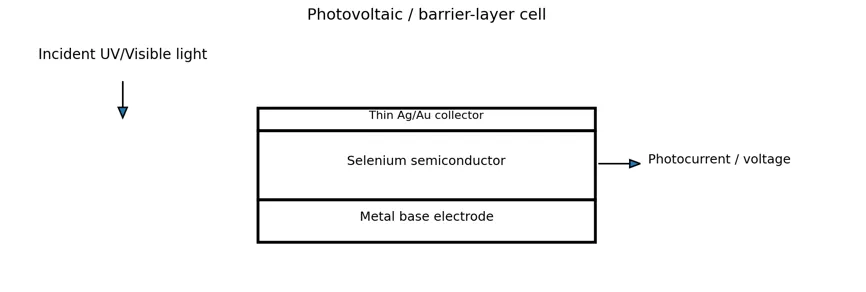
Fig 4: Barrier layer Cell
A photovoltaic detector operates through the photovoltaic effect. Incident radiation generates charge carriers in a photosensitive semiconductor, producing a potential difference and, in a connected circuit, a measurable photocurrent. Traditional teaching descriptions commonly use selenium as the photosensitive material. A conventional barrier-layer cell includes a supporting metal electrode, a semiconductor layer, and a thin collecting layer. The resulting electrical response is related to the radiation reaching the detector.
Phototube
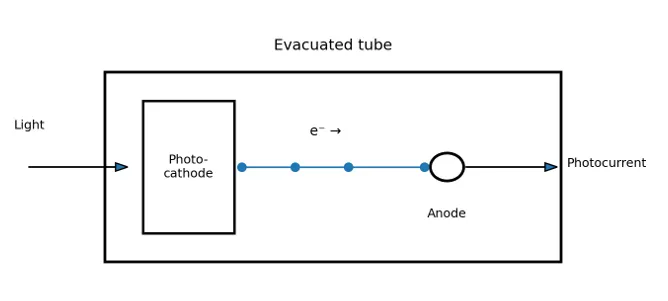
Fig 5: Phototube
A phototube is based on the photoelectric effect. It generally contains a photosensitive cathode and an anode within an evacuated envelope. Radiation striking the cathode can eject electrons, which are attracted toward the positively biased anode. The resulting photocurrent is measured electronically. Unlike a photomultiplier tube, an ordinary phototube does not provide internal secondary-electron multiplication.
Photomultiplier Tube
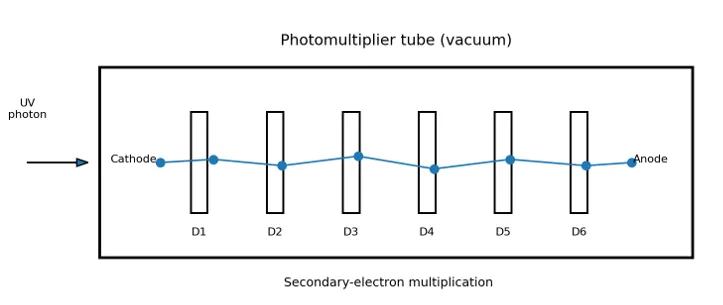
Fig 6: Photomultiplier Tube
A photomultiplier tube (PMT) combines photoelectric conversion with secondary-electron amplification. The main components are a photocathode, focusing electrodes, a sequence of dynodes, and an anode enclosed within a vacuum envelope. Incident radiation produces photoelectrons at the photocathode. These electrons are accelerated toward successive dynodes, where secondary emission multiplies the number of electrons. The amplified electron population is collected at the anode to generate a strong electrical signal. Because of this internal multiplication, PMTs are suitable for detecting relatively weak optical signals.
UV–VIS SPECTROSCOPIC METHODS FOR QUANTITATIVE ANALYSIS
The supplied manuscript identifies several UV–Vis approaches used for analytical estimation, including derivative spectrophotometry, simultaneous-equation methods, the Q-absorbance-ratio method, and absorbance-correction methods. These approaches are particularly relevant when more than one absorbing species contributes to the measured signal.
For multicomponent pharmaceutical systems, spectral overlap can make direct measurement difficult. Recent literature describes mathematical, derivative, and chemometric strategies as approaches for addressing overlapping spectra and improving the determination of individual components.
DERIVATIVE UV SPECTROPHOTOMETRY
Derivative spectrophotometry is obtained by mathematically differentiating the conventional, or zero-order, absorption spectrum with respect to wavelength. Differentiation changes the shape of the spectrum and can make small spectral differences more apparent. This approach is useful for resolving overlapping bands and selecting analytical wavelengths where the contribution from an interfering component is minimized.
Derivative spectra can be generated numerically or through instrument software. The supplied manuscript describes visual, numerical, and zero-crossing approaches. In the zero-crossing method, an analytical wavelength is selected at which the derivative response of one component is zero while the other component retains a measurable response.
Objectives and Analytical Utility
Derivative techniques are used for spectral differentiation, enhancement of spectral resolution, and quantitative analysis. They may reduce the influence of broad background features and help distinguish closely positioned absorption bands. However, differentiation can also amplify noise; therefore, appropriate smoothing, wavelength selection, and validation are important when derivative methods are applied.
Orders of Derivative Spectra [8]
Zero-order spectrum: The conventional absorption spectrum is represented as A = f(λ) and serves as the starting spectrum for derivative processing.
First-order spectrum: The first derivative represents the rate of change of absorbance with wavelength and is expressed as dA/dλ. A characteristic zero-crossing occurs around the maximum of an ideal zero-order absorption band.
Second-order spectrum: The second derivative represents the change in the first derivative with wavelength and is expressed as d²A/dλ². It can sharpen spectral features and assist in separating overlapping bands.
Third-order spectrum: The third derivative is represented by d³A/dλ³ and provides further differentiation of spectral features.
Fourth-order spectrum: The fourth derivative, d⁴A/dλ⁴, can produce sharper spectral features but may also increase sensitivity to experimental noise. The appropriate derivative order should therefore be selected according to the spectral characteristics and analytical purpose.
ADVANTAGES [9]
• Simple operation and relatively rapid measurements.
• Relatively low operating cost compared with several advanced structural techniques.
• Useful for both qualitative characterization and quantitative estimation of suitable absorbing compounds.
• Requires comparatively small sample quantities in routine applications.
• Applicable to pharmaceutical quality-control and research measurements.
• Derivative processing can assist in resolving overlapping absorption bands.
• Useful for studying concentration changes and selected degradation or stability processes.
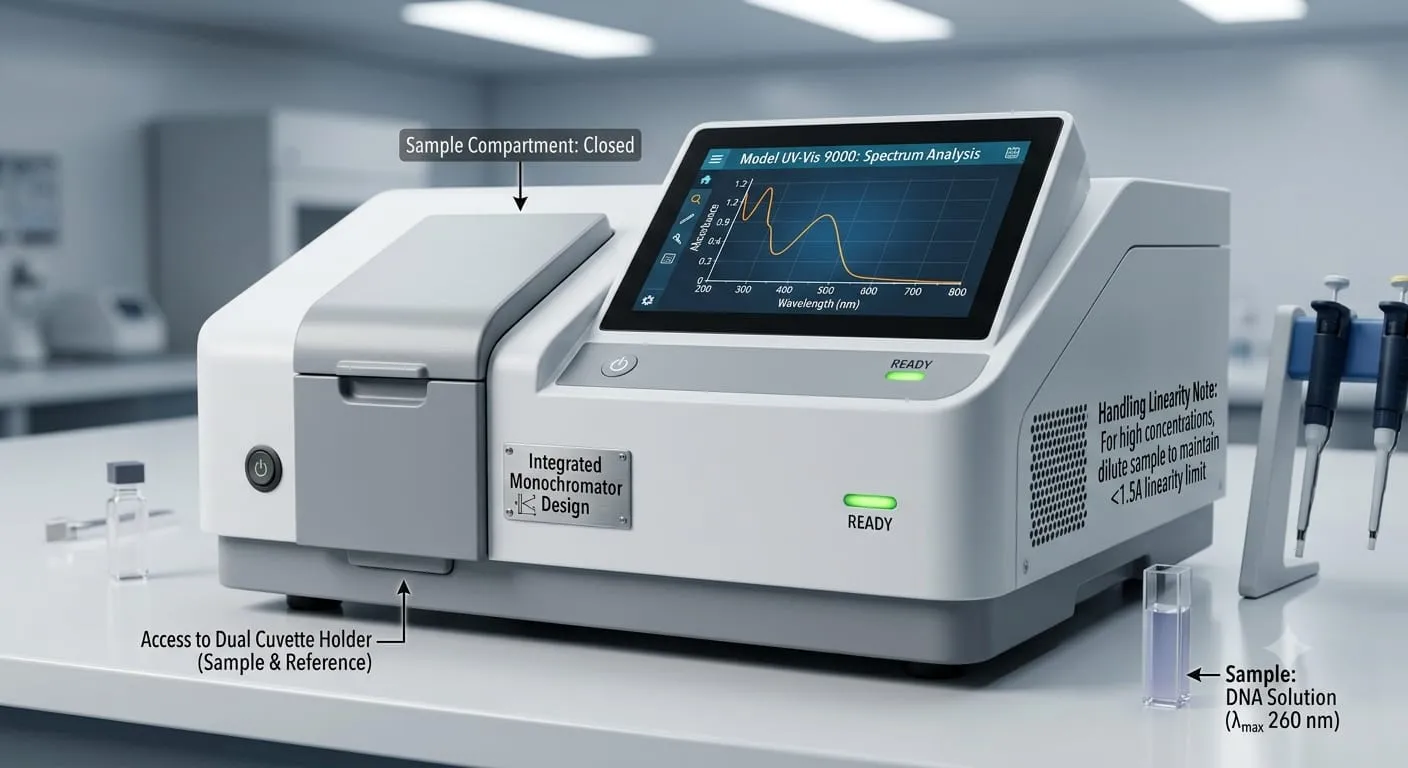
Fig 7: UV Spectrophotometer
DISADVANTAGES [9]
• Direct UV–Vis measurements are most useful for compounds with suitable chromophores or absorbing groups.
• Spectral selectivity may be limited when several components absorb in the same wavelength region.
• Absorption can be affected by solvent, pH, temperature, impurities, and other experimental conditions.
• Accurate cuvette handling, cleanliness, orientation, and matching are important for reproducible results.
• Derivative processing can increase the influence of noise if measurement and mathematical parameters are not appropriately controlled.
• UV–Vis spectra generally provide less structural information than techniques such as NMR or mass spectrometry and are therefore often best interpreted as part of a complementary analytical strategy.
PHARMACEUTICAL AND ANALYTICAL APPLICATIONS [10,11]
• Assay and quantitative estimation of UV-absorbing pharmaceutical substances.
• Detection or monitoring of impurities when adequate spectral differences exist.
• Evaluation of drug stability and selected degradation processes.
• Investigation of chromophores and conjugated systems.
• Characterization of suitable functional-group-related absorption features.
• Analysis of multicomponent formulations using mathematical or derivative approaches.
• Measurement of biomolecules and other absorbing species in bioanalytical applications.
• Applications in environmental, food, biochemical, and materials analysis.
RECENT DEVELOPMENTS AND FUTURE PERSPECTIVES
Recent literature indicates that UV–Vis spectroscopy is increasingly being combined with mathematical modelling, chemometric analysis, improved detectors, and other computational approaches. Such developments are particularly relevant to pharmaceutical samples in which overlapping spectra, impurities, degradation products, or multiple active ingredients reduce the selectivity of direct measurements. Chemometrics-assisted UV–Vis analysis has been investigated for assay, impurity, adulteration, and degradation-product problems, while recent pharmaceutical reviews continue to emphasize derivative and multicomponent methods.
The continuing value of UV–Vis spectroscopy therefore lies not only in the conventional measurement of a single absorbance maximum but also in the integration of reliable instrumentation with appropriate data-processing and method-validation strategies. Where the information obtained from UV–Vis is insufficient for unequivocal identification, complementary analytical techniques should be considered.
CONCLUSION
UV–Vis spectroscopy remains a useful analytical method for the qualitative and quantitative examination of compounds that absorb ultraviolet or visible radiation. Its fundamental basis is the electronic excitation of molecules, while the Beer–Lambert law provides the principal relationship used for quantitative absorbance measurements. A functional UV–Vis spectrophotometer integrates a stable radiation source, wavelength-selection system, sample cell, detector, and electronic signal-processing system. Detector technologies such as photovoltaic cells, phototubes, and photomultiplier tubes provide different approaches to converting optical radiation into measurable electrical signals.
Derivative spectrophotometry further extends the analytical utility of UV–Vis measurements by improving discrimination between closely spaced spectral features and assisting the analysis of overlapping components. Although limitations related to chromophore requirements, spectral overlap, experimental conditions, and detector or cell handling remain, current literature demonstrates continued application of UV–Vis spectroscopy in pharmaceutical and related analytical laboratories. The combination of sound method development, validation, derivative or multicomponent analysis, and modern computational approaches can broaden its analytical usefulness.
REFERENCES




Kushagra Prajapati, Tithi Patel, Dr. Mitali Dalwadi, Patel Jinal, Ultraviolet–Visible Spectroscopy: Principles, Instrumentation, Derivative Methods and Pharmaceutical Applications, Int. J. of Pharm. Sci., 2026, Vol 4, Issue 10, 1407-1415, https://doi.org/10.5281/zenodo.23256635
 10.5281/zenodo.23256635