
We use cookies to ensure our website works properly and to personalise your experience. Cookies policy
Siddhi College of Pharmacy, Chikhali, Pune
Quality is a critical concern in the pharmaceutical industry because medicines must be both safe and therapeutically effective. UV analysis plays an essential role in confirming drug quality, safety and efficacy. Paracetamol (acetaminophen), an active metabolite of phenacetin, is widely used to relieve pain, headaches, and symptoms associated with cold and flu conditions. Numerous brands of paracetamol tablets are available in the Indian pharmaceutical market. The present study aimed to perform a comparative UV analysis of different marketed brands to assess whether the formulations were pharmaceutically equivalent or showed significant variation. A calibration curve was prepared within the concentration range of 1–10 µg/mL and analysed at 243 nm using a Shimadzu UV 1900i double-beam spectrophotometer. Three commercially available brands of 650 mg conventional paracetamol tablets produced by different manufacturers were selected for percentage assay. The percentage purity or assay of different marketed brands varies from each other. The results shows all the tablets are within the acceptable range. The findings from the release kinetic studies indicated that all selected brands complied with acceptable manufacturing quality standards.
Paracetamol is one of the most frequently prescribed non-steroidal anti-inflammatory drugs (NSAIDs) and is extensively used worldwide due to its effectiveness and safety profile. It is commonly administered as an analgesic and antipyretic agent for the management of fever, headaches, muscle pain, toothache, and other minor aches and pains[1-2]. Because of its rapid onset of action and easy availability, paracetamol is included in many over-the-counter medications and combination formulations used for cold and flu treatment. Chemically, paracetamol is identified as 4-hydroxyacetanilide, also known as acetaminophen. Under recommended therapeutic doses, paracetamol is generally regarded as safe and well tolerated by most individuals. However, excessive consumption or overdose of paracetamol can lead to severe hepatotoxicity, which may result in irreversible liver damage and can even become life-threatening. In certain rare cases, liver toxicity may also occur at normal therapeutic doses due to individual hypersensitivity or underlying health conditions. Therefore, maintaining the quality, safety, and efficacy of paracetamol formulations is extremely important in pharmaceutical manufacturing. The therapeutic effectiveness and safety of any pharmaceutical dosage form largely depend on its formulation characteristics and manufacturing process. Variations in excipients, production techniques, storage conditions, and quality control measures may influence the final performance of the dosage form. As a result, differences may exist among marketed products manufactured by different pharmaceutical companies. Ensuring consistent quality is therefore essential to guarantee proper drug release, absorption, and therapeutic action. UV analysis is done to check whether the content of drug matches with the label claim or not. This is the study done on label claim vs the actual content found in different marketed brands of paracetamol tablets[3-4].
AIM
To perform a comparative study of different brands of paracetamol tablets using UV–Visible spectrophotometry by analysing and comparing their pharmaceutical quality parameters, including drug content and compliance with standard specifications.
OBJECTIVES
A= εlc
NEED OF RESEARCH
Paracetamol tablets are among the most widely used over-the-counter analgesic and antipyretic medications worldwide. Numerous pharmaceutical companies manufacture paracetamol tablets using different formulations, excipients, and manufacturing techniques. Although these products contain the same active pharmaceutical ingredient, variations in formulation and production processes may influence the quality, stability, dissolution behaviour, and therapeutic effectiveness of the tablets.[5-7]
Quality evaluation of pharmaceutical preparations is therefore essential to ensure that all marketed brands comply with pharmacopeial standards and provide the desired therapeutic effect. Among the various analytical techniques available, UV–Visible spectrophotometry is widely used because it is simple, rapid, accurate, economical, and suitable for routine quality control analysis of drugs.
The present research is needed to compare different brands of paracetamol tablets in terms of drug content and quality using UV–Visible spectrophotometry. The study will help identify any variation among brands and determine whether the products meet the required specifications and label claims. It also highlights the importance of analytical methods in maintaining the quality, efficacy, and safety of pharmaceutical products available to consumers.[6,8-9]
The need for this research arises due to:
PLAN OF WORK
Title
Comparative Study of Different Brands of Paracetamol Tablets Using UV-Visible Spectrophotometry
1. Selection of Drug and Marketed Brands
2. Literature Review
3. Procurement of Chemicals and Instruments
Chemicals
Instruments
4. Preparation of Standard Solution
5. Determination of λmax of Paracetamol
Typically: λ-max = 243 nm
6. Preparation of Calibration Curve
Based on Beer-Lambert’s Law:
A=εlc
Where:
7. Assay of Paracetamol Tablets by UV Spectrophotometry
Drug content calculation:
% Drug Content=
Standard Absorbance/Sample Absorbance × Sample Concentration/Standard Concentration×100
8. Comparative Data Analysis
10. Interpretation and Conclusion
DRUG PROFILE
Table no.1.
|
Parameter |
Description |
|
Generic Name |
Paracetamol |
|
Synonym |
Acetaminophen |
|
IUPAC Name |
N-(4-hydroxyphenyl)acetamide |
|
Chemical Formula |
C₈H₉NO₂ |
|
Molecular Weight |
151.16 g/mol |
|
Category |
Analgesic and Antipyretic |
|
Drug Class |
Non-opioid analgesic |
|
Pharmacopoeia |
IP, BP, USP |
THERAPEUTIC USES
Paracetamol is used for:
PHYSICOCHEMICAL PROPERTIES
Table no.2.
|
Property |
Description |
|
Melting Point |
168°C – 172°C |
|
Solubility |
Slightly soluble in water; freely soluble in alcohol |
|
pKa |
Approximately 9.5 |
|
λmax (UV) |
243-245 nm |
DOSE
Table no.3.
|
Population |
Dose |
|
Adults |
500–1000 mg every 4–6 hours |
|
Maximum Adult Dose |
4 g/day |
|
Paediatric Dose |
According to body weight |
[1-2]
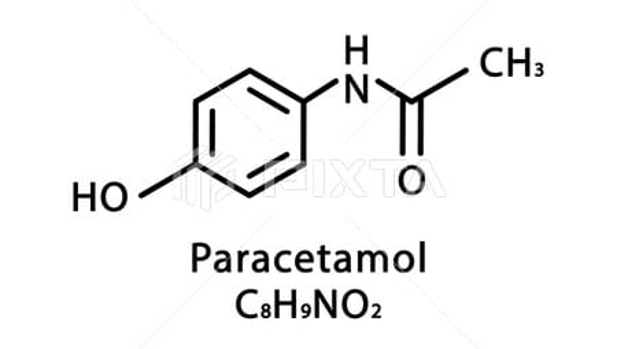
Fig.1. structure of paracetamol
MATERIALS AND EQUIPMENTS
INSTRUMENT :-
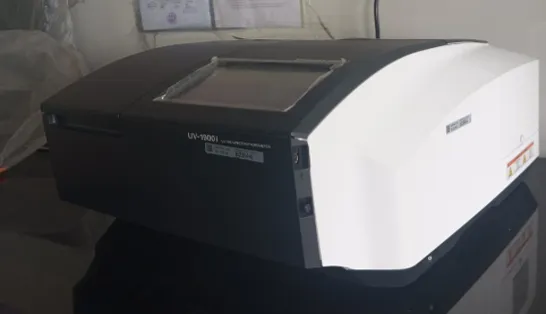
Fig.2. UV spectrophotometer
CHEMICALS :-

fig.3.std paracetamol powder
1. Brand no 1
2. Brand no 2
3.Brand no 3
GLASSWARES:-

Fig.4.volumetric flask ( 100ml )
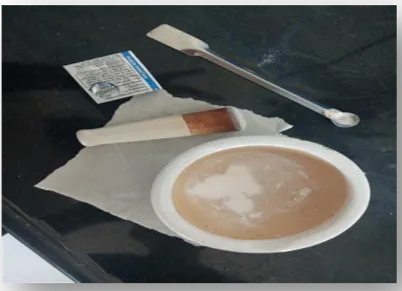
Fig.5. morter & pestle
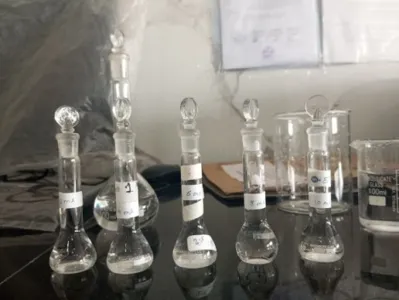
Fig.6. volumetric flask (10ml)
EXPERIMENTAL WORK
1. Determination of Λ-Max of Paracetamol:
Accurately weigh 100 mg of standard paracetamol and transfer into a 100 mL volumetric flask. Dissolve using distilled water and make volume up to 100 ml. Further dilute the solution to obtain suitable concentration. Scan the solution in UV range 200–400 nm using UV spectrophotometer. Record wavelength of maximum absorbance.
Observe λ-max = 243 nm
2. Preparation of Calibration Curve
Procedure
Beer-Lambert law: A=εbc [3-10]
Assay of Paracetamol Tablets by UV Spectrophotometry
Procedure
Drug content calculation:
% Drug Content=
Standard Absorbance/Sample Absorbance x Concentration Standard/Sample Concentration ×100
SPECTRA :-
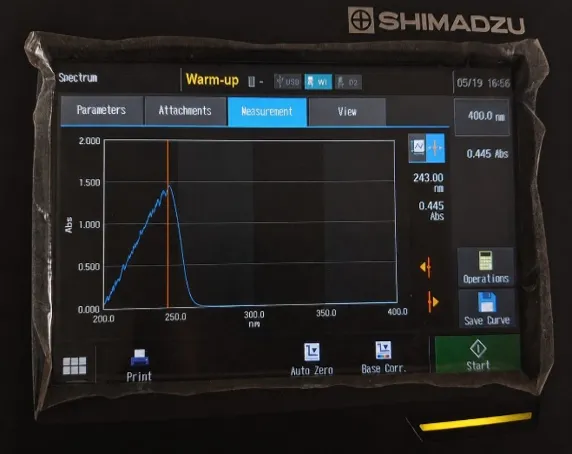
Fig.7. BRAND N0 3
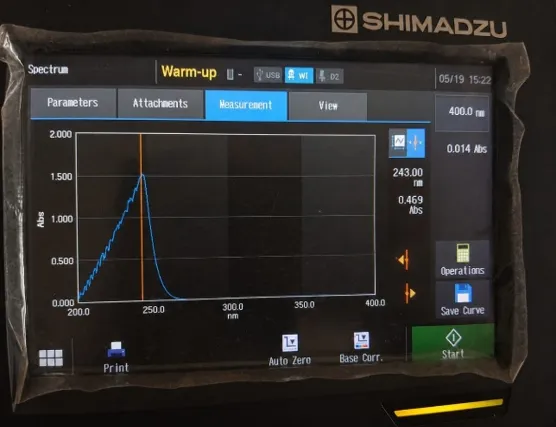
Fig.8. STD Paracetamol
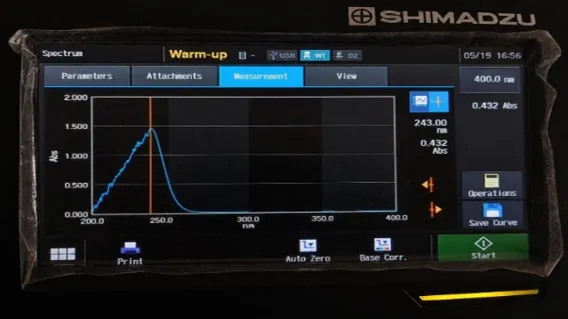
Fig.9. BRAND NO 1
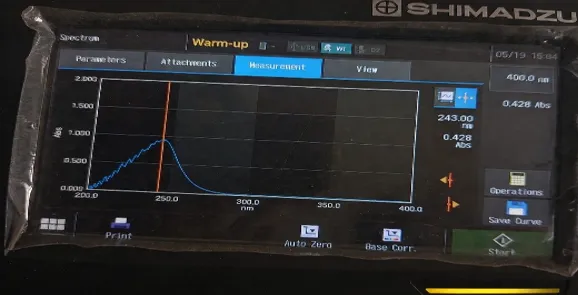
Fig.10. BRAND NO 2
OBSERVATION :-
STD Paracetamol:-
Table no.4.
|
Dilutions |
Absorbance (243nm) |
|
2ml |
0.399 |
|
4ml |
0.417 |
|
6ml |
0.432 |
|
8ml |
0.433 |
|
10ml |
0.469 |
BRAND NO 2–
Table no.5.
|
Dilutions |
Absorbance (243nm) |
|
2ml |
0.397 |
|
4ml |
0.407 |
|
6ml |
0.422 |
|
8ml |
0.432 |
|
10ml |
0.428 |
BRAND NO 1–
Table no.6.
|
Dilutions |
Absorbance (243nm) |
|
2ml |
0.392 |
|
4ml |
0.410 |
|
6ml |
0.428 |
|
8ml |
0.430 |
|
10ml |
0.432 |
BRAND NO 3 -
Table no.7.
|
Dilutions |
Absorbance (243nm) |
|
2ml |
0.398 |
|
4ml |
0.412 |
|
6ml |
0.427 |
|
8ml |
0.434 |
|
10ml |
0.445 |
CALCULATION –
% Drug Content=
Standard Absorbance/Sample Absorbance x Concentration Standard/Sample Concentration ×100
1.Std Paracetamol and BRAND NO 2
0.469/0.428 X 10/10 = 1.09µg/mL
2.Std Paracetamol and BRAND NO 1
0.469/0.432 X 10/10 = 1.08µg/mL
3.Std Paracetamol and BRAND NO 3
0.469/0.445 X 10/10 = 1.05µg/mL
% ASSAY = Abs. Sample / Abs. STD X 100
1. Std. Paracetamol And BRAND NO 2 -
0.428/0.469 X 100 = 91.25%
2. Std. Paracetamol And BRAND NO 1–
0.432/0.469 X 100 = 92.11%
3. Std. Paracetamol And BRAND NO 3 –
0.445/0.469 X 100 = 94.88%
RESULT
The comparative analysis of different brands of paracetamol tablets was successfully carried out using UV–Visible spectrophotometry at 243 nm. The absorbance values obtained for the marketed formulations were compared with that of the standard paracetamol solution.
The standard paracetamol showed an absorbance of 0.469 corresponding to 100% assay. Among the tested tablet brands, brand no 3 exhibited the highest assay value of 94.88% with an absorbance of 0.445, indicating closer compliance with the standard preparation. brand no 1 showed an assay value of 92.11% with an absorbance of 0.432, while brand no 2 showed 91.25% assay with an absorbance of 0.428.
The percentage assay values of all tested brands were found to be within acceptable pharmacopeial limits, indicating that the formulations contain adequate amounts of active pharmaceutical ingredient. However, slight variations in absorbance and assay values were observed among different brands, which may be attributed to differences in formulation and manufacturing processes.
The study confirms that UV–Visible spectrophotometry is a simple, accurate, rapid, and economical method for the comparative evaluation and quality control analysis of paracetamol tablet formulations.
Table no.8.
|
Sr. No. |
Brand Name |
Absorbance at 243 nm |
% Assay |
|
1 |
Standard PARACETAMOL |
0.469 |
100% |
|
2 |
Brand no 2 |
0.428 |
91.25% |
|
3 |
Brand no 1 |
0.432 |
92.11% |
|
4 |
Brand no 3 |
0.445 |
94.88% |
DISCUSSION
The present study was carried out to compare different marketed brands of paracetamol tablets using UV–Visible spectrophotometry at 243 nm. UV spectrophotometric analysis is widely accepted for routine quality control because of its simplicity, precision, rapidity, and cost-effectiveness. In this study, the absorbance of standard paracetamol solution was found to be 0.469, which was considered as 100% assay. The absorbance values obtained for different marketed brands were compared with the standard to determine the percentage assay of each formulation.
Among the tested brands, Brand no 3 showed the highest absorbance value of 0.445 with an assay value of 94.88%, indicating better conformity with the standard formulation. Brand no 1 exhibited an absorbance of 0.432 corresponding to 92.11% assay, while showed a Brand No 2 absorbance of 0.428 with 91.25% assay. Although slight variations were observed among the brands, all formulations were found to contain acceptable amounts of paracetamol within pharmacopeial limits.
The differences in assay values may be due to variation in manufacturing methods, excipients used, granulation process, storage conditions, or quality control procedures adopted by different pharmaceutical companies. However, the variation was not significant enough to affect the overall quality and efficacy of the formulations. [6,8,]
The study demonstrates that UV–Visible spectrophotometry is an effective analytical technique for the estimation of paracetamol in tablet dosage forms. The method proved to be reliable for comparative evaluation of different brands and can be used successfully for routine pharmaceutical analysis and quality assurance purposes.
Overall, the findings indicate that the selected marketed brands of paracetamol tablets possess satisfactory drug content and comply with acceptable quality standards.[9-11]
CONCLUSION
The present study successfully compared different brands of paracetamol tablets using UV spectrophotometric analysis at 243 nm. The method was found to be simple, rapid, convenient, and reliable for estimation of drug content.
The assay results showed slight variations among the selected marketed brands. Among them, Paracip 650 showed the highest percentage assay value of 94.88%, followed by BRAND NO 1with 92.11% and Alcem Para 650 with 91.25%. Despite minor differences, all tested formulations were found to contain acceptable amounts of paracetamol within pharmacopeial limits.
The study indicates that the marketed brands analyzed possess satisfactory quality and comply with standard specifications for drug content. The observed variations may be due to differences in formulation techniques, excipients, and manufacturing processes adopted by different pharmaceutical companies.
Therefore, UV–Visible spectrophotometry can be effectively used as a reliable analytical tool for comparative drug analysis and quality control of paracetamol tablet formulations in pharmaceutical industries and research laboratories.
REFERENCES


Shivkanya Gadkar, Anushka Shingade, Megha Hange, Dr. P. N. Sable, Comparative UV Spectrophotometric Analysis of Different Brands of Paracetamol Tablets, Int. J. of Pharm. Sci., 2026, Vol 4, Issue 6, 5311-5322. https://doi.org/10.5281/zenodo.20772868
 10.5281/zenodo.20772868