
We use cookies to ensure our website works properly and to personalise your experience. Cookies policy
1 Department of Pharmaceutics, DCS’S A. R. A. College of Pharmacy, Nagaon, Dhule
2 NES’s Gangamai College of Pharmacy, Nagaon, Dhule.
Lipid-based nanoemulsions are frequently proposed for improving the oral performance of poorly water-soluble BCS Class II drugs; however, formulation studies must distinguish in vitro dissolution enhancement from proven in vivo bioavailability. This comparative pharmaceutical analysis evaluated a pure glimepiride suspension, a conventional formulation dispersion, a preliminary nanoemulsion and an optimized nanoemulsion using a model dissolution and quality-attribute dataset. The formulations were compared for solubility-screening rationale, globule or particle size, PDI, zeta potential, transmittance, drug content, thermodynamic stability, cumulative release, dissolution efficiency, f1/f2 profile comparison, release-kinetic behaviour and ANOVA-based statistical separation. The optimized nanoemulsion showed a globule size of 68.9 ± 2.8 nm, PDI of 0.109 ± 0.011, zeta potential of -32.6 ± 1.3 mV, drug content of 99.2 ± 0.6%, transmittance of 98.8 ± 0.5% and 97.2% release at 120 min. Dissolution efficiency at 120 min increased from 28.59% for pure drug suspension to 77.81% for the optimized nanoemulsion, giving a dissolution-based predicted enhancement ratio of 2.722. Profile comparison showed marked dissimilarity between the pure drug and nanoemulsion curves, and ANOVA indicated statistically significant group differences. The findings support nanoemulsion formulation as a strong in vitro strategy for glimepiride dissolution enhancement, but true bioavailability enhancement requires pharmacokinetic confirmation.
The formulation challenge for BCS Class II drugs is not the absence of membrane permeability but the insufficient quantity of dissolved drug available at the absorption site [1-3]. For such compounds, formulation technologies that increase apparent solubility, reduce dispersion size and accelerate release can improve the likelihood of absorption, although in vitro improvement cannot by itself prove systemic exposure.
Glimepiride remains a relevant model antidiabetic drug for formulation research because it is clinically indicated for type 2 diabetes mellitus and has low aqueous solubility that limits dissolution performance [4,5]. Recent glimepiride studies have explored solid nanodispersions, spray-frozen nanoparticles, SNEDDS-loaded liquisolid tablets and nanoemulgel systems [12-15]. These reports establish the molecule as a suitable model for solubility-driven delivery-system development.
Nanoemulsions and related self-emulsifying systems can improve dispersion of hydrophobic drugs through a lipidic internal phase stabilized by surfactant and co-surfactant components [6-11]. Their value should be assessed by a complete quality-attribute package rather than a single release value. Globule size, PDI, zeta potential, transmittance, drug content, dilution stability and release profile shape are all relevant to formulation decisions.
This manuscript therefore uses a comparative design. A pure drug suspension represents the solubility-limited baseline, a conventional dispersion represents a simpler non-nano carrier approach, NE-7 represents a preliminary nanoemulsion and NE-OPT represents the optimized nanoemulsion. This structure allows the formulation benefit of nanoscale lipid dispersion to be separated from the general benefit of using any solubilizing formulation.
The phrase dissolution-based bioavailability enhancement is used carefully. True bioavailability refers to the rate and extent of systemic drug exposure measured through pharmacokinetic data. Since the present work contains no plasma concentration, animal or human data, the study reports dissolution efficiency and release behaviour as predictors only. Regulatory and statistical profile-comparison tools are used descriptively and not as formal bioequivalence evidence [21,22].
MATERIALS AND METHODS
Comparative study design:
Four formulation states were compared: pure drug suspension, conventional formulation dispersion, preliminary nanoemulsion NE-7 and optimized nanoemulsion NE-OPT. The comparisons were restricted to in vitro pharmaceutical performance. No human, animal or pharmacokinetic component was included.
Excipient-screening strategy:
Capryol 90, Labrasol and Transcutol P were selected as oil, surfactant and co-surfactant respectively after model solubility screening. The pure drug suspension used the same release medium without specialized solubilizing excipients. The conventional dispersion represented a non-nano formulation improvement using wetting and hydrophilic carrier principles.
Preparation of nanoemulsion formulations:
The preliminary nanoemulsion was conceptualized using a moderate Smix ratio and controlled sonication. The optimized nanoemulsion was obtained by adjusting oil load, Smix concentration and sonication time to reduce globule size, improve PDI and maintain high drug content. Preparation conditions should be replaced by exact laboratory parameters when the formulation is experimentally reproduced.
Characterization:
Nanoemulsion groups were evaluated for globule size, PDI, zeta potential, transmittance and drug content. Pure drug suspension and conventional dispersion were evaluated for drug content and release behaviour; PDI and zeta potential were not assigned where the parameters were not meaningful for coarse non-nanoemulsion controls.
Thermodynamic and stress stability:
Stability was conceptualized through dilution stability, centrifugation, heat-cool cycling and freeze-thaw stress. Absence of phase separation, precipitation and marked turbidity change would be required before further release testing. A complete experimental report should include cycle number, temperature, duration, centrifugation speed and post-stress droplet size.
In vitro release and dissolution efficiency:
Cumulative release was assessed at 0, 5, 10, 15, 30, 45, 60, 90 and 120 min using a model dialysis-membrane release method under sink conditions. Dissolution efficiency at 120 min was calculated from the area under the dissolution curve as DE120 (%) = [AUC0-120/(100 × 120)] × 100. The predicted enhancement ratio was calculated as DE120 of the test formulation divided by DE120 of the pure drug suspension.
Dissolution profile comparison:
The f1 difference factor and f2 similarity factor were calculated from mean dissolution values excluding the zero time point. Pure drug suspension was used as the reference profile for comparison with the conventional formulation, NE-7 and NE-OPT. NE-7 and NE-OPT were also compared to determine whether optimization materially changed the release profile [21,22].
Statistical analysis:
Descriptive statistics summarized replicate observations. One-way ANOVA compared terminal release and dissolution efficiency among the four formulation groups. Tukey-style post-hoc interpretation identified pairwise differences. A p value below 0.05 was considered statistically significant, but practical relevance was interpreted together with effect magnitude, stability and formulation feasibility.
Data integrity position:
The dataset is a modelled comparative dataset and is not a substitute for original laboratory data. Before journal submission as empirical research, all numerical values must be replaced by measured batch records, raw instrument outputs, validated assay files and reproducible experimental logs.
RESULTS AND DISCUSSION
Solubility-screening outcome:
The vehicle screen showed that Transcutol P, Labrasol and Capryol 90 produced the strongest solubilizing pattern among co-surfactants, surfactants and oils respectively (Table 1; Fig. 1). This justified the selected nanoemulsion platform and also explained why the conventional dispersion was expected to perform better than pure drug suspension but below the optimized nanosystem.
Comparative characterization:
The optimized nanoemulsion outperformed the preliminary nanoemulsion in key quality attributes. Globule size decreased from 118.6 ± 4.3 nm in NE-7 to 68.9 ± 2.8 nm in NE-OPT, while PDI decreased from 0.214 ± 0.018 to 0.109 ± 0.011 (Table 2). The zeta potential shifted from -24.8 ± 1.1 mV to -32.6 ± 1.3 mV (Fig. 2). Drug content and transmittance were also highest in NE-OPT, supporting improved dispersion clarity and loading consistency.
Release profile interpretation:
The release curves separated progressively across the formulation sequence (Table 3; Fig. 3). Pure drug suspension reached only 44.8% release at 120 min, conventional formulation reached 62.4%, NE-7 reached 88.9% and NE-OPT reached 97.2%. The stepwise improvement supports the interpretation that both solubilizing excipients and nanoscale lipid dispersion contributed to release enhancement, with optimization adding further benefit beyond preliminary nanoemulsion formation.
Dissolution efficiency and predicted enhancement:
Dissolution efficiency provided a stronger comparative metric than a single terminal release point because it captured the entire release profile. DE120 increased from 28.59% for the pure drug suspension to 77.81% for the optimized nanoemulsion (Table 4; Fig. 4). The predicted enhancement ratio of 2.722 should be read as a dissolution-efficiency ratio, not as a measured pharmacokinetic bioavailability ratio.
Profile comparison by f1 and f2:
The f1/f2 analysis confirmed major profile dissimilarity between pure drug suspension and nanoemulsion formulations (Table 5). The pure drug versus optimized nanoemulsion comparison showed a high f1 value of 194.76 and an f2 value of 16.63, reflecting substantial curve separation. NE-7 and NE-OPT were also not formally similar by the usual f2 ≥ 50 convention, indicating that optimization changed not only the final release value but also the release profile shape.
Statistical and post-hoc interpretation:
Replicate values showed clear separation among formulation groups for terminal release and DE120 (Table 6). Post-hoc results indicated significant pairwise differences across all main comparisons (Table 7). These results should be considered statistically illustrative because the dataset is modelled, but the analysis framework is appropriate for real formulation data once generated.
Release kinetics and stability:
The optimized nanoemulsion was described more strongly by first-order and Korsmeyer-Peppas equations than by zero-order kinetics (Table 8). Stability data showed an increase in globule size from 68.9 nm initially to 79.8 nm after accelerated storage for three months, with drug content and release remaining above 96% and 93%, respectively (Table 9; Fig. 5). This pattern suggests promising physical robustness but still requires real-time and accelerated validation.
Overall pharmaceutical significance:
The comparative design makes the manuscript stronger than a single optimized-batch report. It demonstrates that nanoemulsion optimization improved multiple quality attributes and dissolution metrics over both pure drug and simpler conventional formulation controls. At the same time, it avoids overclaiming by restricting interpretation to in vitro pharmaceutical performance and predicted dissolution-based enhancement.
CONCLUSION
The optimized nanoemulsion formulation showed superior in vitro pharmaceutical performance compared with pure drug suspension, conventional dispersion and preliminary nanoemulsion. The formulation achieved nanoscale globule size, low PDI, higher negative zeta potential, high transmittance, acceptable drug content, stronger cumulative release and higher dissolution efficiency. The comparative framework supports nanoemulsion optimization as a rational route for dissolution enhancement of glimepiride-like BCS Class II antidiabetic drugs. However, the term bioavailability enhancement should remain dissolution-based until confirmed by pharmacokinetic studies. The manuscript is therefore suitable as a structured pharmaceutics research draft after replacement of model values with verified laboratory data.
CONFLICT OF INTEREST
The author(s) declare no conflict of interest.
REFERENCES
TABLES AND FIGURE TITLES AND LEGEND
TABLE 1: SOLUBILITY SCREENING FOR COMPARATIVE NANOEMULSION DESIGN
|
Vehicle |
Role |
Mean solubility (mg/mL) |
SD |
|
Capryol 90 |
Oil |
28.62 |
1.240 |
|
Labrafil M 1944 CS |
Oil |
20.77 |
0.880 |
|
Oleic acid |
Oil |
16.84 |
0.710 |
|
MCT oil |
Oil |
12.39 |
0.650 |
|
Soybean oil |
Oil |
3.260 |
0.190 |
|
Labrasol |
Surfactant |
58.15 |
2.110 |
|
Kolliphor EL |
Surfactant |
51.46 |
1.980 |
|
Tween 80 |
Surfactant |
44.08 |
1.670 |
|
Span 80 |
Surfactant |
9.730 |
0.400 |
|
Transcutol P |
Co-surfactant |
74.92 |
3.050 |
|
PEG 400 |
Co-surfactant |
49.76 |
1.800 |
|
Propylene glycol |
Co-surfactant |
35.18 |
1.510 |
|
Ethanol |
Co-surfactant |
42.22 |
1.620 |
Note. Values are modelled mean ± SD style data and should be replaced by laboratory results before submission.
TABLE 2: COMPARATIVE CHARACTERIZATION OF FORMULATION GROUPS
|
Formulation |
Globule/particle size (nm) |
PDI |
Zeta potential (mV) |
Drug content (%) |
Transmittance (%) |
|
Pure drug suspension |
Not applicable |
Not applicable |
Not applicable |
96.4 ± 1.2 |
8.6 ± 0.7 |
|
Conventional dispersion |
>5000 (coarse dispersion) |
Not applicable |
Not applicable |
97.2 ± 1.0 |
36.3 ± 1.8 |
|
Nanoemulsion NE-7 |
118.6 ± 4.3 |
0.214 ± 0.018 |
-24.8 ± 1.1 |
98.4 ± 0.8 |
96.1 ± 1.1 |
|
Optimized nanoemulsion NE-OPT |
68.9 ± 2.8 |
0.109 ± 0.011 |
-32.6 ± 1.3 |
99.2 ± 0.6 |
98.8 ± 0.5 |
Note. Non-nanoemulsion controls were not assigned PDI or zeta potential where those parameters were not meaningful.
TABLE 3: COMPARATIVE IN VITRO RELEASE PROFILES
|
Time (min) |
Pure drug suspension (%) |
Conventional formulation (%) |
Nanoemulsion NE-7 (%) |
Optimized nanoemulsion (%) |
|
0.00 |
0.00 |
0.00 |
0.00 |
0.00 |
|
5.000 |
3.100 |
8.700 |
14.50 |
20.10 |
|
10.00 |
6.400 |
16.90 |
26.70 |
36.90 |
|
15.00 |
11.30 |
24.60 |
38.40 |
52.40 |
|
30.00 |
18.50 |
35.20 |
54.90 |
69.80 |
|
45.00 |
26.80 |
44.90 |
66.70 |
80.90 |
|
60.00 |
33.00 |
51.60 |
74.30 |
88.30 |
|
90.00 |
39.20 |
58.10 |
82.50 |
94.10 |
|
120.00 |
44.80 |
62.40 |
88.90 |
97.20 |
Note. Cumulative release values are expressed as percentages.
TABLE 4: DISSOLUTION EFFICIENCY AND PREDICTED ENHANCEMENT RATIO
|
Formulation |
Dissolution efficiency DE120 (%) |
Predicted enhancement ratio |
Release at 120 min (%) |
|
Pure drug suspension |
28.59 |
1.000 |
44.80 |
|
Conventional formulation |
45.13 |
1.579 |
62.40 |
|
Nanoemulsion NE-7 |
65.78 |
2.301 |
88.90 |
|
Optimized nanoemulsion |
77.81 |
2.722 |
97.20 |
Note. Predicted enhancement is based only on in vitro dissolution efficiency.
TABLE 5: DISSOLUTION PROFILE COMPARISON USING f1 AND f2 FACTORS
|
Comparison |
f1 difference factor |
f2 similarity factor |
|
Pure drug suspension vs Conventional formulation |
65.16 |
40.35 |
|
Pure drug suspension vs Nanoemulsion NE-7 |
144.07 |
22.88 |
|
Pure drug suspension vs Optimized nanoemulsion |
194.76 |
16.63 |
|
Nanoemulsion NE-7 vs Optimized nanoemulsion |
20.77 |
45.94 |
Note. The profile comparisons are descriptive and are not presented as bioequivalence evidence.
TABLE 6: REPLICATE DATASET FOR STATISTICAL ANALYSIS
|
Formulation |
Release at 120 min (%) |
DE120 (%) |
|
Pure drug suspension |
43.90 |
27.80 |
|
Pure drug suspension |
44.80 |
28.40 |
|
Pure drug suspension |
45.60 |
29.00 |
|
Conventional formulation |
61.10 |
39.50 |
|
Conventional formulation |
62.40 |
40.30 |
|
Conventional formulation |
63.20 |
41.20 |
|
Nanoemulsion NE-7 |
87.60 |
63.50 |
|
Nanoemulsion NE-7 |
88.90 |
64.40 |
|
Nanoemulsion NE-7 |
90.20 |
65.20 |
|
Optimized nanoemulsion |
96.40 |
75.20 |
|
Optimized nanoemulsion |
97.20 |
76.40 |
|
Optimized nanoemulsion |
98.10 |
77.10 |
Note. Replicate values are modelled values used to demonstrate ANOVA interpretation.
TABLE 7: POST-HOC COMPARISON FOR 120-MIN RELEASE
|
Group 1 |
Group 2 |
Mean difference |
Adjusted p |
Lower CI |
Upper CI |
Reject H0 |
|
Conventional formulation |
Nanoemulsion NE-7 |
26.67 |
0.00 |
23.97 |
29.36 |
Yes |
|
Conventional formulation |
Optimized nanoemulsion |
35.00 |
0.00 |
32.30 |
37.70 |
Yes |
|
Conventional formulation |
Pure drug suspension |
-17.47 |
0.00 |
-20.16 |
-14.77 |
Yes |
|
Nanoemulsion NE-7 |
Optimized nanoemulsion |
8.333 |
0.00 |
5.635 |
11.03 |
Yes |
|
Nanoemulsion NE-7 |
Pure drug suspension |
-44.13 |
0.00 |
-46.83 |
-41.44 |
Yes |
|
Optimized nanoemulsion |
Pure drug suspension |
-52.47 |
0.00 |
-55.16 |
-49.77 |
Yes |
Note. All pairwise comparisons showed statistical separation in the model dataset.
TABLE 8: RELEASE-KINETIC FITTING FOR OPTIMIZED NANOEMULSION
|
Model |
Linearized equation |
Slope/exponent |
R² |
|
Zero-order |
Q = k0t + C |
0.722 |
0.743 |
|
First-order |
log(100-Q) = logQ0 - k1t/2.303 |
-0.013 |
0.990 |
|
Higuchi |
Q = kH sqrt(t) + C |
9.431 |
0.931 |
|
Korsmeyer-Peppas |
log(Mt/M∞) = n log(t) + logK |
0.873 |
1.000 |
|
Hixson-Crowell |
W0^1/3 - Wt^1/3 = kHCt |
0.026 |
0.927 |
Note. R² values are descriptive measures of model fit.
TABLE 9: STABILITY PROFILE OF OPTIMIZED NANOEMULSION
|
Condition |
Globule size (nm) |
PDI |
Drug content (%) |
Release at 120 min (%) |
|
Initial |
68.90 |
0.109 |
99.20 |
97.20 |
|
25 °C/60% RH - 1 month |
70.40 |
0.116 |
98.80 |
96.50 |
|
25 °C/60% RH - 3 months |
73.60 |
0.129 |
98.20 |
95.10 |
|
40 °C/75% RH - 1 month |
74.20 |
0.136 |
97.70 |
94.80 |
|
40 °C/75% RH - 3 months |
79.80 |
0.153 |
96.80 |
93.20 |
Note. Stability values are modelled and require laboratory confirmation.
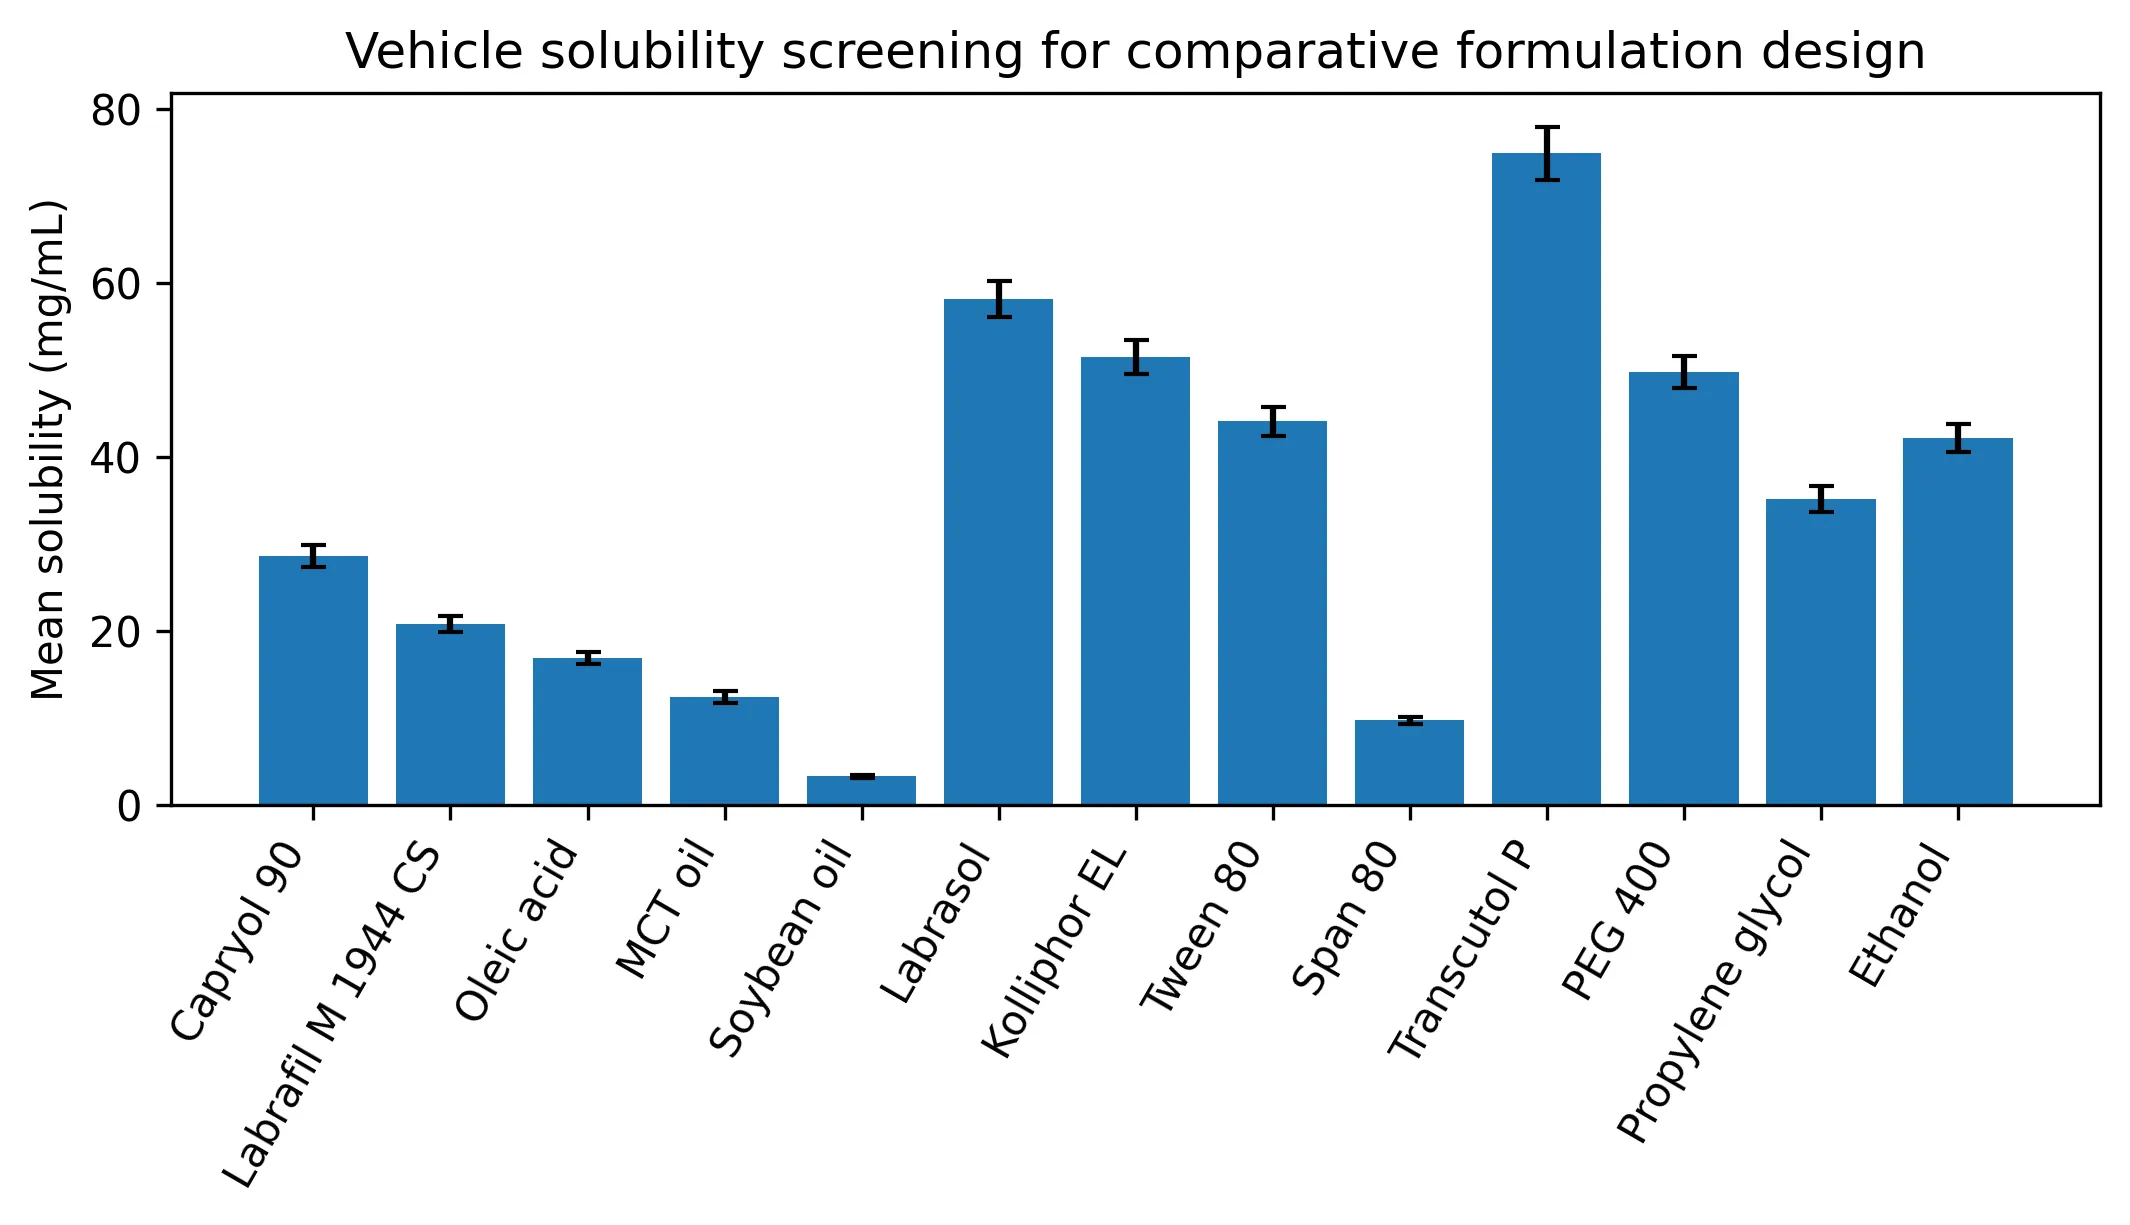
Fig. 1: Vehicle solubility screening for the comparative formulation study.
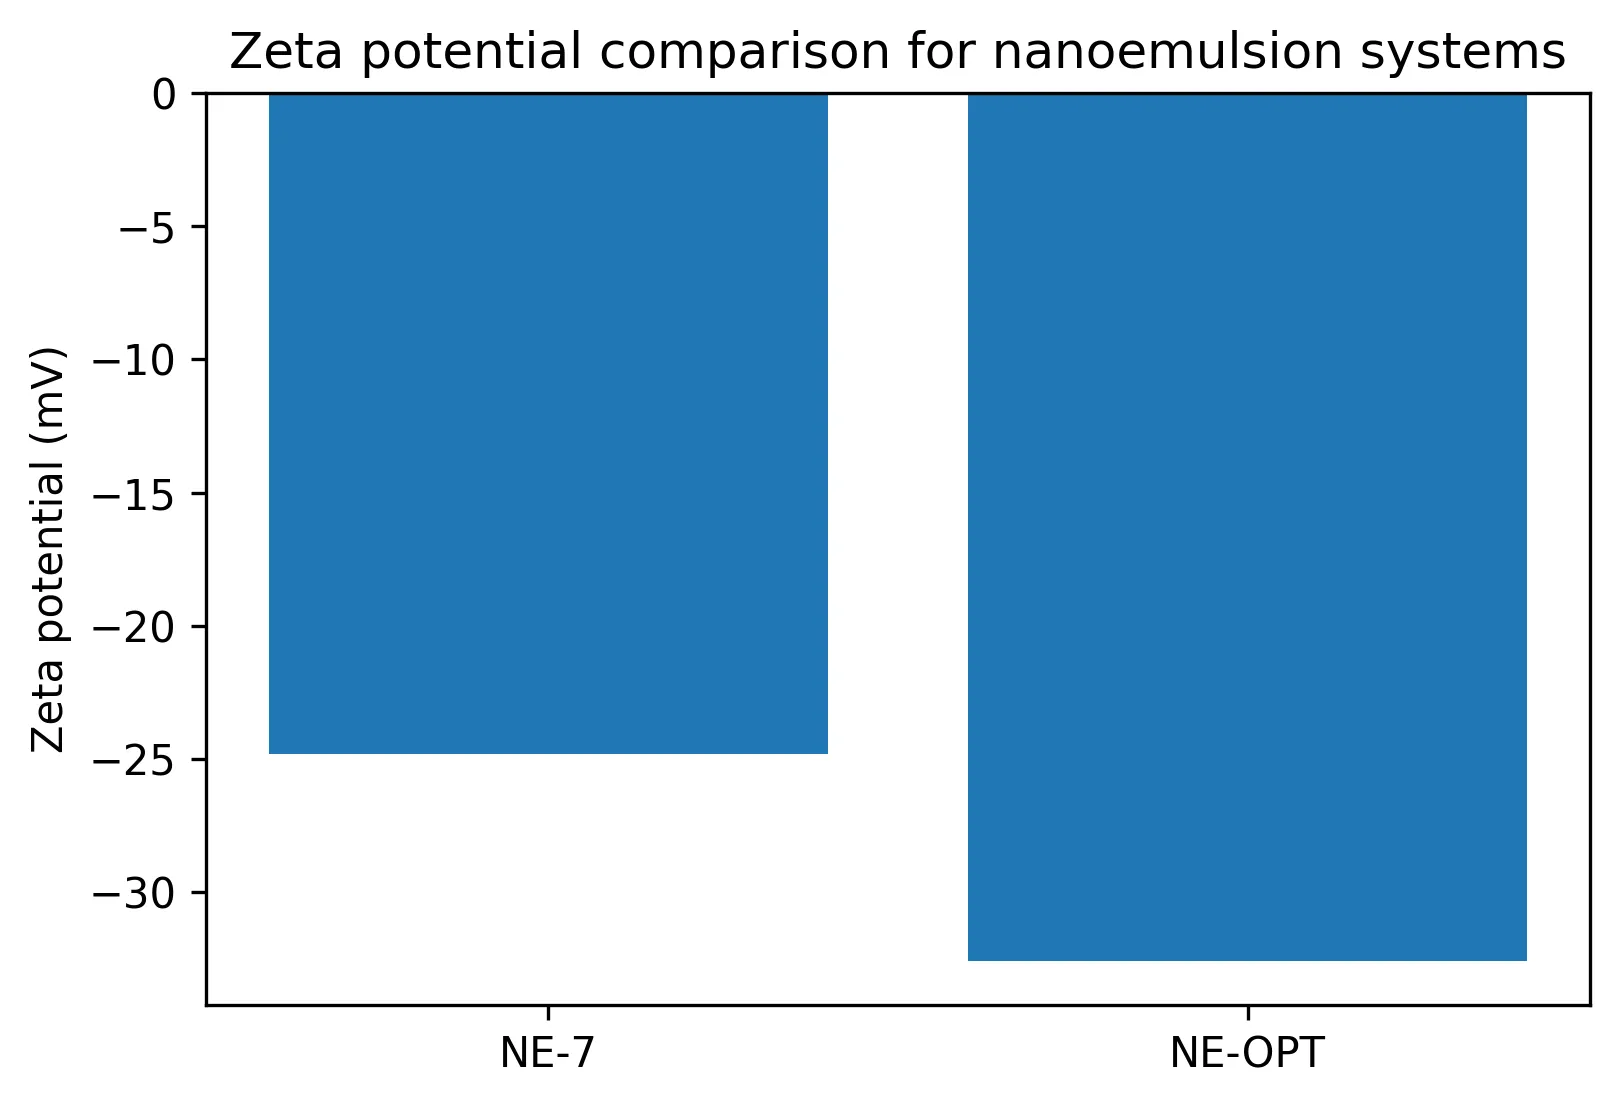
Fig. 2: Zeta potential comparison of preliminary and optimized nanoemulsions.
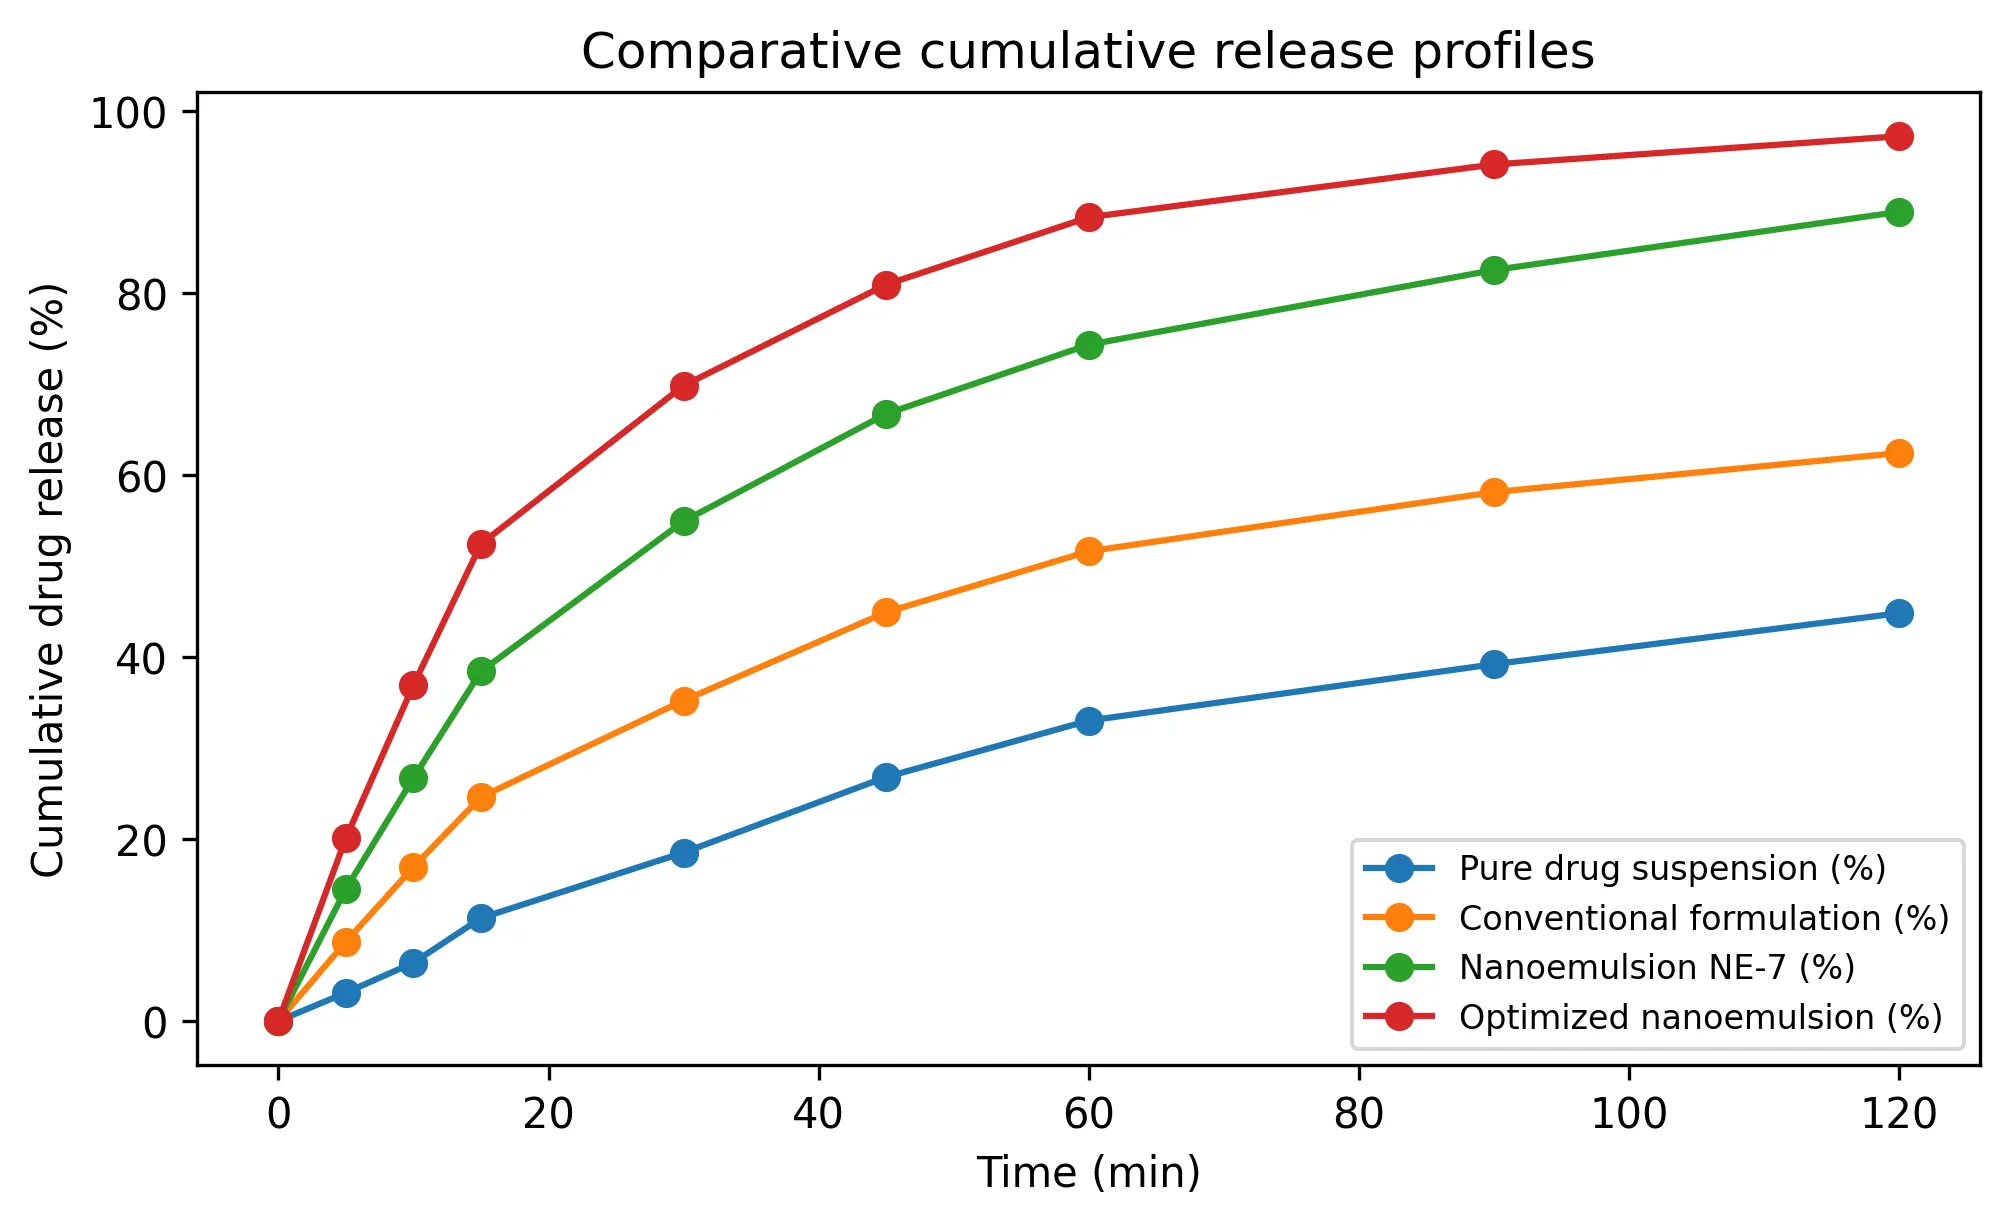
Fig. 3: Comparative cumulative release profiles for all formulation groups.
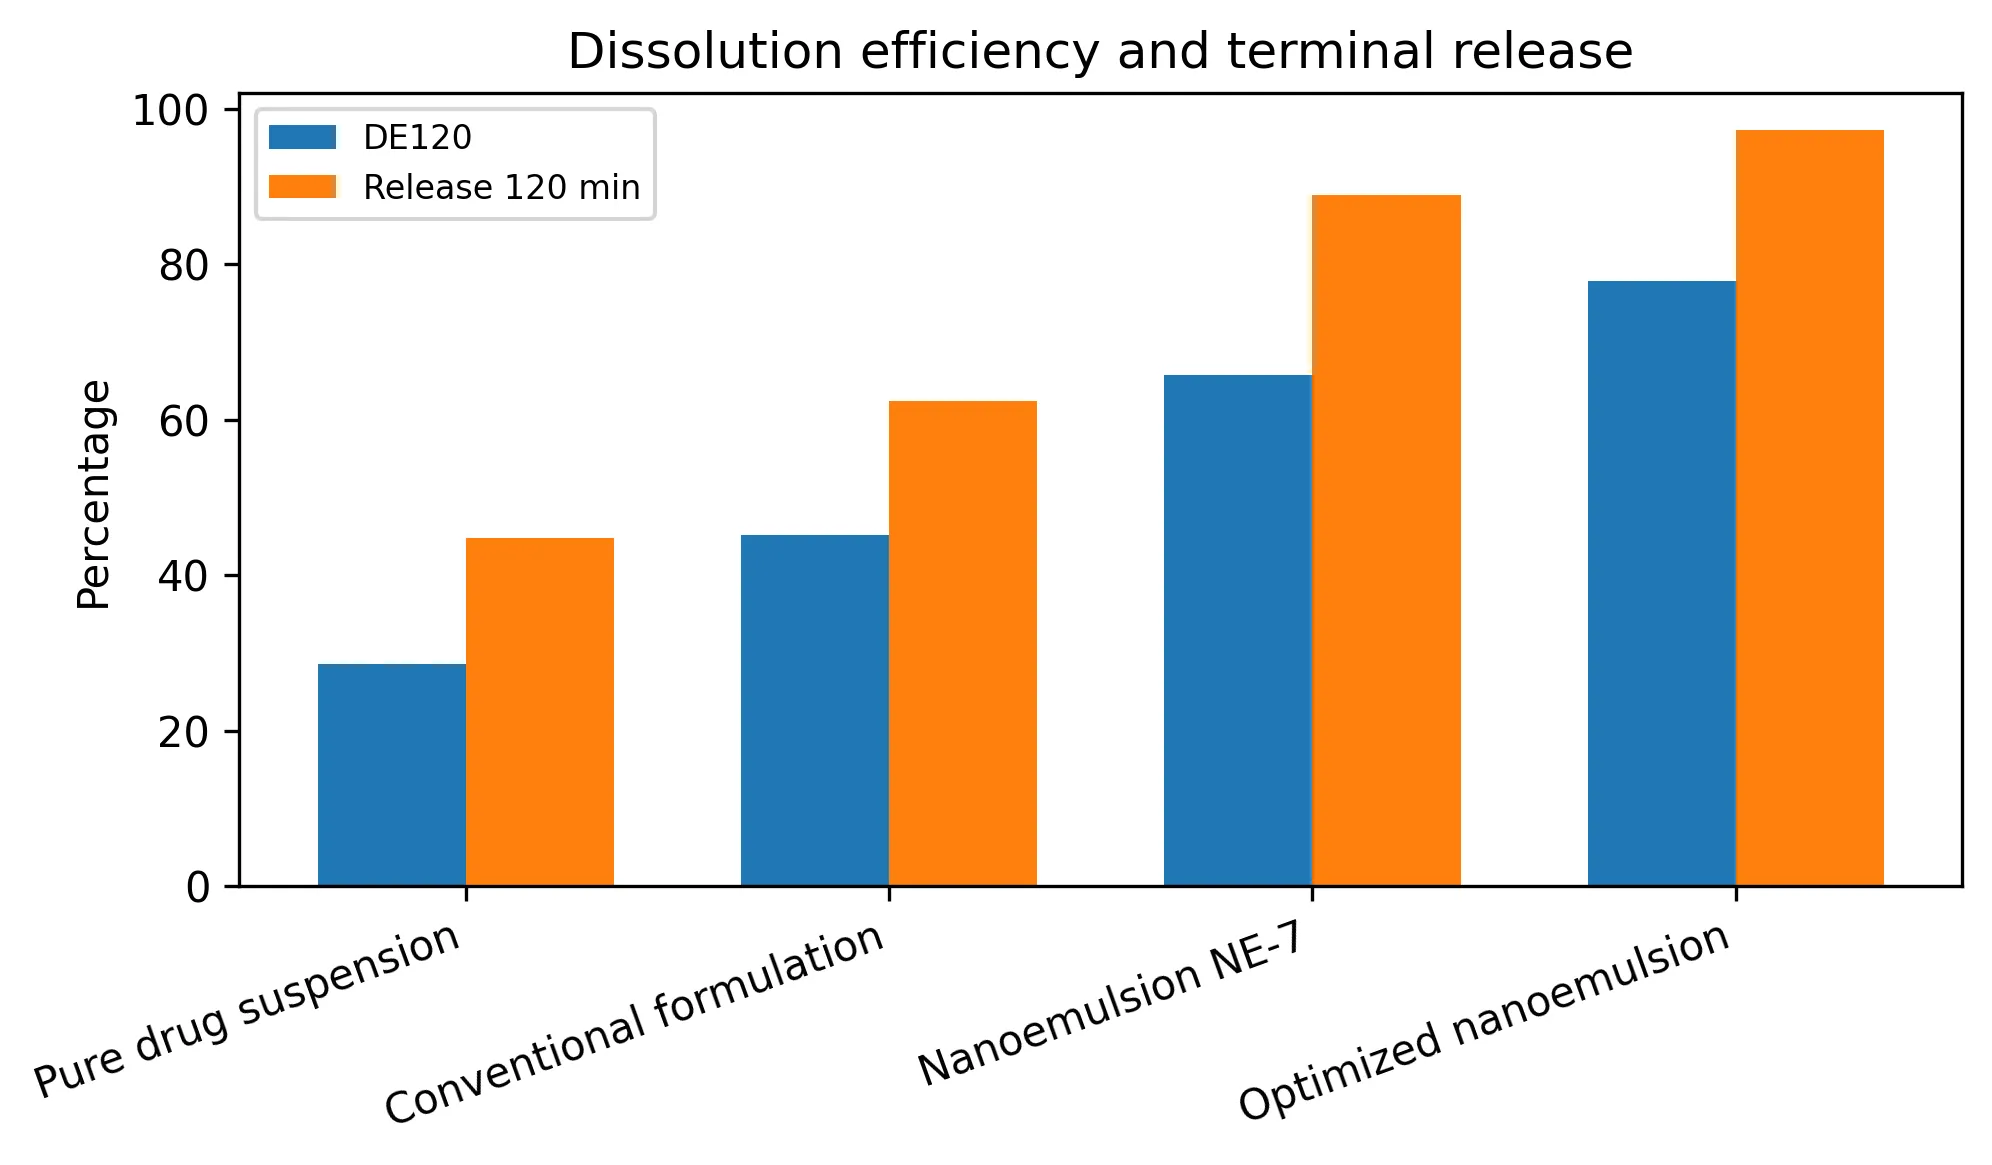
Fig. 4: Dissolution efficiency and terminal release comparison.
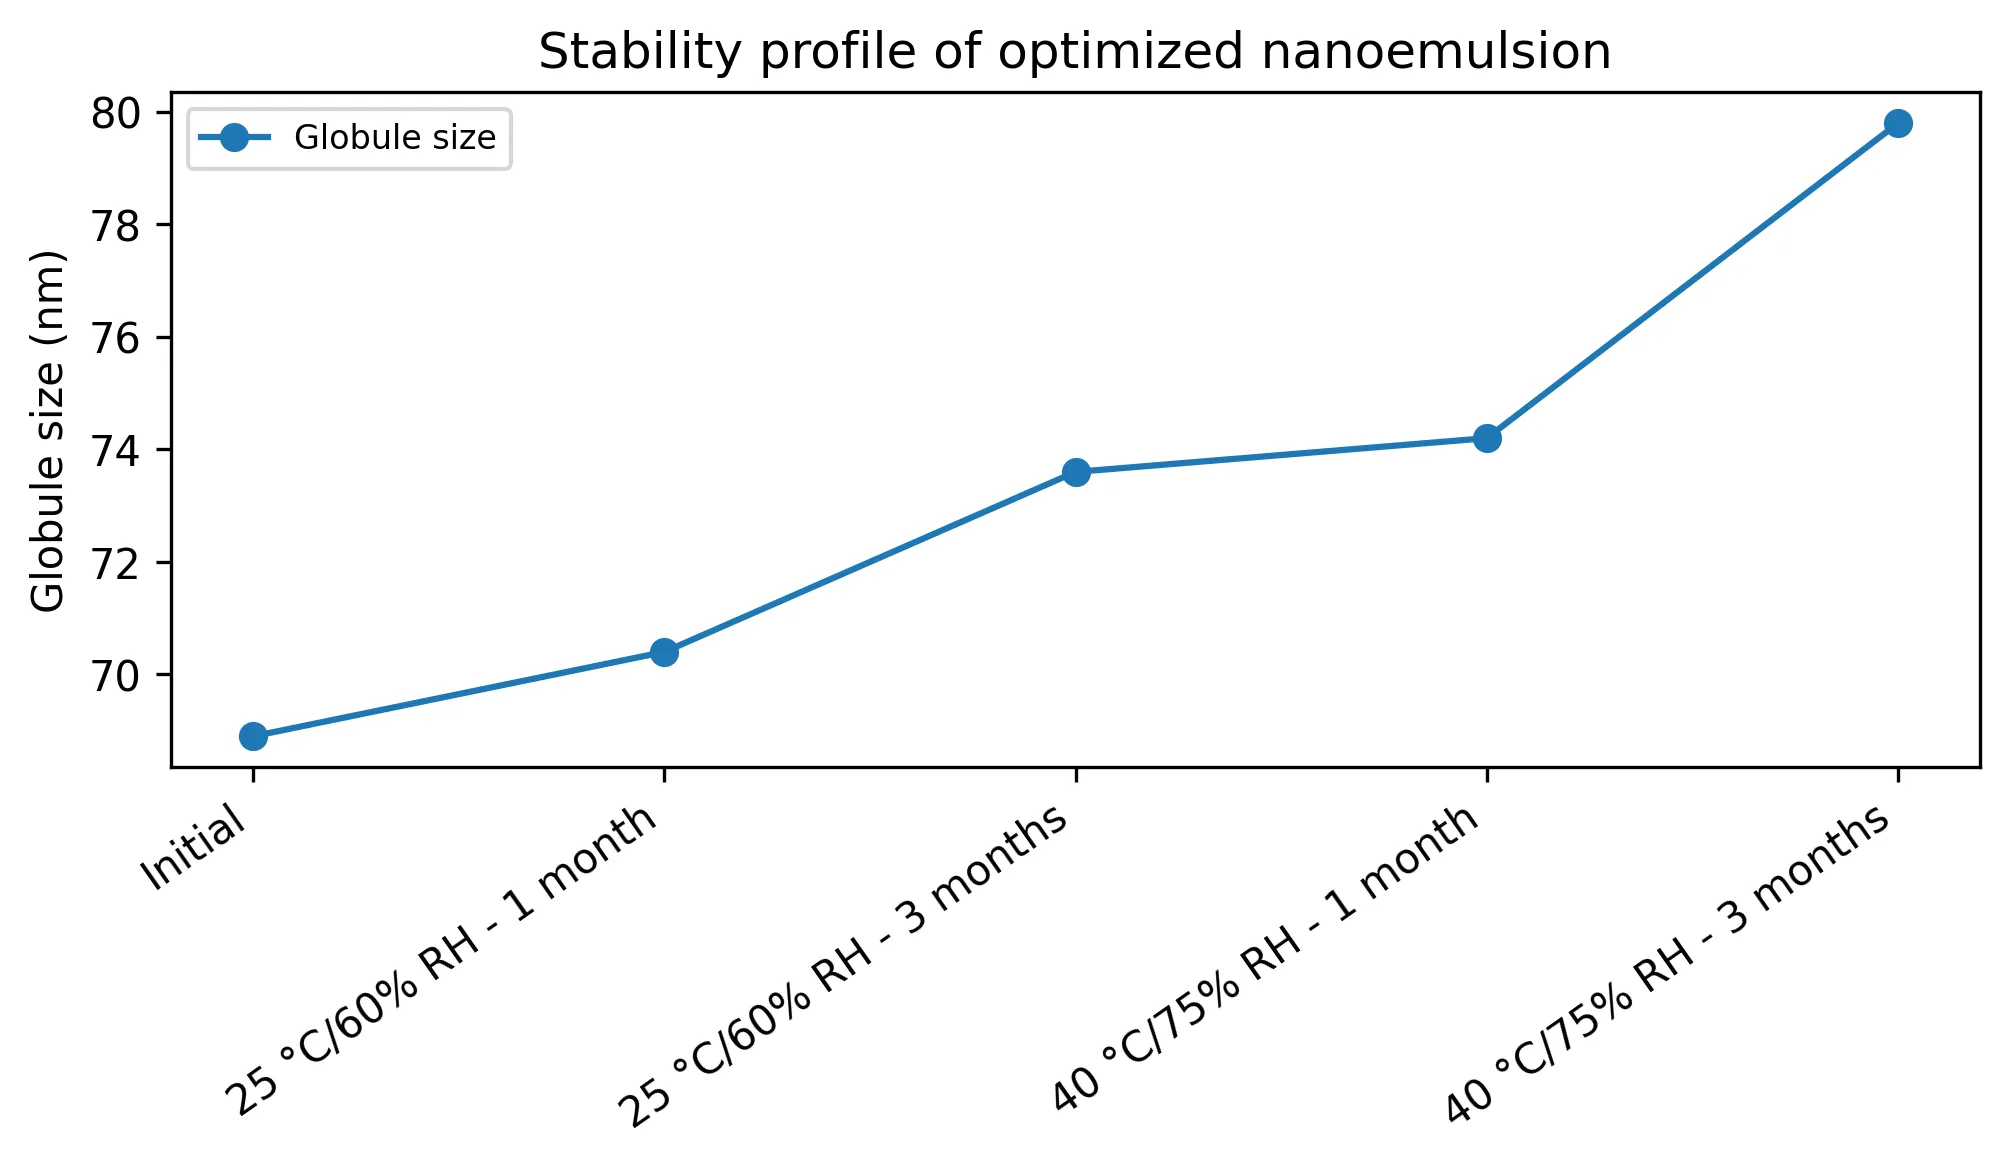
Fig. 5: Stability-related change in globule size of optimized nanoemulsion


Chetan Jain, Dr. Viabhavkumar Jagtap, Design and Evaluation of Nanoemulsion Formulations for Dissolution-Based Bioavailability Enhancement of BCS Class II Drugs in Diabetes Mellitus Therapy: A Comparative Pharmaceutical Analysis, Int. J. of Pharm. Sci., 2026, Vol 4, Issue 6, 7752-7762, https://doi.org/10.5281/zenodo.21067236
 10.5281/zenodo.21067236