

We use cookies to ensure our website works properly and to personalise your experience. Cookies policy
Department of pharmacognocy, Matoshri College of Pharmacy, Eklhare Nashik.
Desidustat is a novel oral hypoxia-inducible factor prolyl hydroxylase (HIF-PH) inhibitor used for the treatment of anemia associated with chronic kidney disease. It acts by stabilizing hypoxia-inducible factors, thereby stimulating endogenous erythropoietin production and improving iron metabolism. A new simple, precise, accurate, sensitive, and rapid RP-HPLC method was developed and validated for the estimation of Desidustat in pharmaceutical solid dosage form. Desidustat was chromatographed on an Inertsil ODS-3V, 150 mm × 4.6 mm ID, 5 µm column using a mobile phase consisting of Acetonitrile:Water (75:25, v/v) under isocratic conditions. The mobile phase was pumped at a flow rate of 1.0 mL/min and the analyte was detected at 232 nm using a UV detector. The retention time of Desidustat was satisfactory with good peak symmetry. The detector response was linear in the concentration range of 10–50 µg/mL with a correlation coefficient greater than 0.999. The developed method was validated according to ICH Q2(R1) guidelines for accuracy, precision, linearity, specificity, robustness, limit of detection, and limit of quantification. The intra-day and inter-day precision studies showed %RSD values less than 2.0%, indicating good precision of the method. The percentage recovery of the drug was within acceptable limits, confirming the accuracy of the proposed method. The developed RP-HPLC method was found to be simple, economical, reproducible, and suitable for routine quantitative analysis of Desidustat in tablet dosage forms in quality control laboratories
The development of sound analytical methods is of supreme importance during the process of drug discovery, product release, and development, culminating in marketing approval. The objective of analytical method development is to optimize and validate a method for the drug product from the developmental stage of the formulation. Validation demonstrates that processes involved in drug development, production, and analytical testing can be performed in an effective and reproducible manner (1,2).
High Performance Liquid Chromatography (HPLC) is one of the most widely used analytical techniques. Chromatography is a separation technique involving mass transfer between stationary and mobile phases. In HPLC, a liquid mobile phase is used to separate the components of a mixture as they pass through a packed column under high pressure. Separation depends on differences in interaction between analytes and the stationary phase. By choosing suitable mobile and stationary phases, HPLC can separate a wide variety of compounds with high versatility and reliability (3,4).
Desidustat is a novel oral hypoxia-inducible factor prolyl hydroxylase inhibitor used for the treatment of anemia associated with chronic kidney disease. It works by stabilizing hypoxia-inducible factors, stimulating endogenous erythropoietin production, and improving iron metabolism. Because only limited analytical methods were available for this drug, there was a need for a simple, rapid, and validated RP-HPLC method suitable for routine pharmaceutical analysis (5,6).
The present study was designed to develop and validate an RP-HPLC method for Desidustat in solid dosage form according to ICH guidelines (1).
MATERIALS AND METHODS
Materials
Desidustat reference standard and marketed tablet formulation were used in the study. The marketed product mentioned in the thesis is Rystat 100 tablet. HPLC-grade acetonitrile, water, and other reagents used in the study were of analytical or chromatographic grade.
Instrumentation
Chromatographic analysis was carried out using an HPLC system equipped with UV detection. The column used was Inertsil ODS-3V, 150 mm × 4.6 mm ID, 5 µm. The detection wavelength selected for analysis was 232 nm.
Chromatographic Conditions
The optimized chromatographic conditions were:
• Column: Inertsil ODS-3V, 150 mm × 4.6 mm, 5 µm.
• Mobile phase: Acetonitrile:Water (75:25, v/v).
• Mode: Isocratic.
• Flow rate: 1.0 mL/min.
• Detection wavelength: 232 nm.
• Retention time: approximately 2.63 min.
• Run time: approximately 9 min.
Placebo preparation:
|
Sr. No. |
Ingredients |
Role |
Qty (mg) |
|
1 |
Lactose |
Filler |
80 |
|
2 |
Starch |
Binder |
5 |
|
3 |
Magnesium stearate |
Lubricant |
5 |
|
4 |
Talc |
Glidant |
5 |
|
5 |
crospovidone |
Disintegrants |
5 |
|
|
Total |
|
100 mg |
Method Development
Different trial chromatographic conditions were evaluated to obtain a sharp, symmetrical peak with acceptable system suitability parameters. The final conditions were selected based on retention time, peak shape, resolution, and reproducibility. The method was then optimized for routine assay of Desidustat in tablet dosage form.
Method Validation
The method was validated according to ICH Q2(R1) guidelines for the following parameters:
• Specificity.
• Linearity.
• Range.
• Accuracy.
• Precision.
• Limit of detection.
• Limit of quantitation.
• Robustness.
• System suitability.
LINEARITY AND RANGE:
|
Sr. No. |
Level (%) |
mL of stock solution |
Diluted to with Mobile phase (mL) |
Desidustat Concentration (µg/mL) |
|
1 |
50% |
1.0 |
10 |
5.00 |
|
2 |
75% |
1.5 |
10 |
7.50 |
|
3 |
100% |
2.0 |
10 |
10.00 |
|
4 |
125% |
2.5 |
10 |
12.50 |
|
5 |
150% |
3.0 |
10 |
15.00 |
Accuracy levels details:
Refer Following table for each sample:
|
Level (%) |
API (mg) |
Placebo |
Diluted to (mL) |
Volume taken(mL) |
Diluted to (mL) |
Conc (µg/mL) |
|
50 |
50.10 |
202.6 |
100 |
0.2 |
20 |
5.01 |
|
50.20 |
202.4 |
100 |
0.2 |
20 |
5.02 |
|
|
49.90 |
202.3 |
100 |
0.2 |
20 |
4.99 |
|
|
100 |
100.00 |
202.1 |
100 |
0.2 |
20 |
10.00 |
|
100.20 |
203.1 |
100 |
0.2 |
20 |
10.02 |
|
|
|
100.50 |
204.2 |
100 |
0.2 |
20 |
10.05 |
|
150 |
150.10 |
202.5 |
100 |
0.2 |
20 |
15.01 |
|
149.80 |
201.8 |
100 |
0.2 |
20 |
14.98 |
|
|
150.00 |
203.2 |
100 |
0.2 |
20 |
15.00 |
Precision (Repeatability) Sample details are as follows:
|
Sample |
Powder wt (mg) |
Diluted to (mL) |
Volume taken (mL) |
Diluted to (mL) |
|
Sample 1 |
301.6 |
100 |
0.2 |
20 |
|
Sample 2 |
302.5 |
100 |
0.2 |
20 |
|
Sample 3 |
301.9 |
100 |
0.2 |
20 |
|
Sample 4 |
303.2 |
100 |
0.2 |
20 |
|
Sample 5 |
302.5 |
100 |
0.2 |
20 |
|
Sample 6 |
302.8 |
100 |
0.2 |
20 |
Intermediate Precision Sample details are as follows:
|
Sample |
Powder wt. (mg) |
Diluted to (mL) |
Volume taken (mL) |
Diluted to (mL) |
|
Sample 1 |
301.6 |
7026532 |
97.15 |
301.6 |
|
Sample 2 |
302.5 |
7115290 |
98.08 |
302.5 |
|
Sample 3 |
301.9 |
7095268 |
98.00 |
301.9 |
|
Sample 4 |
303.2 |
7142518 |
98.23 |
303.2 |
|
Sample 5 |
302.5 |
7095237 |
97.80 |
302.5 |
|
Sample 6 |
302.8 |
7056238 |
97.17 |
302.8 |
Sample Preparation
Tablet samples were prepared according to the procedure described in the thesis. The sample solution was filtered and analyzed under the optimized chromatographic conditions. Placebo and blank solutions were also prepared for specificity assessment.
RESULTS System Suitability
The system suitability parameters met the acceptance criteria. The method provided a satisfactory retention time, good peak symmetry, and acceptable chromatographic performance for routine analysis. The thesis acceptance limits for system suitability included theoretical plates greater than 2000, capacity factor less than 1, resolution greater than 1.5, tailing factor less than 2, and %RSD less than 2.
Specificity
Blank and placebo chromatograms showed no interference at the retention time of Desidustat, demonstrating the specificity of the method. The analyte peak was well resolved and free from co-eluting peaks.
Linearity
The detector response was linear in the concentration range of 10–50 µg/mL. The calibration curve showed a correlation coefficient greater than 0.999, indicating excellent linearity.
Accuracy
Accuracy was evaluated at 50%, 100%, and 150% levels. The percentage recovery values were within acceptable limits, confirming that the method is accurate for tablet analysis.
Precision
Repeatability, intra-day precision, and inter-day precision studies showed %RSD values below 2.0%, indicating that the method is precise and reproducible.
Robustness
The method remained unaffected by small deliberate variations in flow rate, mobile phase composition, and temperature, demonstrating robustness.
Assay
The assay of the marketed tablet formulation showed satisfactory recovery and confirmed the suitability of the proposed method for routine quality control analysis.
Solubility study Desidustat
|
Sr. No. |
Name of Solvent |
Observation |
Conclusion |
Summary |
|
1 |
Water |
Drug Particles seen after sonication |
Drug was not found soluble in water. |
DMSO used as a diluent for preparing stock |
|
|
|
|
|
|
|
2 |
Methanol |
Drug Particles seen after sonication |
Drug was not found soluble in methanol. |
solution. |
|
3 |
Ethanol |
Drug Particles seen after sonication |
Drug was not found soluble in Ethanol. |
|
|
4 |
Acetonitrile |
Drug Particles seen after sonication |
Drug was not found soluble in Acetonitrile |
|
|
5 |
0.1 N HCl |
Drug Particles seen after sonication |
Drug was not found soluble in 0.1 N HCl. |
|
|
6 |
0.1 N NaOH |
Drug Particles seen after sonication |
Drug was not found soluble in 0.1 N NaOH |
|
|
7 |
DMSO |
No Drug Particles seen after sonication |
Drug was found soluble in DMSO. |
Fig. UV spectrum of Solution 1 as blank
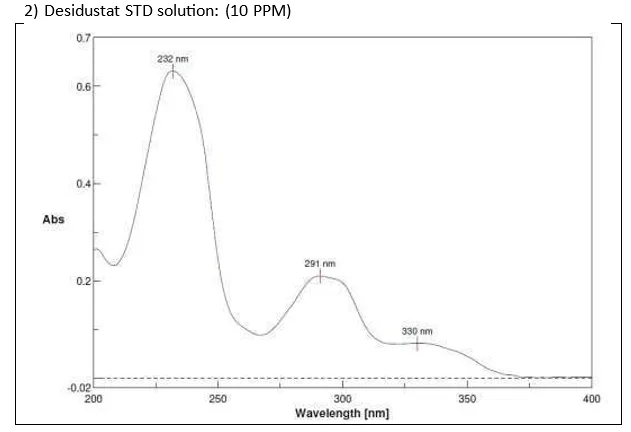
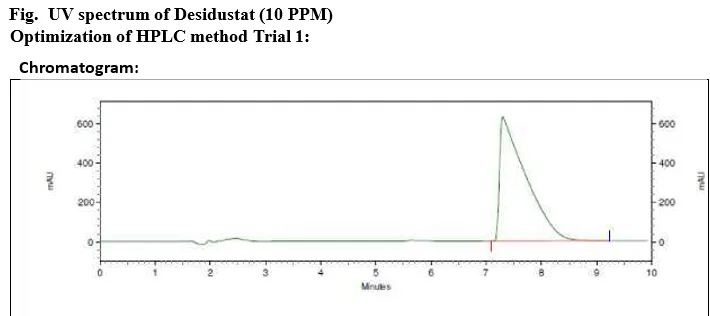
Fig. Typical chromatogram of Trial 1
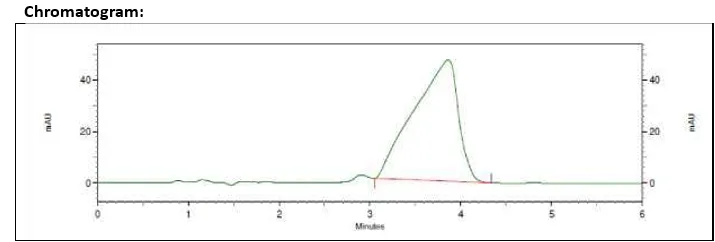
Fig. Typical chromatogram of Trial 2 Trial
3:
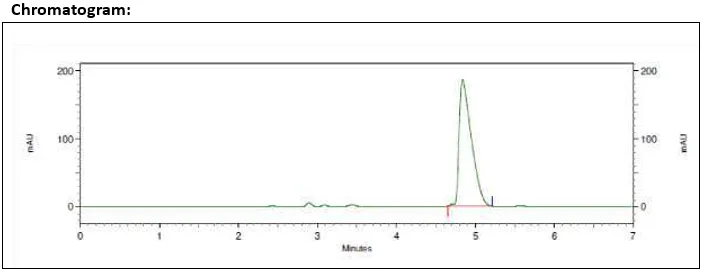
Fig. Typical chromatogram of Trial 3 Trial
4:
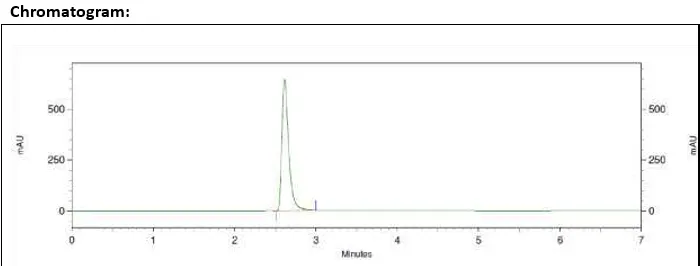
Fig. Typical chromatogram of Trial 4 Conclusion: From the observations of trials first to four, it was concluded that chromatographic conditions in trial four gives better peak, good retention time and tailing factor therefore chromatographic conditions in trial four was used for method validation Table. Optimized Chromatographic Conditions
|
Parameter |
Description |
|
Mode |
Isocratic |
|
Column Name |
Inertsil ODS-3V, 150 mm X 4.6mm ID, 5μm |
|
Detector |
UV Detector |
|
Injection Volume |
20 µl |
|
Wavelength |
232 nm |
|
Column Oven temp |
40ºC |
|
Mobile Phase |
Acetonitrile :Water (75:25 %V/V) |
|
Flow Rate |
1.0 ml/min |
|
Diluent |
Stock solution: DMSO followed by methanol Final dilution: Mobile phase |
|
Run time |
6 Minutes |
8.4. System suitability test
|
Sr No. |
Standard solution |
Area |
Asymmetry |
Theoretical plates |
|
1 |
Standard_1 |
7256521 |
1.32 |
6240 |
|
2 |
Standard_2 |
7249562 |
1.32 |
6249 |
|
3 |
Standard_3 |
7244851 |
1.32 |
6251 |
|
4 |
Standard_4 |
7259532 |
1.31 |
6243 |
|
5 |
Standard_5 |
7250268 |
1.32 |
6261 |
|
|
Mean |
7252147 |
1.32 |
6249 |
|
STD Dev |
5854.797 |
|
||
|
% RSD |
0.08 |
|||
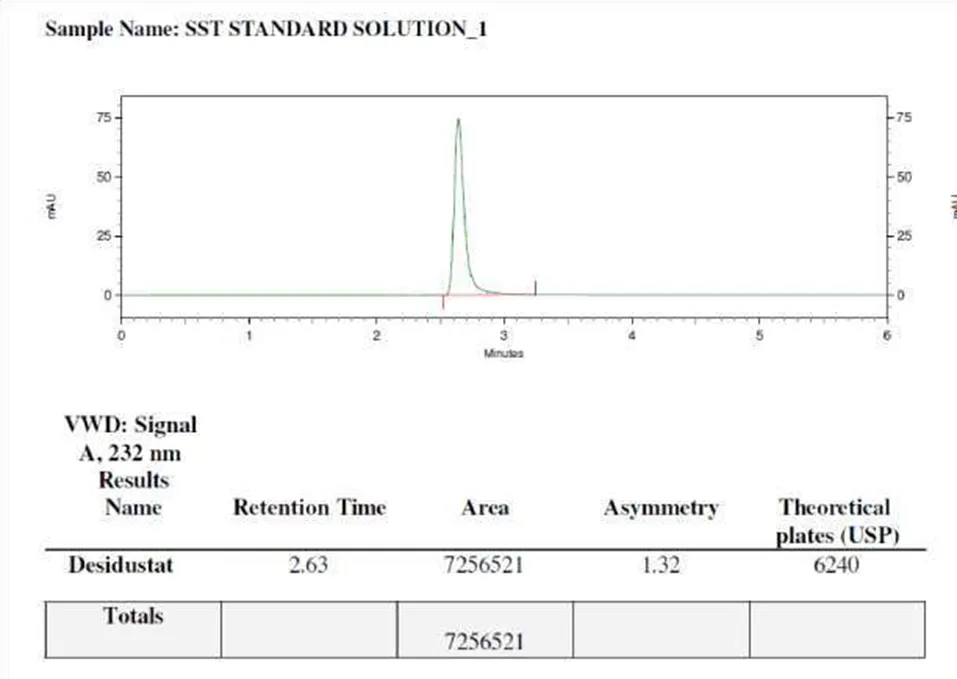
Fig. Typical chromatogram Standard solution 1 of system suitability solution
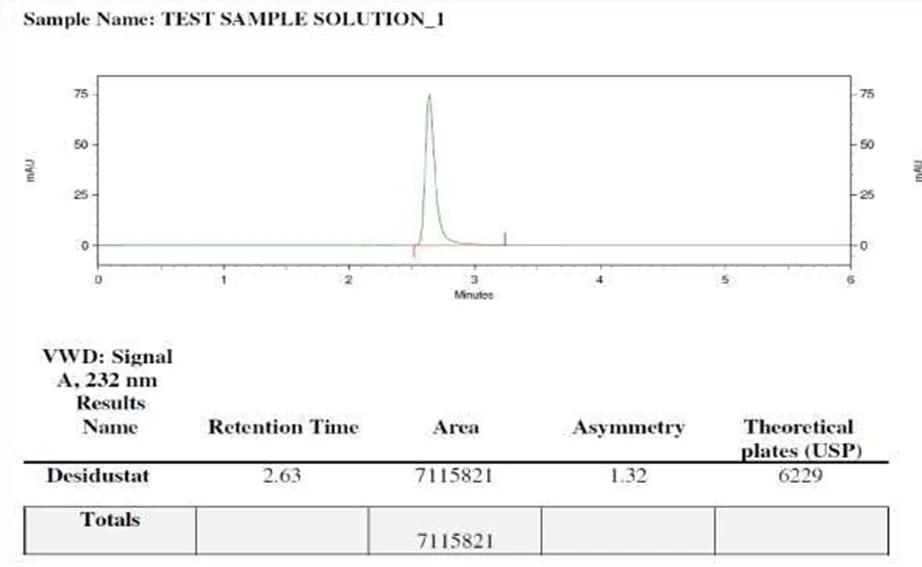
Analysis of Marketed Test samples (Assay)
a) Rytstat100mg Tablet: Weight of 20 tablets = 6.0480gm
Average weight of tablet = 6.0480 /20 =0.3024gm = 302.4mg
Table. Assay results of Rytstat 100Tablet
|
Sample |
Area |
% Assay |
Assay |
|
Sample 1 |
7115821 |
98.06 |
98.42 |
|
Sample 2 |
7156532 |
98.78 |
Fig. Typical chromatogram Tablet sample_1
1) % Assay found should be in the range of 90-110%.
Data interpretation:
From the above results, it can be concluded that the assay result is within the limit for selected marketed test sample and sample can be used for validation.
8.6. VALIDATION OF RP-HPLC METHOD 1) FILTRATION STUDY:
Filtration study of an analytical procedure checks the interference of extraneous components from filter, deposition on filter bed and compatibility of filter with sample. Performed on tablet test sample.
Table. Results of Filter study
|
Sample description |
Area |
% Absolute difference |
|
Unfiltered |
7169532 |
NA |
|
0.45 µ PVDF filter |
7123568 |
0.64 |
|
0.45 µ Nylon filter |
7145829 |
0.33 |
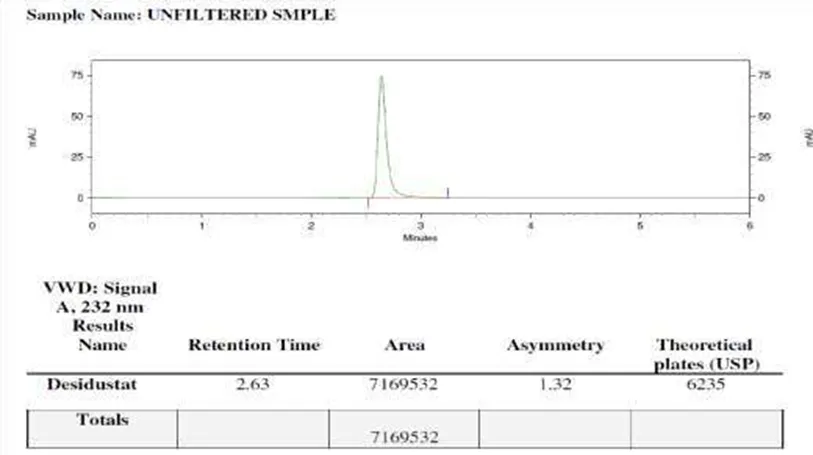
Fig.No. Typical chromatogram of unfiltered sample
Fig. Typical chromatogram of sample filtered through 0.45µ PVDF filter
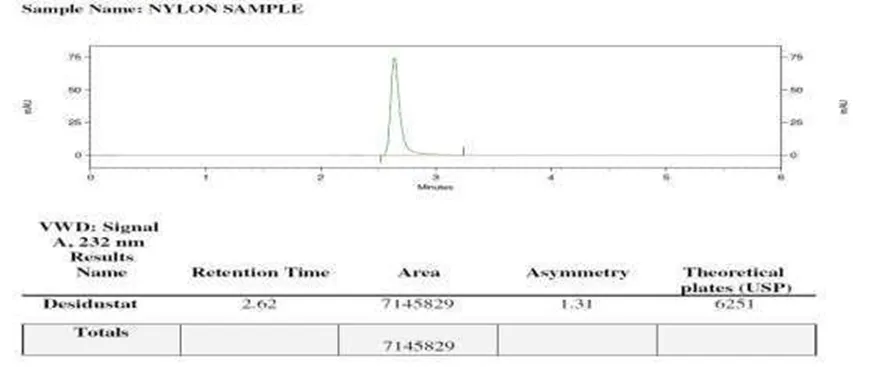
Fig. Typical chromatogram of sample filtered through 0.45µ Nylon filter Acceptance criteria:% Absolute difference of filtered samples NMT 2.0 w.r.t. Unfiltered sample.
Table. Results of Solution stability
|
|
le solution |
|
|
ard solution |
|
|
point |
|
solute differen |
cpoint |
|
solute differenc |
|
|
60 |
|
|
24 |
|
|
urs |
29 |
|
urs |
09 |
|
|
urs |
51 |
|
urs |
53 |
|
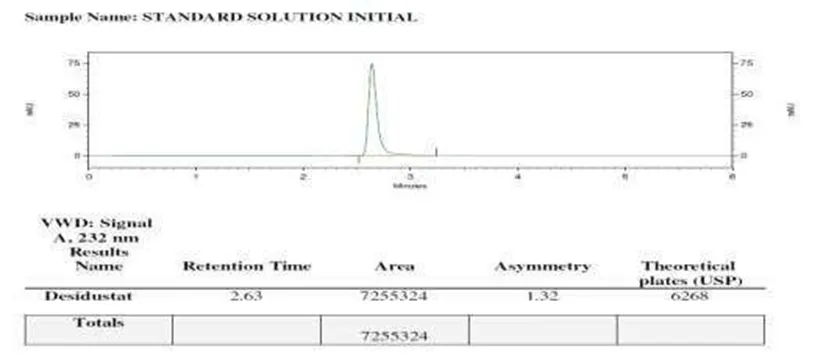
Fig. Typical chromatogram of Standard solution Initial
Fig. Typical chromatogram of Test solution After 24 Hrs
Table. Results of Specificity
|
Description |
Observation |
|
Bank |
o interference at R.T. of Desidustat due to blank |
|
pacebo |
o interference at R.T. of Desidustat due to placebo |
Chromatograms:
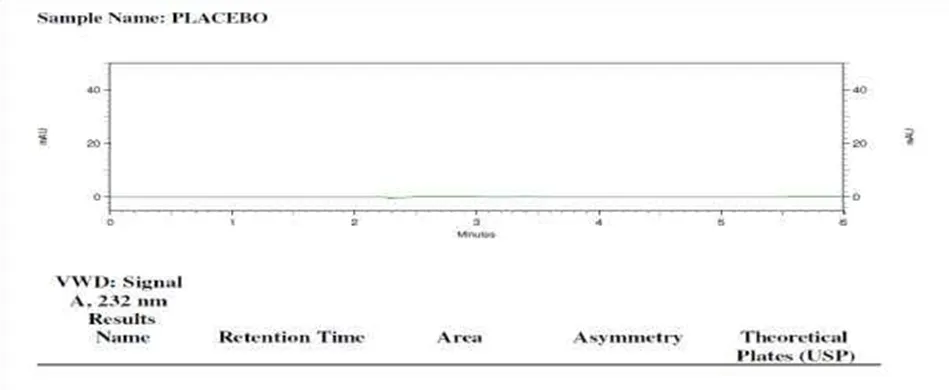
Fig. Typical chromatogram of Placebo solution Acceptance criteria:
Blank: There should be no Interference at R.T. of Desidustat
Placebo: There should be no Interference at R.T. of Desidustat
Data interpretation: Blank and placebo were not having interference at R.T. of Desidustat. Hence developed chromatographic method passed the criteria for specificity.
Table. Linearity Data for Desidustat
|
Level |
Conc (µg/mL) |
Area |
Mean |
% RSD |
|
50% |
5.00 |
3636532 |
3639304 |
0.068 |
|
3640129 |
||||
|
3641251 |
||||
|
75% |
7.50 |
5469539 |
5473308 |
0.108 |
|
5480126 |
||||
|
5470259 |
||||
|
100% |
10.00 |
7265239 |
7255977 |
0.190 |
|
7240152 |
||||
|
7262539 |
||||
|
125% |
12.50 |
9023561 |
9038742 |
0.151 |
|
9050129 |
||||
|
9042535 |
||||
|
150% |
15.00 |
10823561 |
10830526 |
0.094 |
|
10842153 |
||||
|
10825865 |
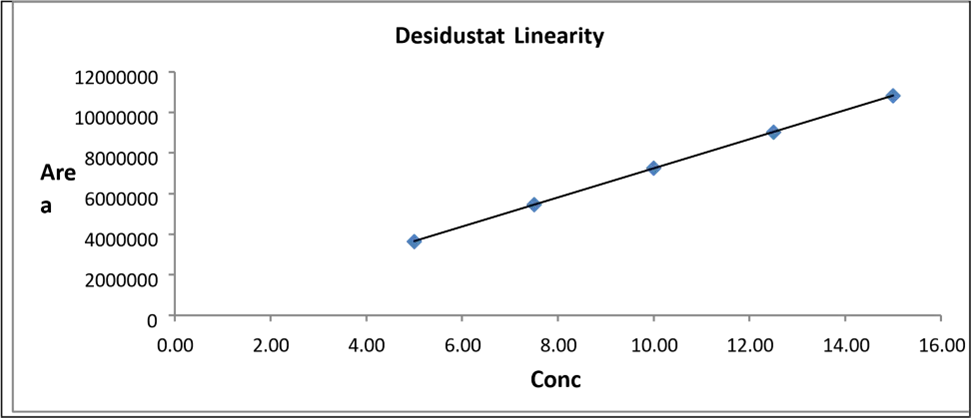
Fig. Calibration curve of Desidustat
Table. Data of linearity of Desidustat:
|
Sr no. |
Parameter |
Result value |
Acceptance criteria |
|
1 |
Beer's linearity range |
5.00-15.00 µg/mL |
NA |
|
2 |
Correlation coefficient (R2) |
0.99999 |
NLT 0.98 |
|
3 |
Intercept |
68420.20 |
To be report |
|
4 |
Slope |
717915.12 |
To be report |
|
5 |
% RSD for area at each level |
NA |
NMT 2.0 |
Fig. Typical chromatogram of Linearity 50%
Fig. No. 47 Typical chromatogram of Linearity 100%
Fig. Typical chromatogram of Linearity 150% Conclusion:
From the calibration curve it was concluded that the Desidustat shows linear response in the range of 5.0015.00μg/ml. The Regression value was found well within the limit.
Limit of Detection (LOD) and Limit of Quantitation (LOQ):
σ = 14985.08 (Residual standard deviation of a regression line)
S = 717915.12(Slope)
Detection limit (LOD):
LOD = 3.3 σ / S
LOD = 3.3 x 14985.08/ 717915.12
LOD = 0.07µg/mL
Quantitation limit (LOQ):
LOQ = 10 σ / S
LOQ = 10 x 14985.08/ 717915.12
LOQ = 0.21µg/mL
ACCURACY (RECOVERY):
Table. Result and statistical data of Accuracy of Desidustat
|
Level (%) |
Area |
Recovered conc (µg/mL) |
Added conc (µg/mL) |
% Recovery |
Mean Recovery |
% RSD |
|
50 |
3645109 |
5.03 |
5.01 |
100.40 |
100.13 |
0.461 |
|
3652109 |
5.04 |
5.02 |
100.40 |
|||
|
3605231 |
4.97 |
4.99 |
99.60 |
|||
|
100 |
7256204 |
10.01 |
10.00 |
100.10 |
100.33 |
0.492 |
|
7269568 |
10.02 |
10.02 |
100.00 |
|||
|
7350256 |
10.14 |
10.05 |
100.90 |
|||
|
150 |
10850268 |
14.96 |
15.01 |
99.67 |
100.42 |
0.728 |
|
10913562 |
15.05 |
14.98 |
100.47 |
|||
|
11000135 |
15.17 |
15.00 |
101.13 |
Overall Recovery: 100.30 %
% RSD for Overall Recovery: 0.513
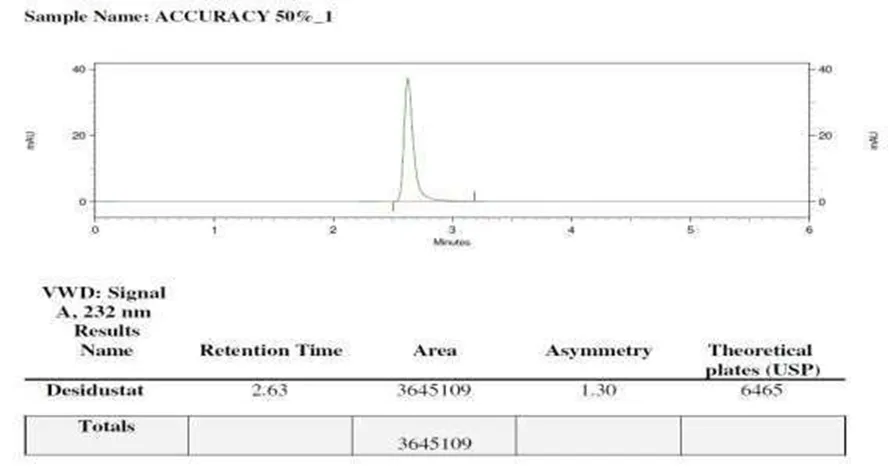
Fig. Typical chromatogram of sample 1 of Accuracy 50%
Fig. Typical chromatogram of sample 1 of Accuracy 100%
Fig. Typical chromatogram of sample 1 of Accuracy 150% Acceptance criteria:
% Recovery for each level and overall recovery: 98.0 to 102.0%
% RSD for each level and overall recovery: NMT 2.0
Data interpretation: Recovery of analytical procedure was found well within acceptance criteria at all 3 levels. % Recovery not get hampered by changed in analyte concentration.
PRECISION
Precision of an analytical method is the degree of agreement among individual test results when the procedure is applied repeatedly to multiple samplings of a homogenous sample. Precision of an analytical method is usually expressed as standard deviation or relative standard deviation. Precision was performed on Test sample.
Table No.Result of Intra- day and Inter- Day Precision for Desidustat test sample
|
Repeatability |
Sample |
Test Sample (mg) |
Area |
% Assay |
|
Sample 1 |
301.6 |
7026532 |
97.15 |
|
|
Sample 2 |
302.5 |
7115290 |
98.08 |
|
|
Sample 3 |
301.9 |
7095268 |
98.00 |
|
|
|
Sample 4 |
303.2 |
7142518 |
98.23 |
|
|
Sample 5 |
302.5 |
7095237 |
97.80 |
|
Sample 6 |
302.8 |
7056238 |
97.17 |
|
|
|
Mean |
|
97.74 |
|
|
|
STD DEV |
|
0.4690 |
|
|
|
% RSD |
|
0.480 |
|
|
Intermediate precision (Inter-Day) |
Sample 1 |
302.6 |
7100521 |
97.84 |
|
Sample 2 |
302.5 |
7156223 |
98.64 |
|
|
Sample 3 |
302.9 |
7058621 |
97.17 |
|
|
Sample 4 |
302.1 |
7110532 |
98.14 |
|
|
Sample 5 |
301.9 |
7125368 |
98.41 |
|
|
Sample 6 |
302.4 |
7112539 |
98.07 |
|
|
|
Mean |
|
98.05 |
|
|
|
STD DEV |
|
0.5108 |
|
|
|
% RSD |
|
0.521 |
|
|
Repeatability Plus Inter-day |
|
Mean |
|
97.892 |
|
|
STD DEV |
|
0.4942 |
|
|
|
% RSD |
|
0.505 |
Chromatograms:
Fig. Typical chromatogram of Repeatability precision (Sample 1)
Fig. Typical chromatogram of Inter-day precision (Sample 1)
Acceptance criteria:
% Assay: % Assay value for each sample (Individual sample) and mean assay value for precision (6 samples), mean assay value intermediate precision (6 samples), and mean assay value for precision plus intermediate precision sample (12 samples): 90-110%
% RSD: % RSD for precision study samples (6 samples), Intermediate precision study samples (6 samples) and precision plus intermediate precision sample (12 samples): NMT 2.0 Data interpretation:
% Assay and % RSD was found well within acceptance limit and hence method is precise (Reproducible).
ROBUSTNESS:
The robustness of an analytical method is a measure of its capacity to remain unaffected by small but deliberate variations in method parameters and provides an indication of its reliability during normal usage.
Table. Result of Robustness study:
|
Change in Parameter |
R.T. |
Standard area |
Asymmetry |
Theoretical plates |
|
Wavelength by +3 NM (234 NM) |
2.63 |
7080253 |
1.33 |
6312 |
|
Wavelength by -3 NM (230NM) |
2.63 |
6893238 |
1.32 |
6085 |
|
Flow rate by +10% (1.1mL/min) |
2.40 |
6520125 |
1.37 |
5953 |
|
Flow rate by -10% (0.9mL/min) |
2.92 |
7953201 |
1.36 |
6742 |
|
Column oven temp by +2ºC (42 ºC) |
2.63 |
7210539 |
1.31 |
5928 |
|
Column oven temp by -2ºC (38 ºC) |
2.64 |
7256861 |
1.32 |
6082 |
Chromatograms:
Fig. Typical chromatogram of Standard +2 NM
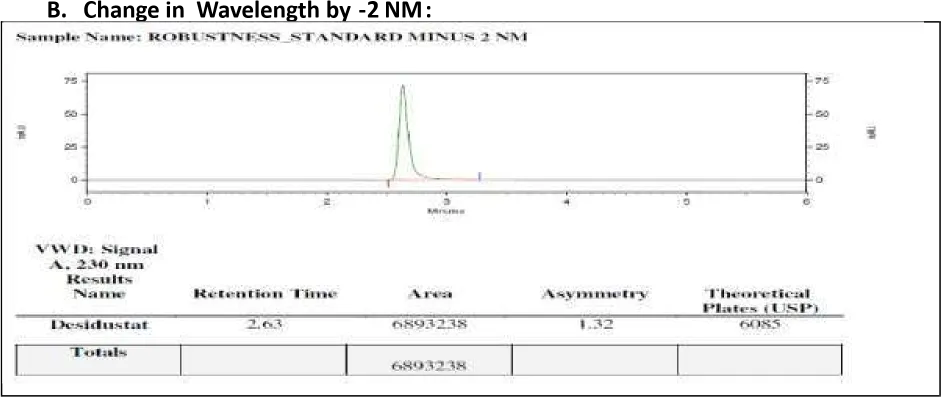
Fig. Typical chromatogram of Standard -2 NM C.
Change in Flow rate by + 10% (1.1 mL/min)
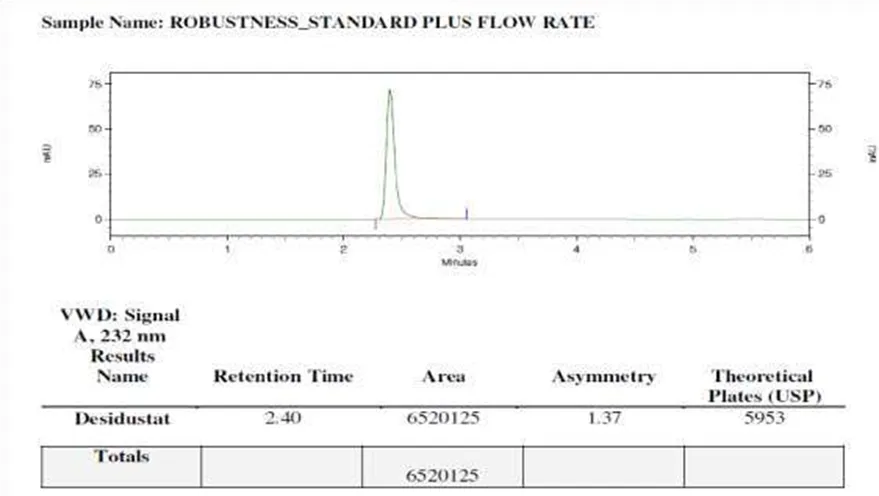
Fig. Typical chromatogram of Standard +10% F.R.
D. Change in Flow rate by - 10% (0.9 mL/min)
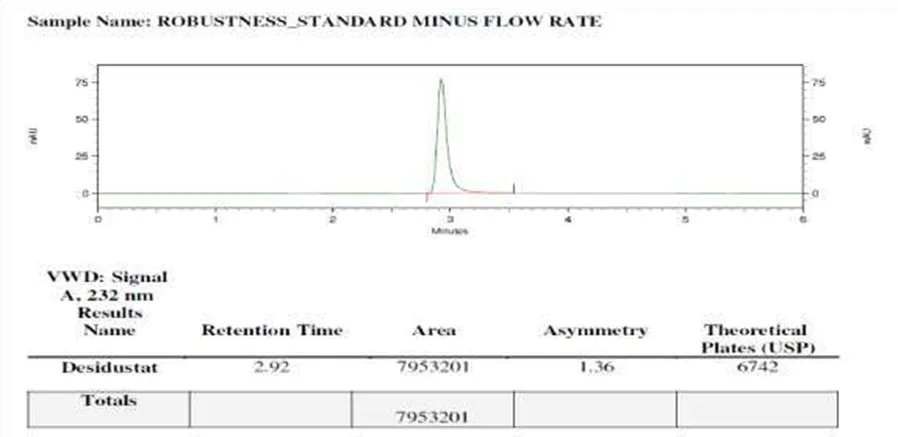
Fig. Typical chromatogram of Standard -10% F.R.
E. Change in Column Oven temperature by +2°C:
Fig. Typical chromatogram of Standard +2°C C.O.T.
F. Change in Column Oven temperature by -2°C:
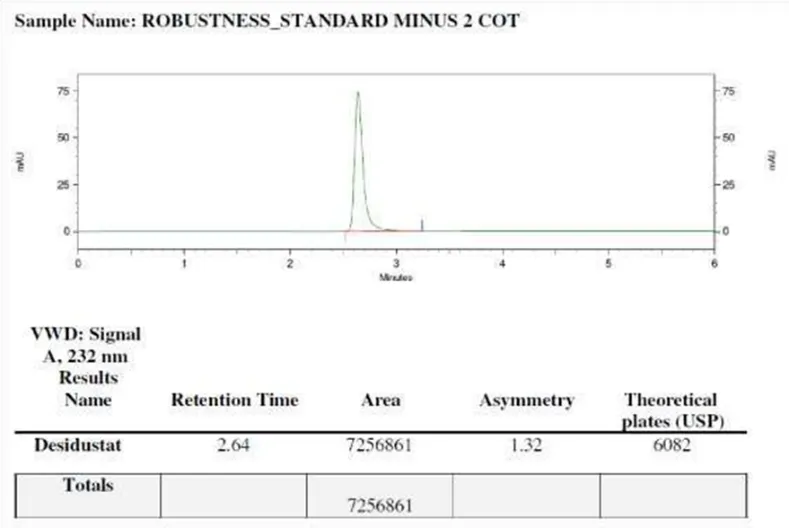
Fig. Typical chromatogram of Standard -2ºC C.O.T.
Acceptance criteria:
Chromatography (System suitability) acceptance criteria should not get failed.
Data interpretation: From the above results, it was concluded that the system suitability test results was found well within the limit
DISCUSSION
The present RP-HPLC method was developed successfully for the estimation of Desidustat in solid dosage form. The selected column and mobile phase combination produced a sharp peak with a short retention time, which is advantageous for routine analysis. The use of Acetonitrile:Water (75:25, v/v) under isocratic conditions simplified the procedure and reduced analysis time.
The method showed excellent linearity over the selected concentration range, confirming that detector response was directly proportional to analyte concentration. The low %RSD values obtained in precision studies demonstrate that the method is reliable and reproducible. Accuracy values within acceptable recovery limits further support the suitability of the method for quantitative analysis.
Specificity testing confirmed that excipients and blank samples did not interfere with the analyte peak, which is important for tablet formulation analysis. Robustness studies showed that minor variations in analytical parameters did not significantly affect the results, indicating that the method is rugged enough for routine laboratory use. Overall, the method is simple, economical, and suitable for routine quality control analysis of Desidustat tablets in pharmaceutical laboratories.
CONCLUSION
A rapid, accurate, precise, and validated RP-HPLC method was successfully developed for the estimation of Desidustat in solid dosage form. The method complies with ICH Q2(R1) requirements and demonstrated excellent linearity, precision, accuracy, specificity, and robustness. Because of its simplicity and reproducibility, the method is suitable for routine analysis of Desidustat in pharmaceutical quality control laboratories.
REFERENCES
Dighe RD, Deore GS, Sonawane GB, Bairagi VA. Development and validation of stability indicating RPHPLC method for estimation of Desidustat in bulk drug and formulation. African Journal of Biological Sciences. 2024;6(11):326–344

Amol Pawase, Varsha Chaudhari, Method Development and Validation of Desidustat in Solid Dosage Form by RP-HPLC Method, Int. J. of Pharm. Sci., 2026, Vol 4, Issue 8, 1612-1634, https://doi.org/10.5281/zenodo.21870367
 10.5281/zenodo.21870367