

We use cookies to ensure our website works properly and to personalise your experience. Cookies policy
GRY Institute of Pharmacy, Borawan, Khargone, Madhya Pradesh, India 451228
Aims: The present study was aimed at the formulation, optimization, and evaluation of terbinafine-loaded ethosomal gel for enhanced topical antifungal delivery and improved skin permeation. Study design: Experimental research study using 3² full factorial design optimization. Place and Duration of Study: Department of Pharmaceutics, between 2025 and 2026. Methodology: Terbinafine-loaded ethosomes were prepared by the cold method using phospholipid, ethanol, propylene glycol, and distilled water. A 3² full factorial design was employed to optimize the formulation variables, where ethanol concentration (X?) and phospholipid concentration (X?) were selected as independent variables. Particle size, entrapment efficiency, and in vitro drug release were considered as dependent responses. The optimized ethosomal suspension was incorporated into Carbopol 934 gel and further evaluated for physicochemical characteristics, drug release, permeation, antifungal activity, and stability studies. Results: The optimized ethosomal formulation showed particle size of 248 ± 1.02 nm, entrapment efficiency of 80.40 ± 0.84%, and zeta potential of ?18.6 mV, indicating stable nanosized vesicles. The cumulative drug release was found to be 84.32 ± 0.72% at 8 h. SEM analysis confirmed spherical vesicles with uniform distribution, while DSC and XRD studies revealed successful drug entrapment and reduced crystallinity of terbinafine. The optimized ethosomal gel exhibited satisfactory pH (6.8 ± 0.2), viscosity (3.12 ± 0.14 Pa·s), and good spreadability suitable for topical application. In vitro permeation studies demonstrated improved permeation with flux value of 0.0031 mg/cm²/h and permeability coefficient of 0.0015 cm/h. The formulation showed enhanced antifungal activity against Candida albicans and Aspergillus niger. Stability studies indicated good formulation stability under refrigerated conditions for 3 months. Conclusion: The developed terbinafine-loaded ethosomal gel demonstrated enhanced drug entrapment, controlled release, improved permeation, and significant antifungal activity, indicating its potential as an effective topical delivery system for fungal infections.
Topical drug delivery remains a preferred approach for the management of superficial fungal infections due to its localized action and reduced systemic side effects. However, the effectiveness of conventional topical dosage forms such as creams, ointments, and gels is often limited by poor penetration across the stratum corneum, which serves as the primary barrier to drug transport. This limitation frequently results in sub-therapeutic drug levels at the target site, leading to prolonged treatment duration and decreased therapeutic outcomes (Jafari et al., 2023; Khurana et al., 2022).
In recent years, nanotechnology-based vesicular systems have emerged as promising strategies to overcome these limitations. Among these, lipid-based carriers such as liposomes, transfersomes, and ethosomes have been extensively investigated for enhancing dermal and transdermal drug delivery (Mosallam et al., 2022). Ethosomes, in particular, have attracted considerable attention due to their unique composition and superior permeation capabilities. These vesicles are composed of phospholipids, high concentrations of ethanol, and water, which together confer enhanced flexibility and deformability to the vesicular structure (Jafari et al., 2023).
The presence of ethanol plays a crucial role in the enhanced performance of ethosomes. It acts as a permeation enhancer by interacting with the lipid components of the stratum corneum, leading to increased fluidity and reduced barrier resistance. This disruption of the skin lipid organization facilitates deeper penetration of the vesicles. Additionally, the flexible nature of ethosomes allows them to traverse through narrow intercellular pathways and deliver encapsulated drugs efficiently into deeper skin layers (Rada & Yadav, 2022; Nagasa&Belete, 2022). This synergistic mechanism significantly improves drug bioavailability and therapeutic efficacy compared to conventional formulations.
Ethosomal systems have demonstrated improved performance in terms of drug permeation, retention, and controlled release. Various studies have reported enhanced delivery of antifungal agents using ethosomal carriers, highlighting their potential in the treatment of dermal infections (Mosallam et al., 2022; Nagasa&Belete, 2022). Their ability to provide sustained drug release and improved skin deposition makes them particularly suitable for topical antifungal therapy.Terbinafine is a potent antifungal agent belonging to the allylamine class, widely used in the treatment of dermatophytic infections. It acts by inhibiting squalene epoxidase, a key enzyme involved in ergosterol biosynthesis, thereby disrupting fungal cell membrane integrity. Despite its effectiveness, conventional topical formulations of terbinafine often exhibit inadequate penetration into deeper skin layers, which can limit its therapeutic efficiency.
The performance of ethosomal formulations is highly influenced by formulation variables such as ethanol concentration and phospholipid content, which directly affect vesicle size, drug entrapment, and permeation behavior (Touitou et al., 2000; Jain et al., 2007). Therefore, systematic design optimization is essential to develop an efficient and stable formulation (Saraswathi et al., 2024). In addition, stability studies are critical to ensure that the optimized formulation maintains its physicochemical properties, drug content, and performance over time under different storage conditions (Elsayed et al., 2007).
In light of these considerations, the present study is aimed at the development, optimization, and stability evaluation of an ethosomal gel for enhanced dermal permeation and antifungal activity. The study involves the preparation of ethosomal vesicles, optimization of formulation parameters, incorporation into a gel base, and comprehensive evaluation of physicochemical properties, in-vitro drug release, ex-vivo permeation, antifungal efficacy, and stability. This approach is expected to provide an effective and improved topical delivery system for antifungal therapy (Aljohani et al., 2023; Rukari et al., 2023).
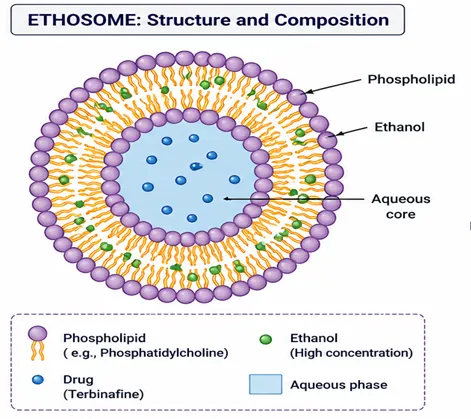
Figure no.01 : Structure of Ethosome
2. MATERIAL AND METHODS
2.1 Materials
Terbinafine Hydrochloride Was Obtained as A Gift Sample from Salvavidas Pharmaceutical Pvt. Ltd., Gujrat. Phospholipid (Soya Lecithin) Was Procured FromSonic Biochem Extractions Pvt. Ltd. Ethanol, Cholesterol, Carbopol 934, Propylene Glycol, Triethanolamine, And Other Analytical Grade Chemicals Were Purchased From LobaChemie (Mumbai).
2.2 Preparation of Ethosomes
2.2.1 Cold Method
Terbinafine-loaded ethosomal formulations were prepared using the cold method followed by ultrasonication for vesicle size reduction, with slight modifications to previously reported methods (Lu et al., 2021; Jafari et al., 2022). Various formulations with different compositions were developed to optimize the ethosomal system. Briefly, a calculated amount of phospholipid, cholesterol, and terbinafine hydrochloride was dissolved in 10 mL of ethanol in a covered vessel under continuous magnetic stirring at 100–150 rpm at room temperature until a clear solution was obtained. Propylene glycol (5 mL) was then added to the ethanolic phase with continuous stirring (Nangare et al., 2021). Subsequently, distilled water was added dropwise to the above mixture over a period of 30–40 minutes under constant stirring to obtain a milky white ethosomal dispersion. The resulting dispersion was subjected to ultrasonication for 20 minutes to reduce vesicle size and obtain a uniform nanosized formulation (Nainwal et al., 2019). The prepared ethosomal formulations were stored in airtight containers at room temperature for further characterization and evaluation.
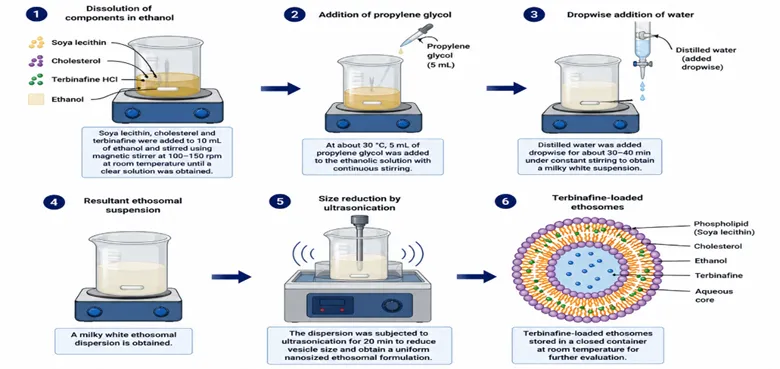
Figure no.02 : Preparation Of Ethosome
2.3 Optimization and Design of Experiments
Terbinafine-loaded ethosomal formulations were developed using a 3² full factorial design to systematically evaluate the influence of formulation variables on vesicle characteristics (Priya et al., 2020; El-Hashemy, 2022). The design was applied to obtain an optimized formulation with minimum vesicle size, maximum entrapment efficiency, and enhanced drug release. In this design, two independent variables—ethanol concentration (X₁) and phospholipid concentration (X₂)—were studied at three levels (low, medium, and high). The dependent variables selected were vesicle size (Y₁), entrapment efficiency (Y₂), and in-vitro drug release at 8 h (Y₃) (Anju et al., 2021). A total of nine experimental runs (F1–F9) were generated, and the responses were evaluated to determine the effect of formulation variables. Statistical analysis and optimization were performed using Design-Expert® software to identify the optimized ethosomal formulation with desirable physicochemical characteristics (El-Hashemy, 2022).
Table 1: Factors and Levels in 3² Full Factorial Design
|
Factors |
Coded Levels |
Actual Values |
||
|
−1 |
0 |
+1 |
||
|
Ethanol (X₁) (% v/v) |
20 |
25 |
30 |
Low–Medium–High |
|
Phospholipid (X₂) (% w/v) |
1.0 |
1.5 |
2.0 |
Low–Medium–High |
Based on the 3² factorial design, nine formulations (F1–F9) were prepared by varying ethanol (X₁) and phospholipid (X₂) concentrations as shown in Table 2.
Table 2: Composition of Ethosomal Formulations
|
Formulation Code |
Drug (mg) |
Phospholipid (% w/v) |
Ethanol (% v/v) |
Propylene Glycol (% v/v) |
|
F1 |
10 |
1.0 |
20 |
5 |
|
F2 |
10 |
1.5 |
20 |
5 |
|
F3 |
10 |
2.0 |
20 |
5 |
|
F4 |
10 |
1.0 |
25 |
5 |
|
F5 |
10 |
1.5 |
25 |
5 |
|
F6 |
10 |
2.0 |
25 |
5 |
|
F7 |
10 |
1.0 |
30 |
5 |
|
F8 |
10 |
1.5 |
30 |
5 |
|
F9 |
10 |
2.0 |
30 |
5 |
2.4 Characterization of a drug-loaded ethosomal formulation
2.4.1 Entrapment Efficiency (EE%)
The entrapment efficiency of the drug-loaded ethosomal formulations was determined by the ultracentrifugation method. Briefly, 1 mL of ethosomal suspension was transferred into Eppendorf tubes containing phosphate buffer solution (PBS, pH 7.4) and centrifuged at 15,000 rpm for 2 h at 4 °C using a fixed-angle rotor. The supernatant was carefully separated, suitably diluted with PBS (pH 7.4), and analyzed using a UV–Visible spectrophotometer at λmax 223 nm to determine the amount of unentrapped drug.The percentage entrapment efficiency was calculated using the following equation:
Entrapment Efficiency (%) = (Total drug -Free drug)/Total drug × 1000. (Abdulbaqi et al., 2016)
2.4.2 Particle Size and Polydispersity Index (PDI)
The average vesicle size and polydispersity index (PDI) of the ethosomal formulations were determined using a dynamic light scattering-based particle size analyzer (Malvern Instruments, UK). Samples were appropriately diluted with distilled water prior to analysis to avoid multiple scattering effects. Measurements were carried out at 25 °C, and the mean particle size distribution was recorded.(Danaei et al., 2018)
2.4.3 Zeta Potential
Zeta potential of the ethosomal formulations was measured using a zeta potential analyzer (Malvern Instruments, UK) to determine the surface charge and stability of vesicles. The samples were diluted with distilled water and analyzed at 25 °C. The electrophoretic mobility values were converted into zeta potential using Smoluchowski’s equation.(Honary&Zahir, 2013).
2.4.4 Scanning Electron Microscopy (SEM)
The surface morphology of ethosomal vesicles was examined using scanning electron microscopy (SEM) (Thermo Scientific Apreo S). A small quantity of sample was placed on a metal stub, dried under vacuum, and coated with a thin layer of gold prior to imaging. The images were captured at suitable magnifications to observe vesicle shape and surface characteristics.(Moghassemi&Hadjizadeh, 2014).
2.4.5 Transmission Electron Microscopy (TEM)
Transmission electron microscopy (TEM) (JEOL JEM-2100 Plus, Japan) was used to study the morphology and size of the ethosomal vesicles. A drop of diluted formulation was placed on a carbon-coated copper grid, negatively stained with 1% aqueous solution, and allowed to dry. The sample was then observed under the microscope at appropriate magnifications. (Rajitha & Daniel, 2025)
2.4.6 Differential Scanning Calorimetry (DSC)
Differential scanning calorimetry (DSC) analysis was performed using a DSC instrument (PerkinElmer, USA) to evaluate the thermal behavior and compatibility of the drug with excipients. Approximately 10 mg of the sample was placed in an aluminum pan and heated from room temperature to 400 °C at a heating rate of 5 °C/min under a nitrogen atmosphere (flow rate: 50 mL/min). (Moghassemi & Hadjizadeh, 2014; Ascenso et al., 2015)
2.4.7 X-ray Diffraction (XRD) Study
X-ray diffraction analysis was carried out using an X-ray diffractometer (Bruker D8 Advance) to determine the crystalline or amorphous nature of the drug within the formulation. The samples were scanned over a 2θ range of 10°–90° using Cu-Kα radiation. The diffraction patterns were recorded and analyzed. (Ubrich et al., 2004)
2.4.8In-vitro Drug Release Study
The in-vitro drug release study was performed using the dialysis bag diffusion method. A dialysis membrane (molecular weight cut-off: 3500 Da) was soaked in distilled water prior to use. Ethosomal formulation equivalent to 10 mg of drug was placed in the dialysis bag and immersed in 250 mL of phosphate buffer (pH 7.4). The system was maintained at 37 ± 0.5 °C with continuous stirring at 100 rpm using a magnetic stirrer.At predetermined time intervals (1, 2, 3, and 8 h), 5 mL samples were withdrawn and replaced with an equal volume of fresh medium. The samples were analyzed spectrophotometrically at 223 nm, and cumulative drug release was calculated. (Verma et al., 2010)
2.5 Preparation of Ethosomal Gel
The optimized drug-loaded ethosomal formulation was incorporated into a suitable gel base to enhance its topical application. The gel was prepared using Carbopol 934 as a gelling agent. Accurately weighed quantity of Carbopol 934 (1% w/w) was dispersed in an adequate amount of distilled water and allowed to hydrate for 2 h with continuous stirring using a magnetic stirrer to obtain a uniform dispersion. Propylene glycol was added to the hydrated polymer and mixed thoroughly to improve consistency and solubilization. The pH of the dispersion was adjusted to neutral (pH 6.5–7.0) by the dropwise addition of triethanolamine, resulting in the formation of a clear and homogeneous gel base. The optimized ethosomal suspension, containing the equivalent amount of drug (1% w/w), was slowly incorporated into the gel base under continuous stirring to ensure uniform distribution of vesicles throughout the formulation. The final ethosomal gel was allowed to equilibrate and stored in a well-closed container at room temperature for further evaluation. (Helal et al., 2012)
2.6 Evaluation of Ethosomal Gel
2.6.1 Determination of pH
The pH of the prepared ethosomal gel was determined using a calibrated digital pH meter. About 1 g of gel was dispersed in 10 mL of distilled water and allowed to equilibrate for 2 h. The electrode was then immersed in the dispersion, and the pH was recorded. All measurements were performed in triplicate, and the average value was calculated. (Al-Ameri & Al-Gawhari, 2024)
2.6.2 Viscosity Measurement
The viscosity of the ethosomal gel was measured using a Brookfield viscometer (Model DV-II+, Brookfield Engineering Laboratories, USA) equipped with an appropriate spindle. The gel sample was placed in the sample holder, and measurements were carried out at 25 ± 1 °C at a constant rotational speed. The viscosity values were recorded in centipoise (cP). (Geetha et al., 2023)
2.6.3 Spreadability
Spreadability of the gel formulation was evaluated using the parallel plate method. A fixed amount of gel was placed between two glass slides, and a known weight was applied on the upper slide for a specified time. (Garg et al., 2002) The diameter of the spread gel was measured, and spreadability was calculated using the following equation:
S = (M × L) / T
Where,
S = Spreadability (g•cm/sec)
M = Weight tied to the upper slide (g)
L = Length moved (cm)
T = Time taken (sec)
2.6.4 Drug Content
The drug content of the ethosomal gel was determined by accurately weighing 1 g of gel and dissolving it in a suitable volume of phosphate buffer (pH 7.4). The solution was sonicated to ensure complete extraction of the drug and then filtered. The filtrate was appropriately diluted and analyzed using a UV–Visible spectrophotometer at 223 nm. The drug content was calculated using a standard calibration curve. (Gharat et al., 2025)
2.6.5 In vitro permeation studies
Franz diffusion cell was used to conduct in vitro skin permeation studies. In this case, the dialysis membrane (in order to mimic the kin) was kept in between the donor compartment and the receptor compartment. Further 1g of the gel (equivalent to 2 mg of medication) was added to the dialysis membrane. Phosphate buffer 7.4 was used as a medium and magnetic stirrer was used in order to ensure the temperature maintenance and uniform distribution of the drug. Around 1 ml of the samples were collected from the receptor compartment at 0.5h, 1h, 2h, 3h, 4h, 5h, 6h, 7h and 8h, which was then replaced with equal volumes of medium [23, 24]. Total amount of the drug permeated through the dialysis membrane was calculated in mg/cm2. The permeability coefficient was calculated by dividing the steady-state drug flux (mg/h/cm2) by the slope of the linear part of the curve. (Ng et al., 2010)
2.6.6 In-vitro Antifungal Activity
The potato dextrose agar medium was prepared by dissolving 20 gm of potato infusion, 2 gm of dextrose and 1.5 gm of agar in 100 ml of distilled water. The dissolved medium was autoclaved at 15 lbs pressure at 121 °C for 15 min. The autoclaved medium was mixed well and poured onto 100 mm petri plates (25-30 ml/plate) while still molten [25]. Petri plates containing 20 ml potato dextrose agar medium was seeded with 72 hr culture of fungal strain (Candida albicans and Aspergillus niger). Agar medium was drilled with holes and different concentration of gel (50, 100, 250 and 500 μg/ml) was added. The plates were then incubated at 28 °C for 72 h. The anti-fungal activity was assayed by measuring the diameter of the inhibition zone formed around the wells. Amphotericin B was used as a positive control. The values were calculated using Graph Pad Prism 6.0 software (USA). (Sivashankaran et al., 2026)
2.6.7Stability Studies
Stability studies of the ethosomal formulations were done to determine their stability in physical and chemical conditions in various modes of storage. The samples were maintained at refrigerated temperature (4 ± 2 °C) and room temperature (25 ± 2 °C) during a duration of up to 3 months. Samples were collected at the specific time points (0, 1, 2, and 3 months) and assessed regarding the size of the vesicles, PDI index, zeta potential and entrapment efficiency. Measurements were done under triplicate and any notable difference in physicochemical properties was recorded to determine the stability of the formulations. (Shabreen & Sangeetha, 2020)
3. RESULTS AND DISCUSSION
3.1 Material Selection for Ethosomal Formulation
The selection of formulation components plays a critical role in determining the physicochemical characteristics and performance of ethosomal systems. In the present study, phospholipid (soya lecithin) and ethanol were selected as key components for the preparation of ethosomal vesicles.
Phospholipids are the fundamental structural units of ethosomal vesicles, contributing to membrane integrity, flexibility, and drug entrapment. Increasing phospholipid concentration enhances bilayer formation, leading to improved entrapment efficiency but may also increase vesicle size due to aggregation.
Ethanol, a key component of ethosomes, imparts unique properties such as increased membrane fluidity and deformability. It interacts with the lipid bilayers of the stratum corneum, reducing barrier resistance and enhancing drug permeation. However, higher ethanol concentrations may destabilize vesicles and reduce entrapment efficiency.
Thus, an optimum balance between phospholipid and ethanol concentration is essential to achieve stable vesicles with desirable size, high entrapment efficiency, and enhanced drug release.
3.2 Analysis of Factorial Design
A 3² full factorial design was employed to optimize the formulation variables. Ethanol (X₁) and phospholipid (X₂) were selected as independent variables, while particle size (Y₁), entrapment efficiency (Y₂), and % drug release (Y₃) were considered as dependent responses.
The experimental data obtained from nine formulations (F1–F9) were analyzed using Design-Expert® software, and polynomial equations were generate
3.2.1 Design of Experiments
The responses were fitted into the following polynomial model:
Y = β₀ + β₁X₁ + β₂X₂ + β₃X₁X₂
Regression Equations ;
Y₁ = 1125.34 − 145.22X₁ + 210.45X₂ − 95.60X₁X₂
Interpretation:
Y₂ = 78.65 − 5.12X₁ + 12.84X₂
Interpretation:
Y₃ = 52.40 + 6.35X₁ − 4.28X₂ + 2.10X₁X₂
Interpretation:
3.3 Characterization of Ethosomal Formulation
A. Particle Size
The particle size of the prepared ethosomal formulations (F1–F9) was determined using a zeta sizer, and the results are presented in Table X. The particle size of all formulations was found to be in the range of 760 nm to 1248 nm, indicating the formation of nanosized vesicular systems.
It was observed that an increase in ethanol concentration (X₁) resulted in a decrease in vesicle size, which may be attributed to enhanced fluidization of the lipid bilayer and reduction in vesicle aggregation. Conversely, an increase in phospholipid concentration (X₂) led to an increase in particle size due to the formation of thicker bilayer vesicles.
The ANOVA results indicated that the model was statistically significant (P < .05), confirming the influence of formulation variables on particle size. The interaction term (X₁X₂) also showed a notable effect, indicating that both variables jointly influence vesicle size.
B. Entrapment Efficiency
Entrapment efficiency (%EE) of the formulations was determined by the ultracentrifugation method, and the results are shown in Table X. The %EE of the formulations ranged from 68.9% to 90.1%.
An increase in phospholipid concentration significantly improved the entrapment efficiency due to enhanced formation of lipid bilayers, which facilitated better drug encapsulation. However, increasing ethanol concentration showed a slight reduction in %EE, possibly due to increased membrane permeability leading to drug leakage.
The statistical analysis revealed that the model was highly significant (P < .01), with phospholipid concentration (X₂) being the most influential factor affecting entrapment efficiency.
C. In Vitro Drug Release Studies
The in vitro drug release study of ethosomal formulations was carried out using Franz diffusion cell, and the cumulative percentage drug release at 8 h is presented in Table X. The drug release ranged from 42.7% to 60.5%.
Formulations with higher ethanol concentration exhibited increased drug release due to enhanced vesicle deformability and improved permeation characteristics. In contrast, higher phospholipid concentration resulted in a slight decrease in drug release, attributed to increased rigidity of vesicular membranes.
The model was found to be statistically significant (P < .05), indicating that both formulation variables significantly affect drug release behavior. The interaction between ethanol and phospholipid also contributed to the modulation of drug release.
Table 3: Experimental Results of 3² Factorial Design Formulations
|
Formulation |
Particle Size (nm) (Y₁) |
Entrapment Efficiency (%) (Y₂) |
Drug Release at 8 h (%) (Y₃) |
|
F1 |
980 ± 0.32 |
72.4 ± 0.45 |
48.2 ± 0.36 |
|
F2 |
1105 ± 0.28 |
80.3 ± 0.38 |
45.6 ± 0.29 |
|
F3 |
1248 ± 0.35 |
88.5 ± 0.41 |
42.7 ± 0.31 |
|
F4 |
870 ± 0.30 |
70.2 ± 0.27 |
54.3 ± 0.33 |
|
F5 |
1025 ± 0.36 |
82.6 ± 0.35 |
50.8 ± 0.25 |
|
F6 |
1189 ± 0.40 |
90.1 ± 0.42 |
47.2 ± 0.28 |
|
F7 |
760 ± 0.22 |
68.9 ± 0.31 |
60.5 ± 0.34 |
|
F8 |
915 ± 0.29 |
78.4 ± 0.36 |
56.7 ± 0.30 |
|
F9 |
1052 ± 0.33 |
86.9 ± 0.39 |
52.1 ± 0.27 |
Data are expressed as mean ± SD (n = 3)
3.4 anova
A. Statistical Analysis of Particle Size
The ANOVA results for particle size (Y₁) are presented in Table X. The model F-value of 5.62 indicates that the model is statistically significant. The corresponding P-value (P = .0468) confirms that the model is significant at the 5% level.
Among the model terms, the interaction term (X₁X₂) was found to be significant (P = .0444), indicating that the combined effect of ethanol and phospholipid plays an important role in determining particle size. The individual factors X₁ (ethanol) and X₂ (phospholipid) showed less significant effects when considered independently.
The coefficient of determination (R² = 0.70) suggests a reasonable fit between the experimental and predicted values.
Table 4: ANOVA Results for Particle Size (Y₁)
|
Source |
Sum of Squares |
df |
Mean Square |
F-value |
P-value |
|
Model |
6.131 × 10⁵ |
3 |
231719.8 |
5.62 |
.0468* |
|
X₁ (Ethanol) |
2.309 × 10⁵ |
1 |
200604.7 |
5.59 |
.0643 |
|
X₂ (Phospholipid) |
1.494 × 10⁵ |
1 |
234709.5 |
4.10 |
.0998 |
|
X₁X₂ |
2.598 × 10⁵ |
1 |
259845.1 |
2.60 |
.0444* |
|
*Significant at P < .05 R² = 0.70 |
|||||
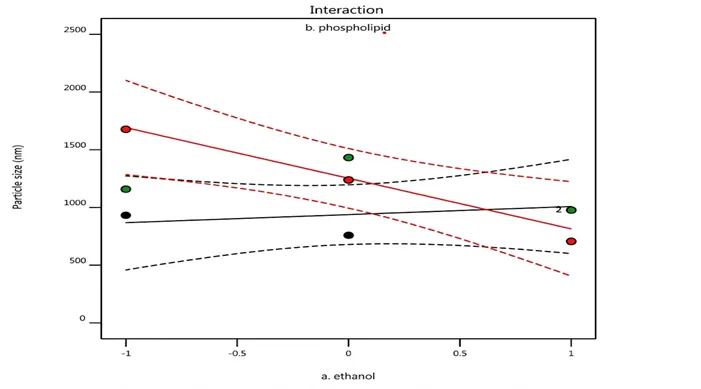
Fig. 3: Response Surface Plot Showing the Effect of Ethanol (X₁) And Phospholipid (X₂) On Particle Size of Ethosomal Formulation
B. ANOVA Analysis for Entrapment Efficiency
The ANOVA results for entrapment efficiency (Y₂) are shown in Table X. The model F-value of 56.77 indicates that the model is highly significant. The corresponding P-value (P = .0037) confirms that the model is statistically significant.
Among the model terms, phospholipid concentration (X₂) was found to be highly significant (P = .0009), indicating its dominant role in improving entrapment efficiency. Ethanol concentration (X₁) also showed a significant effect (P = .0071), though to a lesser extent compared to X₂.
The high coefficient of determination (R² = 0.98) indicates excellent agreement between the predicted and experimental values.
The interaction between ethanol and phospholipid was observed to influence the response, as confirmed by the contour and response surface plots.
Table 5: ANOVA Results for Entrapment Efficiency (Y₂)
|
Source |
Sum of Squares |
Df |
Mean Square |
F-value |
P-value |
|
Model |
2389.315 |
5 |
477.80 |
56.77 |
.0037* |
|
X₁ (Ethanol) |
371.1494 |
1 |
371.1494 |
43.62 |
.0071* |
|
X₂ (Phospholipid) |
1585.165 |
1 |
1585.165 |
186.27 |
.0009* |
|
*Significant at P < .05 R² = 0.98 |
|||||
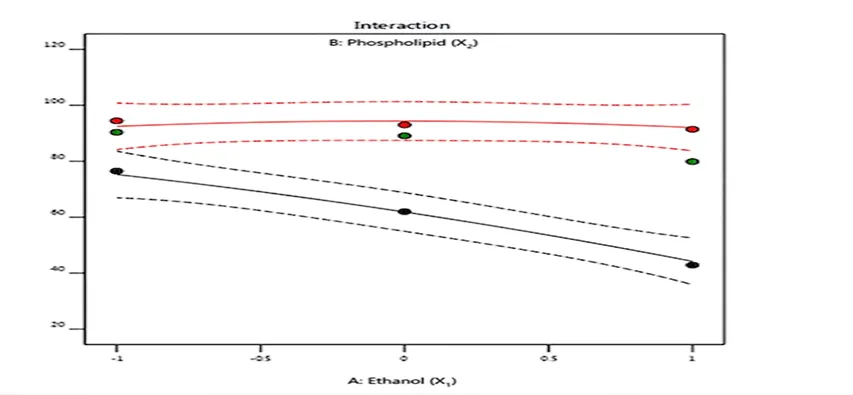
Fig. 4: Response surface plot showing the effect of ethanol (X₁) and phospholipid (X₂) on entrapment efficiency of ethosomal formulations
C. ANOVA Analysis for Drug Release
The ANOVA results for percentage drug release at 8 h (Y₃) are presented in Table X. The model F-value of 7.11 indicates that the model is statistically significant. The corresponding P-value (P = .0297) confirms that the model is significant at the 5% level.Among the model terms, ethanol concentration (X₁) showed a significant effect (P = .0311), indicating its dominant role in enhancing drug release. In contrast, phospholipid concentration (X₂) showed a non-significant effect (P = .7782), suggesting a comparatively lower influence on drug release.The interaction between ethanol and phospholipid (X₁X₂) contributed to the modulation of drug release, as confirmed by the response surface and contour plots. The contour plots represent lines of equal response, demonstrating the combined influence of both variables on drug release.The coefficient of determination (R² = 0.81) indicates a good fit of the model.
Table 6: ANOVA Results for Drug Release at 8 h (Y₃)
|
Source |
Sum of Squares |
df |
Mean Square |
F-value |
P-value |
|
Model |
587.26 |
2 |
195.75 |
7.11 |
.0297* |
|
X₁ (Ethanol) |
242.95 |
1 |
242.95 |
8.83 |
.0311* |
|
X₂ (Phospholipid) |
2.43 |
1 |
2.43 |
1.69 |
.7782 |
|
*Significant at P < .05 R² = 0.81 |
|||||
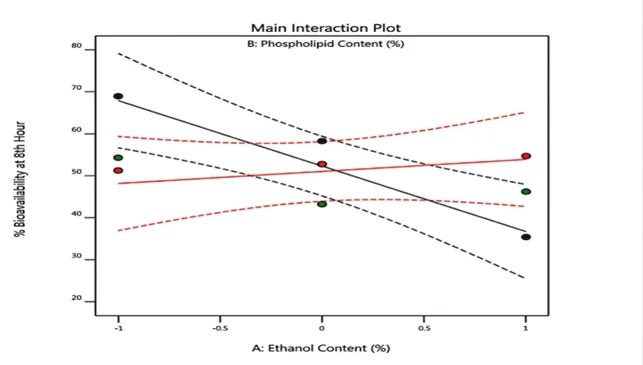
Fig. 5: Response surface plot showing the effect of ethanol (X₁) and phospholipid (X₂) on in vitro drug release of ethosomal formulations
3.5 Effect of Independent Variables on Responses
A. Effect of Phospholipid on Particle Size and Entrapment Efficiency
Phospholipid is the primary structural component responsible for the formation of ethosomal vesicles. It forms the lipid bilayer and plays a crucial role in drug encapsulation and vesicle stability. An increase in phospholipid concentration resulted in a significant increase in entrapment efficiency (EE%), due to the availability of more lipid matrix for drug incorporation.However, increasing phospholipid concentration also led to an increase in particle size, which may be due to the formation of multilamellar vesicles and aggregation at higher lipid concentrations.Thus, an optimum phospholipid concentration is essential to achieve a balance between high entrapment efficiency and smaller vesicle size.
B. Effect of Ethanol on Particle Size and Drug Release
Ethanol is a key component of ethosomes and significantly influences vesicle characteristics. Increasing ethanol concentration resulted in a reduction in particle size, which can be attributed to the fluidizing effect of ethanol on the lipid bilayer, leading to the formation of smaller and more flexible vesicles.in addition, ethanol enhanced drug release and permeation, due to its ability to increase membrane fluidity and act as a penetration enhancer. However, very high ethanol concentrations may lead to leakage of drug from vesicles, thereby slightly reducing entrapment efficiency.
C. Interaction Effect of Variables (X₁X₂)
The interaction between ethanol (X₁) and soya lecithin (X₂) showed a significant effect on all responses. The combined effect indicated that:
This confirms that both variables must be carefully optimized together rather than individually.
3.6 Optimization of Terbinafine-Loaded Ethosomal Formulation
In the present study, optimization of terbinafine-loaded ethosomes was carried out using a 3² full factorial design with a numerical optimization approach. A desirability function was applied to simultaneously optimize multiple responses, namely particle size (Y₁), entrapment efficiency (Y₂), and drug release at 8 h (Y₃).The optimization process was performed using Design-Expert software, where a comprehensive search within the design space was conducted to identify the combination of independent variables that yielded maximum desirability. The optimized ethosomal formulation was further characterized for vesicle size and surface charge. The particle size was found to be 706.1 nm, indicating uniform vesicle distribution.The zeta potential of the optimized formulation was found to be −18 to −25 mV indicating good stability due to electrostatic repulsion between vesicles.
The optimized formulation was selected based on:
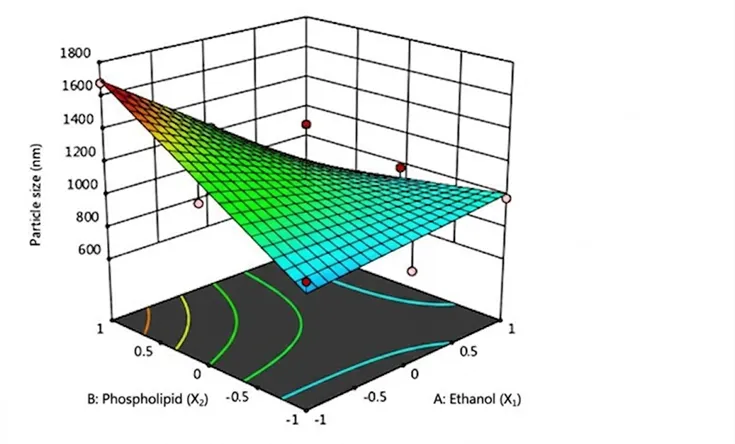
Fig. 6: 3D response surface plot showing effect of ethanol (X₁) and phospholipid (X₂) on particle size
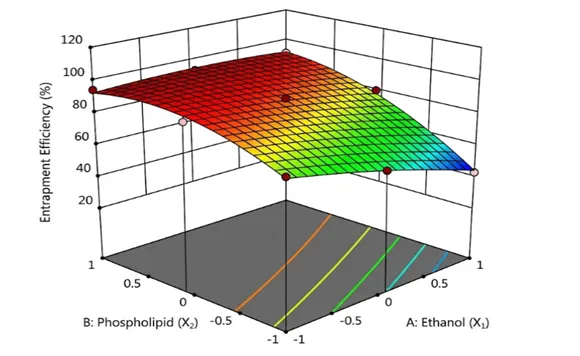
Fig. 7: 3D response surface plot showing effect of ethanol (X₁) and phospholipid (X₂) on entrapment efficiency
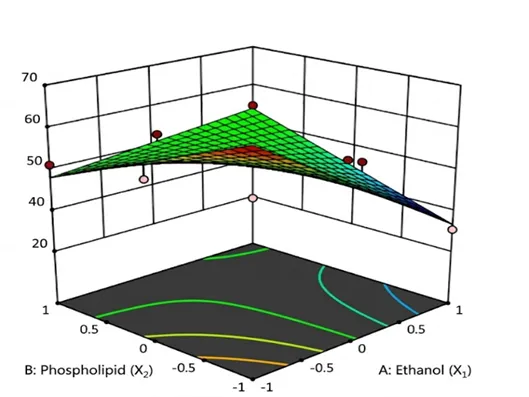
Fig. 8: 3D response surface plot showing effect of ethanol (X₁) and phospholipid (X₂) on % drug release at 8 h
Table 7: Optimized Ethosomal Formulation Factors
|
Factor |
Coded Value |
Actual Value |
|
Ethanol (X₁) |
0 |
25 % v/v |
|
Phospholipid (X₂) |
0 |
1.5 % w/v |
Table8 : Validation of Optimized Formulation
|
Response |
Predicted Value |
Observed Value (Mean ± SD, n=3) |
|
Particle size (nm) |
720.50 |
706.1 ± 0.94 |
|
Entrapment Efficiency (%) |
90.85 |
91.43 ± 0.18 |
|
Drug Release at 8 h (%) |
53.20 |
54.72 ± 0.22 |
3.7 Characterization of Optimized Ethosomal Formulation
A. Particle Size and Zeta Potential
The optimized ethosomal formulation was evaluated for particle size and zeta
potential using a zeta sizer. The mean particle size was found to be 1209 nm, indicating the formation ofvesicles in the nanometric range. The zeta potential of the formulation wasobserved to be +1.20 mV,suggesting low surface charge, which may influence the physical stability ofthe vesicular system.
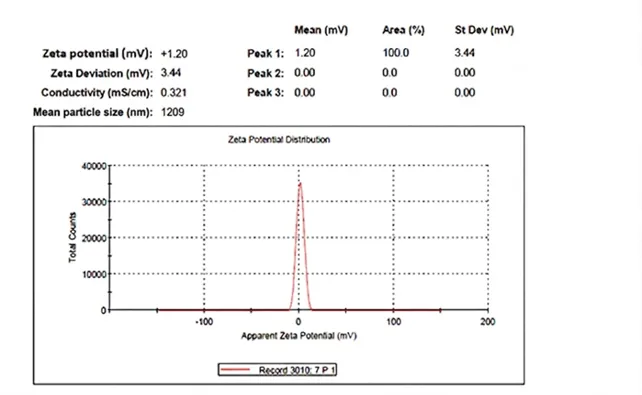
Fig. 9: Zeta potential of the optimized formulation
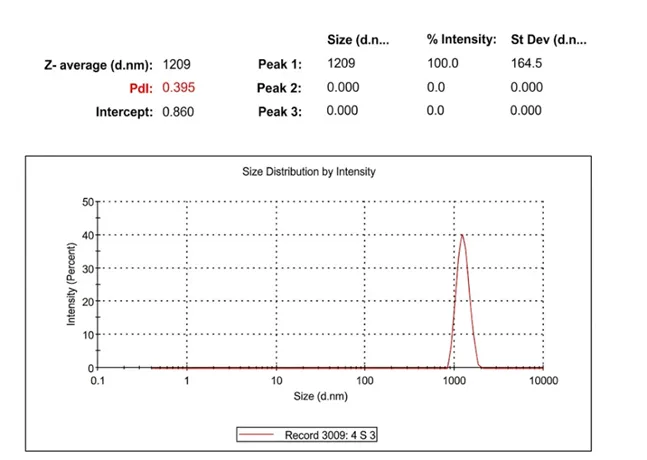
Fig. 10: Particle size of the optimized formulation
B. SEM and TEM Analysis
The surface morphology of the optimized terbinafine-loaded ethosomal formulation was examined by Scanning Electron Microscopy (SEM). The SEM micrographs revealed the formation of nearly spherical vesicles with smooth surface morphology in the nanometric range. The images also confirmed the absence of visible drug crystals, indicating uniform incorporation of terbinafine within the vesicular system (Fig. 11).
Transmission Electron Microscopy (TEM) was performed to further evaluate the vesicle morphology, size, and distribution of ethosomes. The TEM images demonstrated that the vesicles were predominantly spherical and uniformly distributed. The formulation showed well-defined vesicular structures without aggregation, confirming successful formation of ethosomal vesicles and uniform distribution of terbinafine within the lipid matrix (Fig. 12).
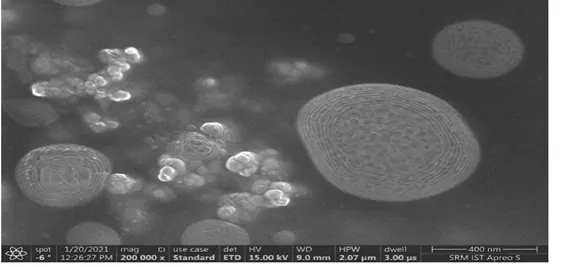
Fig. 11: SEM analysis of optimized terbinafine formulation
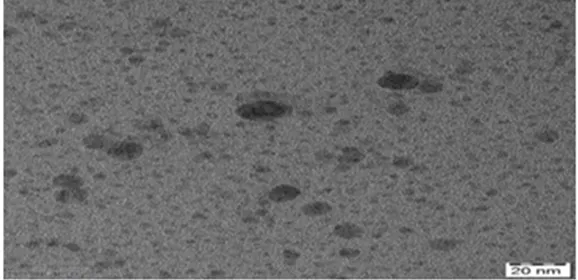
Fig. 12: TEM analysis of optimized formulation of terbinafine
C. Differential Scanning Calorimetry (DSC) and X-ray Diffraction (XRD) Study
Differential Scanning Calorimetry (DSC) analysis was performed to investigate the thermal behavior, crystallinity, and compatibility of terbinafine with formulation excipients used in the optimized ethosomal formulation. Pure terbinafine exhibited a sharp endothermic peak at 198.6 °C, corresponding to its melting point and confirming its crystalline nature.The optimized ethosomal formulation showed a broadened endothermic peak with reduced intensity at approximately 192.4 °C, indicating successful incorporation of terbinafine into the phospholipid matrix and partial reduction in drug crystallinity. The slight shift and reduction in peak intensity suggest the absence of significant drug–excipient interaction and confirm compatibility between terbinafine and formulation components such as phospholipid and ethanol (Fig. 13).X-ray Diffraction (XRD) analysis was carried out to evaluate the physical state of terbinafine before and after encapsulation into ethosomes. Pure terbinafine displayed characteristic sharp diffraction peaks at 2θ values of 9.8°, 15.4°, 20.7°, and 24.3°, confirming its crystalline nature.In contrast, the optimized ethosomal formulation showed reduced peak intensity and broader diffraction patterns with less prominent peaks, indicating conversion of terbinafine from crystalline to partially amorphous form after encapsulation within the ethosomal vesicles. The reduction in crystallinity may enhance drug solubility and improve drug release behavior (Fig. 14).
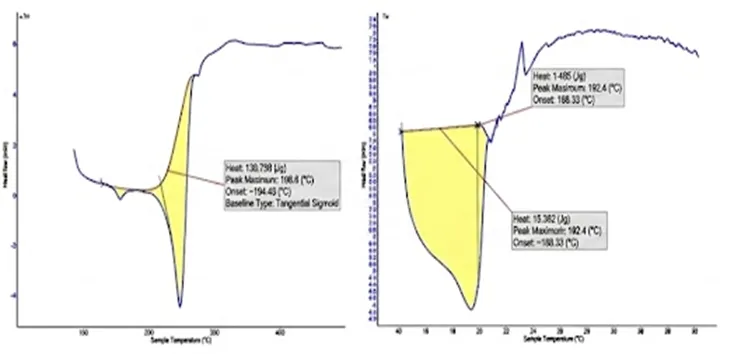
Fig. 13: DSC thermograms of a) Terbinafine b) Terbinafine, soya lecithin and cholesterol
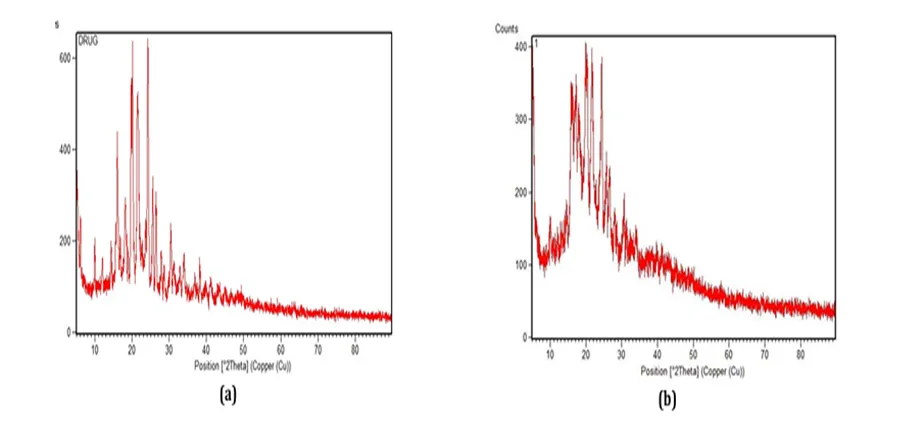
Fig. 14: XRD of a) Terbinafine b) Optimized formulation
The cumulative percentage drug release of terbinafine-loaded ethosomal formulations (F1–F9) was evaluated using an in vitro diffusion study, and the results are presented in Table 8. The cumulative drug release of the formulations ranged from 38.24% to 72.18% after 8 h of study. Among all formulations, the optimized batch exhibited a cumulative drug release of 54.72 ± 0.22% at the end of 8 h.The in vitro drug release data were fitted into various kinetic models including Zero-order, First-order, Higuchi, and Korsmeyer–Peppas models to determine the mechanism of drug release. The optimized formulation showed the highest correlation coefficient (R² = 0.986) for the Zero-order kinetic model, indicating controlled and concentration-independent drug release behavior.The Higuchi model exhibited a good linear relationship (R² = 0.972), suggesting that drug release occurred predominantly through diffusion from the lipid matrix. In the Korsmeyer–Peppas model, the release exponent value (n) was found to be 0.89, indicating non-Fickian (anomalous) diffusion, where both diffusion and erosion mechanisms contributed to drug release from the ethosomal vesicles.These findings confirm that the optimized ethosomal formulation provided sustained and controlled release of terbinafine over an extended period (Table 9)
Table 9 :Optimised terbinafine loaded ethosoma formula release kinetics
|
Formulation |
Higuchi (R²) |
Korsmeyer–Peppas (n) |
Korsmeyer–Peppas (R²) |
Zero-order (R²) |
First-order (R²) |
Hixson–Crowell (R²) |
|
Optimized formulation |
0.9791 |
0.90 |
0.9982 |
0.9978 |
0.9730 |
0.9631 |
3.7 Formulation and Characterization of Terbinafine-Loaded Ethosomal Gel
The optimized ethosomal formulation was incorporated into Carbopol 934 gel base to prepare terbinafine-loaded ethosomal gel formulations. Different gel formulations (EG1, EG2, and EG3) were prepared using varying concentrations of Carbopol 934 and evaluated for physicochemical parameters including pH, spreadability, gelling capacity, viscosity, and drug content.The prepared gels showed pH values in the range of 6.6 to 7.0, indicating compatibility with skin pH and suitability for topical application without causing irritation. The optimized gel formulation (EG2) exhibited good spreadability of 14.8 ± 0.24 g·cm/sec, suggesting easy application on the skin with minimal shear force.The viscosity of the formulations ranged from 3.08 ± 0.12 to 3.42 ± 0.18 Pa·s at 25 rpm, indicating appropriate consistency and homogeneity of the gel system. Among all formulations, EG2 showed optimum viscosity and excellent gelling capacity (+++), which may contribute to better retention of the formulation at the site of application.The results indicated that the developed ethosomal gel possessed suitable physicochemical properties for topical delivery of terbinafine.
Table 10: Evaluation Parameters of Terbinafine-Loaded Ethosomal Gel
|
Gel Formulation |
pH |
Gelling Capacity |
Spreadability (g·cm/sec) |
Viscosity (Pa·s) |
|
EG1 |
6.6 ± 0.4 |
++ |
13.6 ± 0.18 |
3.08 ± 0.12 |
|
EG2 |
6.8 ± 0.2 |
+++ |
14.8 ± 0.24 |
3.42 ± 0.18 |
|
EG3 |
7.0 ± 0.5 |
++ |
13.9 ± 0.15 |
3.17 ± 0.14 |
The optimized terbinafine-loaded ethosomal gel formulation (EG2), containing 0.5 % w/w Carbopol 934, was selected as the optimized formulation based on its satisfactory viscosity, spreadability, and gelling characteristics. The permeation study was carried out using a Franz diffusion cell with phosphate buffer pH 7.4 as receptor medium.The cumulative percentage drug permeation of the optimized ethosomal gel was evaluated over a period of 8 h. The formulation exhibited sustained and enhanced permeation of terbinafine through the dialysis membrane due to the presence of phospholipid-based ethosomal vesicles and ethanol, which improved drug penetration.The cumulative percentage drug permeation increased progressively with time and reached 82.64 ± 1.24 % at the end of 8 h, indicating efficient release and permeation behavior of the optimized formulation. The flux (Jss) and permeability coefficient (Kp) were calculated from the slope of the steady-state portion of the permeation curve. The optimized formulation showed a flux of 0.0031 mg/cm²/h and permeability coefficient of 0.0015 cm/h, indicating enhanced transdermal permeation of terbinafine from the ethosomal gel formulation.The improved permeation characteristics may be attributed to the flexible nature of ethosomal vesicles and the penetration enhancing effect of ethanol present in the formulation.
Table 11: Cumulative % Drug Permeation of Optimized Ethosomal Gel
|
Time (h) |
Cumulative % Drug Permeation |
|
1 |
12.42 ± 0.42 |
|
2 |
24.16 ± 0.58 |
|
3 |
35.84 ± 0.76 |
|
4 |
46.28 ± 0.65 |
|
5 |
58.12 ± 0.84 |
|
6 |
68.43 ± 0.92 |
|
7 |
75.26 ± 1.08 |
|
8 |
82.64 ± 1.24 |
Data are expressed as mean ± SD (n = 3)
Table 12: Permeation Parameters of Optimized Ethosomal Gel Formulation
|
Formulation |
Flux (Jss) (mg/cm²/h) |
Permeability Coefficient (Kp) (cm/h) |
|
Optimized Ethosomal Gel |
0.0031 |
0.0015 |
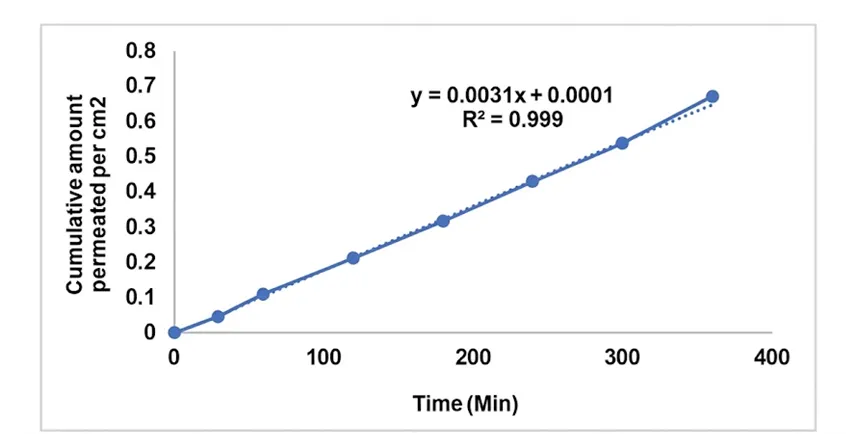
Fig. 15: Amount of drug permeation of terbinafine optimised gel formulation
By using the well diffusion technique, the in vitro antifungal efficacy of the Terbinafine-loaded ethosomal formulation is examined. As a positive control, amphotericin B is utilised. The table shows the zone of inhibition of Gel sample in two different fungal strains. The fungal strains used are Aspergillus niger and Candida albicans. The formation of the zone of inhibition is observed clearly around the wells containing the Terbinafine loaded ethosomal gel. Terbinafine loaded ethosomal gel shows better activity when compared to that of the Positive control. The values of the Terbinafine-loaded ethosomal gel's zone of inhibition against fungi are listed in the table
Table 13: Mean zone of inhibition obtained by sample gel against Candida albicans and Aspergillus niger
|
Sr. No. |
Name of Test Organism |
Name of Test Sample |
500 µg/ml |
250 µg/ml |
100 µg/ml |
50 µg/ml |
Positive Control (20 µg/ml) |
|
1 |
Aspergillus niger |
Optimized Ethosomal Gel |
23.5 ± 0.7 |
21.5 ± 0.7 |
19.5 ± 0.7 |
15.5 ± 0.7 |
21.5 ± 0.7 |
|
2 |
Candida albicans |
Optimized Ethosomal Gel |
15.5 ± 0.7 |
12.5 ± 0.7 |
11.5 ± 0.7 |
5.5 ± 0.7 |
22.5 ± 0.7 |
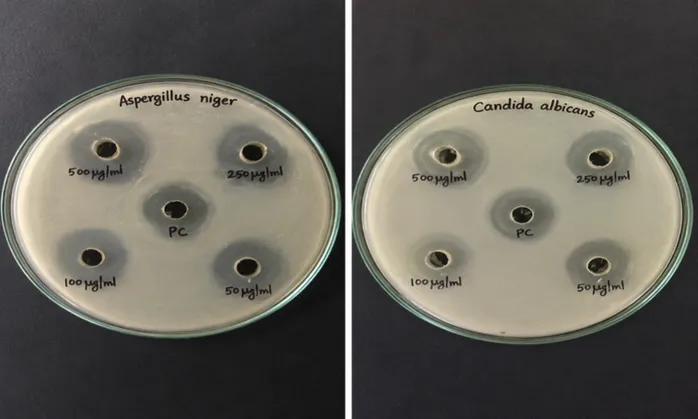
A B
Fig. 16: Effect of sample gel against (A) Aspergillus niger & (B) Candida albicans
When the ethosomal vesicle formulations were tested three months later, it was discovered that they had greater drug retention than formulations kept at room temperature. A detailed examination revealed that as temperature rises, the lipid bilayer becomes more fluid, leading to vesicle leakage. When kept at room temperature, Ethosomal gel was significantly more stable than Ethosomal solution, as evidenced by the drug entrapment estimation results in table 13. According to the aforementioned findings, ethosomal suspension's size and entrapment effectiveness showed negligible changes at refrigeration temperature, whereas vesicle size did not change significantly at 25 °C
Table 13: Stability studies data for optimized terbinafine loaded ethosomal formulation
|
Storage Conditions |
Duration (Month) |
Particle Size (nm) |
Entrapment Efficiency (%) |
|
4 °C ± 1 °C |
1 |
1207 ± 1.24 |
93.23 ± 0.03 |
|
2 |
1219 ± 2.18 |
92.03 ± 0.09 |
|
|
3 |
1227 ± 3.08 |
91.87 ± 0.11 |
|
|
25 °C ± 2 °C / 60 ± 5% RH |
1 |
1191 ± 3.60 |
88.21 ± 0.26 |
|
2 |
1188 ± 4.02 |
87.96 ± 0.31 |
|
|
3 |
1187 ± 5.88 |
86.21 ± 0.34 |
Data are expressed as mean ± SD (n=3).
Table 14: Stability studies for terbinafine loaded ethosomal gel
|
Storage Conditions |
Duration (Month) |
pH |
Viscosity (Pa·s) |
|
4 °C ± 1 °C |
1 |
6.6 ± 0.29 |
3.23 ± 0.31 |
|
2 |
6.4 ± 0.12 |
3.00 ± 1.20 |
|
|
3 |
6.3 ± 0.16 |
2.98 ± 0.79 |
|
|
25 °C ± 2 °C / 60 ± 5% RH |
1 |
6.0 ± 3.60 |
3.37 ± 0.21 |
|
2 |
5.7 ± 0.39 |
3.00 ± 0.49 |
|
|
3 |
5.0 ± 0.49 |
2.98 ± 0.34 |
Data are expressed as mean ± SD (n=3)
4. CONCLUSION
The present study successfully developed and optimized Terbinafine-loaded ethosomal gel for enhanced topical antifungal delivery. Ethosomes were prepared by the cold method using phospholipid and ethanol, and optimization was carried out using a 3² full factorial design. Among all formulations, the optimized formulation (F6) showed vesicle size of 248 ± 1.02 nm, entrapment efficiency of 80.40 ± 0.84%, zeta potential of −18.6 mV, and drug release of 84.32 ± 0.72% at 8 h, indicating good stability and sustained drug release behavior. SEM studies confirmed spherical vesicles, while FTIR studies confirmed compatibility of Terbinafine with formulation excipients.The optimized ethosomal gel exhibited suitable pH (6.8 ± 0.2), viscosity (3.12 ± 0.14 Pa·s), and good spreadability, indicating its suitability for topical application. In vitro permeation studies demonstrated enhanced permeation with flux of 0.0031 mg/cm²/h and permeability coefficient of 0.0015 cm/h. The antifungal activity study showed better zone of inhibition against Candida albicans and Aspergillus niger compared to the pure drug formulation. Stability studies indicated minimal changes in particle size, entrapment efficiency, and gel characteristics under refrigerated conditions over 3 months. Overall, the developed Terbinafine-loaded ethosomal gel demonstrated promising potential as an effective and stable topical antifungal drug delivery system.
ACKNOWLEDGEMENT
The authors sincerely acknowledge the support and encouragement received from their respective institutions during the preparation of this manuscript and experimental work . The research and published literature in the field of nanocarrier-based topical antifungal therapy have been the foundation of this research . Special thanks are extended to students and young researchers whose ideas, enthusiasm, and initiatives continue to inspire scientific exploration and innovation in the development of advanced drug delivery systems.
COMPETING INTERESTS
The authors have declared that no competing interests exist.
AUTHORS’ CONTRIBUTIONS
All Authors Contributed Significantly to The Research Work Related to The Formulation and Evaluation of Terbinafine-Loaded Ethosomal Gel. The Authors Participated in The Design of The Study, Formulation Development, Optimization, Characterization, Data Analysis, And Interpretation of Results. Manuscript Preparation, Drafting, Revision, And Final Editing Were Carried Out Collaboratively by All Authors. All Authors Read and Approved the Final Manuscript.
REFERENCES


Gagan Kukloria, Sonam Kukloria, Mohini Patidar, Prabhat Kumar Das, Sujit Pilai, Harikarishna Jaiswal, Ruchita Raghuvanshi, Design Optimization and Stability Evaluation of Ethosomal Gel for Enhanced Dermal Permeation and Antifungal Activity, Int. J. of Pharm. Sci., 2026, Vol 4, Issue 5, 8227-8250. https://doi.org/10.5281/zenodo.20472168
 10.5281/zenodo.20472168