

We use cookies to ensure our website works properly and to personalise your experience. Cookies policy
Department of Pharmaceutical Quality Assurance, Aditya Bangalore Institute of Pharmacy Education & Research.
Rosuvastatin calcium is a popular drug for the management of hypercholesterolemia. It is an HMG-CoA reductase inhibitor and requires analytical methods for routine quality control. The present study describes the simple, rapid, accurate and economical UV spectrophotometric method development and validation for quantification of rosuvastatin calcium in bulk and tablet dosage forms using optimized solvent system of 50% methanolic sodium hydroxide (NaOH) to improve the solubility and stability. The drug exhibited maximum absorbance at 240 nm and showed linearity in the concentration range of 2-12 µg/mL (R 2 = 0.9974; y = 0.0361x-0.03). The method was validated according to ICH guidelines and was found to be precise, accurate, specific and sensitive. The method showed low %RSD values for repeatability (0.259%), intraday precision (0.653%) and interday precision (0.165%) and mean accuracy of 100.74% for recovery studies. The LOD and LOQ were 0.704 µg/mL and 2.135 µg/mL, respectively. The method was applied to three marketed tablet formulations (Crestor, Rosuvas and Razel) and assay values were within acceptable limits confirming suitability for pharmaceutical analysis. The proposed method is reliable and economical and can be utilized for routine quality control analysis of rosuvastatin calcium in pharmaceutical laboratories
1.1. Background and Rationale
Rosuvastatin (development code ZD4522 and trade name Crestor) is a medicine of treatment of high cholesterol or for controlling hypercholesterolemia in patient with risk of cardiovascular diseases (like heart attacks, stroke, and artery diseases), its act by inhibiting HMG-CoA reductase which make cholesterol, by blocking it liver makes less cholesterol and liver pull more LDL out of blood result in LDL drops, HDL rises, triglycerides fall. Since its effective as at low dose 5-20mg can lower LDL by approx. 50-60% and having longer half-life of 19 hrs., not heavily broken by CYP3A4 (unlike atorvastatin/simvastatin), so fewer interaction with other medicine, effective with low kidney function with dose adjustment, as per studies it is effective is reducing artery plaque more than same statin. Pharmacokinetic analyses and physiologically?based PK/PD modeling confirm a rapid absorption (peak plasma levels in ~3–5?hours), a half?life of approximately ~18–20?hours predictable pharmacodynamic pH profiles, and oral bioavailability of roughly 20%, supporting its once daily. [1-4]
History of Rosuvastatin Calcium
The search for a more "liver-selective" and powerful statin than first-generation alternatives like lovastatin led to the development of rosuvastatin.
Discovery: AstraZeneca was granted a licence to develop it globally after Shionogi, a Japanese company, made the first discovery. Rosuvastatin is a completely manufactured substance, in contrast to previous statins made from fungi.
Approval: On August 12, 2003, the U.S. FDA gave Rosuvastatin (Crestor) approval. Known as a "super-statin" because it could reduce LDL cholesterol by more than 50% even at modest dosages, it was the seventh statin to be introduced to the market.
Significant Clinical Milestones: An important turning point was the 2008 JUPITER investigation. It shown that rosuvastatin dramatically decreased heart attacks and strokes even in those with "normal" cholesterol levels but elevated inflammation (as determined by CRP), increasing the number of prospective patients.
Market Share and Present Situation (2026)
Rosuvastatin's enormous volume and the predominance of generic forms characterize the market as of 2026. [5-8]
1.2. Ultraviolet- Visible Spectroscopy
UV–Visible spectroscopy is a technique that measures how molecules absorb light in the ultraviolet and visible regions, typically between 200 and 800 nanometers. This method tracks how electrons especially those involved in π→π* and n→π* transitions are excited to higher energy levels, offering insights into a molecule’s electronic structure and degree of conjugation and its work on this transition principle.
Its fundamental law on which UV spectroscopy work id Beer lambert law which state: -
A=ε×L×C
Where, A(Absorbance), ε (Molar Absorptivity), C (Concentration), L (Path Length). [9-12]
1.3. Applications: -
Key Applications of UV–Vis Spectroscopy
2.MATERIALS AND METHODS:
2.1 Material
All material and reagents used were of the analytical grade. Rosuvastatin Calcium were obtained as gift sample from Arham Bioceutical Pvt.Ltd Dehradun. Crestor, Rosuvas and Razel 10 mg were purchased from market. Methanol, NaOH, Distilled Water were procured from SGRR University, School of Pharmaceutical Science.
A single beam UV-Visible spectrophotometer (Cary 60) was used. Other instrument used in the method development and validation include sonicator, Digital weighing balance (TX 323L model).
2.2 Selection of Solvent
A combination of Methanol and Sodium Hydroxide (NaOH) in a 50:50 ratio (50% Methanolic NaOH) was selected as the solvent system for this analysis. This specific mixture was chosen because the analyte exhibits excellent solubility in both the organic and alkaline aqueous components. Furthermore, this solvent system is cost-effective, readily available, and ensures the complete dissolution of the compound, providing a stable environment for accurate analytical measurement.
2.3 Preparation of Solvent
The 50% Methanolic NaOH solvent system was prepared by mixing equal volumes of Methanol and a pre-standardized aqueous Sodium Hydroxide solution (50:50 v/v). The mixture was stirred thoroughly to ensure homogeneity and allowed to cool to room temperature to account for any exothermic reaction.
2.4 Preparation of Standard Stock Solution
Stock solution was prepared by transferring 10 mg of the drug in 100 ml volumetric flask and dissolved in few ml of solvent and the volume was made up to 100 ml with same solvent obtaining standard stock solution of the concentration 100(µg/ml).
2.5 Selection of wavelength Maxima ( λ max)
Pipette out 1 ml of working standard solution and transfer into 10 ml volumetric flask and the volume was made up to the mark with solvent to get the concentration 10 /ml. The result 10 /ml solution was scanned in UV- spectrophotometric between 200-400nm using solvent as blank.
2.6 Preparation of Calibration curves:
Pipette out 0.2,0.4,0.6,0.8,1 and 1.2 ml working standard solution and transfer into six separate 10 ml volumetric flask and make the volume up to 10 ml with the solvent to get the concentration 2,4,6,8,10 and 12 /ml respectively. Absorbance of the resultant solution was measured at 240nm. A graph was plotted between the concentration and the respective absorbance.
3 VALIDATIONS OF DEVELOPED METHOD
Validation of the developed method is done by checking all Parameters given in ICH guideline.[17-18] Parameters which were performed are mentioned below:
3.1. Linearity and Range-Linearity of the analytical method demonstrates that method is capable to obtain test result which are directly proportional to the concentration of the analyte in the sample and range of the analytical procedure is the interval between upper and lower concentration of the analyte in the sample.
3.2. Precision - It is performed to determine how capable is the developed analytical method to yield closeness of the data values of multiple samples under the same operating condition over an interval of time it is determined by performing the 2 parameters mentioned below -
a. Repeatability - Six replicates of 0.6 ml of standard stock solution were taken in a 10 ml volumetric flask and the volume was made up to 10 ml with the solvent. %RSD for absorbance of Rosuvastatin calcium was calculated for six replicates.
b. Intermediate Precision - It is determined by two methods as Intraday and Interday precision by preparing three different concentrations of the Rosuvastatin calcium.
1. Intraday Precision – 0.6ml, 0.8ml and 1ml of the standard stock solution were taken in 10ml volumetric flask and volume was made up to the mark with solvent to obtain the solution of concentration 4,8 ,12 µg/ml the absorbance of these solutions was measured and recorded thrice with in a day. %RSD for absorbance of Rosuvastatin calcium was calculated for three replicates.
2. Interday Precision-0.4ml, 0.8ml and 1.2 ml of the standard stock solution were taken in 10ml volumetric flask and volume was made up to the mark with solvent to obtain the solution of concentration 4, 8, 12 µg/ml the absorbance of these solutions was measured once daily for three consecutive days. %RSD for absorbance of Rosuvastatin Calcium in different concentrations of solution was calculated.
3.3. Specificity-It is the ability of the method to measure the analyte in the presence of component which may be expected to be present such as excipients (magnesium stearate, starch and lactose), About 1ml of the standard stock was taken in six 10ml volumetric flask and volume was made up to the mark with the solvent, the absorbance of these dilutions was measured. For specificity determination a solution of 1ml of standard stock was taken in six volumetric flask and to it about 1ml of 10 µg/ml solution of each excipient (magnesium stearate, starch and lactose) was added and volume was made up to the mark with the solvent. The absorbance was measured and recorded. [19-22]
3.4. Accuracy-The accuracy of an analytical procedure determines that the method can yield data values close to the true values. The accuracy of the method is carried out at 3 different level 80%, 100% and 120% of the working concentration of sample. For measuring accuracy pipette out 1 ml standard solution in 10 ml volumetric flask 9 such replicates were made. Spike 3 volumetric flask with 0.8 ml of working solution (prepared from formulation) and dilute it to 10 ml with the solvent to obtain the solution of 18 µg/ml. Spike another 3 solution with 1 ml of the working solution and dilute with solvent to obtain the solution of 20 µg/ml. spike last three of the solution with 1.2ml of working solution and dilute it to 10 ml with the solvent of to obtain the solution of 22 µg/ml. The absorbance of the resultant solution was measured and the % recovery and %RSD were calculated. [23]
3.5. Limit of Detection (LOD) and Limit of Quantitation (LOQ) -
LOD is the lowest amount of analyte in a sample which can be detected and LOQ is lowest amount of analyte in a sample which can be quantitatively determined. The limit of detection (LOD) and limit of quantification (LOQ) of Rosuvastatin Calcium was evaluated from the slop (S) of calibration curve and standard deviation of y-intercept of the regression equation using following equation:
LOD = 3.3 * SD / Slope
LOD = 10 * SD / Slope
Where, SD = Standard Deviation [24-25]
3.6. Assay- Twenty Tablet were accurately weighed and powder. A quantity of tablet powder equivalent to 10 mg of Rosuvastatin Calcium was accurately weighed and transferred into a 50 ml volumetric flask. Approximately 25 ml of solvent system was added and the mixture was ultrasonicate for 15 minutes to ensure complete extraction of the drug from the excipients. The volume was then made up to the mark with the same solvent.
The resulting solution was filtered through Whatman filter paper no 41 to obtain clear filtrate. From filtrate 2.5 ml was accurately transferred into 25 ml volumetric flask and made up to the mark with solvent to achieve a final concentration of 10 µg/ml. The absorbance of this final solution was measured at the analytical wavelength 240 nm. The above procedure was repeated for two more brands.[26]
4 RESULT AND DISCUSSION
4.1. Selection of wavelength Maxima (λmax)
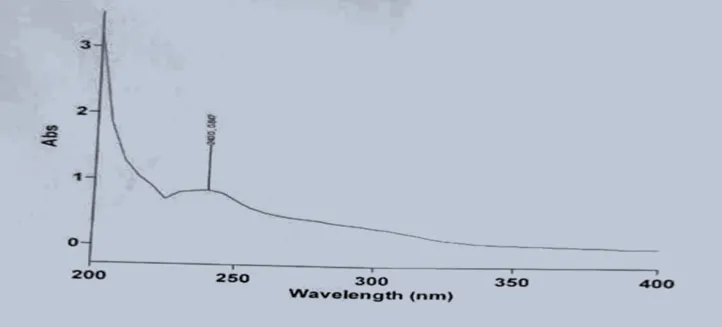
Figure 4.1: - Wavelength maxima for Rosuvastatin Calcium were established at 240 nm.
4.2. Preparation of Calibration Curve
The response of the drug was found linear in the entire investigation range 2-12 µg/ml for the drug, The calibration curve equation for the Rosuvastatin Calcium was found to be y = 0.0361x - 0.03 with 0.997 correlation coefficient.
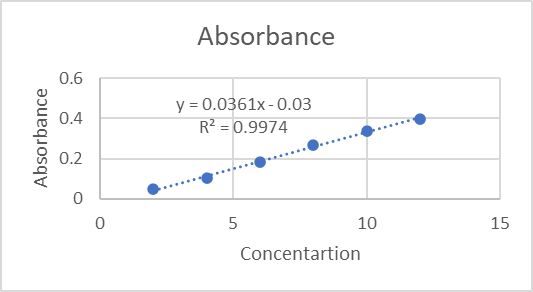
Figure 4.2: Calibration curve for Rosuvastatin Calcium
Table 7.1: Data for the linearity, E 1% 1cm, Absorptivity (L gm-1 cm-1), Molecular Absorptivity (L mol cm-1
|
S.No. |
Conc (µg/ml) |
Absorbance |
Absorbance Conc (A/C) |
E(1%,1cm) (A/C x 10000) |
Absorptivity (L gm-1 cm-1) (E(1%,1cm) / 10) |
Molecular Absorptivity (L mol cm-1) |
|
1 |
2 |
0.0473 |
0.02365 |
236.5 |
23.65 |
23676.96 |
|
2 |
4 |
0.1055 |
0.02638 |
263.8 |
26.38 |
26410.07 |
|
3 |
6 |
0.1834 |
0.03057 |
305.7 |
30.57 |
30604.85 |
|
4 |
8 |
0.2657 |
0.03321 |
332.1 |
33.21 |
33247.86 |
|
5 |
10 |
0.3372 |
0.03372 |
337.2 |
33.72 |
33758.44 |
|
6 |
12 |
0.3972 |
0.03310 |
331 |
33.1 |
331337.73 |
|
Mean |
|
|
0.0301 |
301.1 |
30.1 |
30144.33 |
4.3. Result of Validation of Developed Method of Rosuvastatin Calcium
1.Linearity and Range- For the rosuvastatin calcium the linear relationship was established in different concentration through linear regression analysis, in terms of correlation coefficient and the linearity range was within the beer's range. The results are shown below in the table no. 7.2
Table 7.2: Result of linearity by Calibration curve method
|
Parameters |
Observation |
|
Range (µg/ml) |
2-12 |
|
Regression Equation (y=mx+c) |
y = 0.0361x - 0.03 |
|
Correlation coefficient |
0.99740 |
2.Precision- It determine by performing the 2 parameter mention below: -
a. Repeatability - %RSD for absorbance of Rosuvastatin Calcium was calculated for six replicates and it lies within the acceptance criteria. The results are shown in table no. 7.3
Table 7.3: Result of the estimation of Repeatability parameter
|
Nominal Conc. (µg/ml) |
Absorbance |
Observed Conc. (µg/ml) |
Mean Conc. (µg/ml) |
SD |
%RSD |
|
6 |
0.1864 |
5.9945 |
6 |
0.0150 |
0.25933
|
|
0.1871 |
6.0139 |
||||
|
0.1859 |
5.9806 |
||||
|
0.1868 |
6.0055 |
||||
|
0.1873 |
6.0194 |
||||
|
0.1862 |
5.9889 |
b. Intermediate Precision- It is determined by the two methods as Intraday and Interday precision.
1.Intraday Precision- %RSD for absorbance of Rosuvastatin Calcium was calculated for three replicates and it lies within the acceptance criteria. The results are shown in table no. 7.4
Table 7.4: Result of the estimation of Intraday Precision mentioned below-
|
Conc.(µg/ml) |
Absorbance |
Conc. found (µg/ml) |
Mean Conc. (µg/ml) |
SD |
RSD |
||||
|
1 |
2 |
3 |
1 |
2 |
3 |
||||
|
4 |
0.1142 |
0.1151 |
0.1139 |
3.9945 |
4.0194 |
4.000 |
4.0046 |
0.0131 |
0.327 |
|
8 |
0.2585 |
0.2594 |
0.2582 |
7.9917 |
8.0166 |
8.0028 |
8.0037 |
0.0125 |
0.156 |
|
12 |
0.4035 |
0.4021 |
0.4040 |
12.0083 |
11.9695 |
12.0000 |
11.9926 |
0.0204 |
0.170 |
|
Mean |
|
0.653 |
|||||||
2.Interday Precision-%RSD for absorbance of Rosuvastatin Calcium in different concentration of solution was calculated and it lies within the acceptance criteria. The results are shown in table no. 7.5
Table 7.5: Result of the estimation of Interday Precision mentioned below-
|
Conc.(µg/ml) |
Absorbance |
Conc found (µg/ml) |
Mean Conc. (µg/ml) |
SD |
RSD |
||||
|
1 |
2 |
3 |
1 |
2 |
3 |
||||
|
4 |
0.1144 |
0.1158 |
0.1132 |
3.994 |
4.012 |
4.001 |
4.0023 |
0.00907 |
0.2267 |
|
8 |
0.2587 |
0.2612 |
0.2564 |
7.988 |
8.012 |
7.994 |
7.9973 |
0.01242 |
0.1553 |
|
12 |
0.4032 |
0.4065 |
0.3998 |
12.015 |
11.988 |
12.001 |
12.0013 |
0.01350 |
0.1125 |
|
|
|
0.1648 |
|||||||
3.Specificity- The concentration of the solution was determined and % interference was calculated. The results are shown in the table.7.6
Table 7.6: Result of the estimation of Specificity mentioned below-
|
Nominal Conc. (µg/ml) |
Without Excipients |
With Excipients |
% Interference |
||
|
Absorbance |
Observed Conc.(µg/ml) |
Absorbance |
Observed Conc. (µg/ml) |
||
|
10 |
0.3134 |
9.512 |
0.3155 |
9.571 |
0.59 |
|
10 |
0.3121 |
9.476 |
0.3168 |
10.607 |
1.1131 |
|
10 |
0.3148 |
9.551 |
0.3152 |
9.562 |
0.86 |
|
10 |
0.3115 |
9.460 |
0.3174 |
10.623 |
1.163 |
|
10 |
0.3139 |
9.526 |
0.3159 |
9.582 |
0.56 |
|
10 |
0.3128 |
9.492 |
0.3182 |
10.645 |
1.153 |
|
Mean |
|
|
|
|
0.90 |
4.Accuracy: - The absorbance of the resultant solution was measured and the % recovery and % RSD were calculated and it lies within the acceptance criteria. The results are shown in the table.7.7
Table 7.7: Result of the estimation of Accuracy mentioned below-
|
Recovery |
Absorbance |
Observed Conc.(µg/ml) |
%Recovery |
|
80% |
0.2558 |
8.01 |
101.1 |
|
80% |
0.2541 |
7.96 |
99.5 |
|
80% |
0.2562 |
8.02 |
100.3 |
|
100% |
0.3372 |
10.31 |
103.1 |
|
100% |
0.3315 |
10.15 |
101.5 |
|
100% |
0.3340 |
10.22 |
102.2 |
|
120% |
0.3972 |
12.01 |
100.1 |
|
120% |
0.3945 |
11.94 |
99.5 |
|
120% |
0.3980 |
12.04 |
100.3 |
|
Mean ± SD |
100.74 ± 1.25 |
||
|
%RSD |
1.24 |
||
5.Limit of Detection (LOD) and Limit of Quantification (LOQ)
The sensitivity of the technique is identified by the low value of LOD and LOQ. The result are shown in the table.7.8
Table 7.8: Result of the estimation of LOD and LOQ mentioned below-
|
Limit of Detection (LOD) |
0.704 |
|
Limit of Quantification(LOQ) |
2.135 |
6. Assay- Twenty Tablet were accurately weighed and powder. A quantity of tablet powder equivalent to 10 mg of Rosuvastatin Calcium was accurately weighed and transferred into a 50 ml volumetric flask. Approximately 25 ml of solvent system was added and the mixture was ultrasonicate for 15 minutes to ensure complete extraction of the drug from the excipients. The volume was then made up to the mark with the same solvent.
The resulting solution was filtered through Whatman filter paper no 41 to obtain clear filtrate. From filtrate 2.5 ml was accurately transferred into 25 ml volumetric flask and made up to the mark with solvent to achieve a final concentration of 10 µg/ml. The absorbance of this final solution was measured at the analytical wavelength 240 nm. The above procedure was repeated for two more brands. The results are shown in table 7.9
Table 7.9: Result of the estimation of Rosuvastatin Calcium in tablet formulations –
|
Brand |
Label claim (mg) |
Theoretical conc. |
Calculated conc. |
Difference (mg) |
Amount Found |
%Assay |
Mean % Assay ± SD |
% RSD |
|
Crestor (AstraZeneca) |
10 |
10 |
10.03 |
0.03 |
10.03 |
100.30 |
100.37±0.115 |
0.115 |
|
10.05 |
0.05 |
10.05 |
100.50 |
|||||
|
10.03 |
0.03 |
10.03 |
100.30 |
|||||
|
Rosuvas (Sunpharma) |
10 |
10 |
9.96 |
-0.04 |
9.96 |
99.60 |
99.67±0.058 |
0.058 |
|
9.97 |
-0.03 |
9.97 |
99.70 |
|||||
|
9.97 |
-0.03 |
9.97 |
99.70 |
|||||
|
Razel (Glenmark) |
10 |
10 |
10.11 |
0.11 |
10.11 |
101.10 |
101.20±0.100 |
0.099 |
|
10.12 |
0.12 |
10.12 |
101.20 |
|||||
|
10.13 |
0.13 |
10.13 |
101.30 |
CONCLUSION
According to ICH criteria, the developed techniques for the medication Rosuvastatin Calcium were validated and had perfect sensitivity, adequate linearity, and accuracy. The percentage RSD was less than 2.0% in both intra-day and inter-day accuracy studies, suggesting excellent precision and repeatability. Therefore, it is possible to regularly evaluate Rosuvastatin Calcium in pharmaceutical dose forms and in bulk using the suggested method. Accuracy studies that confirmed findings within the expected range were used to validate the accuracy of the suggested procedure. Rosuvastatin calcium assay percentages for three different pill brands were determined to be 100.37%, 99.67%, and 101.20%.
REFERENCES


Ajay Singh Bisht, Prabhjot Singh, Development And Validation of a Uv Spectrophotometric Method for Rosuvastatin Calcium Using an Optimized Solvent System, Int. J. of Pharm. Sci., 2026, Vol 4, Issue 7, 2151-2161, https://doi.org/10.5281/zenodo.21294777
 10.5281/zenodo.21294777