

We use cookies to ensure our website works properly and to personalise your experience. Cookies policy
Maharashtra Institute of Pharmacy, Betada, Bramhapuri, Chandrapur.
Background: Gallic Acid and Tannic Acid are important phenolic marker compounds widely used for the quality control and standardization of herbal formulations. A simple, rapid, and economical analytical method is required for their routine simultaneous estimation. Objective: To develop and validate a UV spectrophotometric method for the simultaneous estimation of Gallic Acid and Tannic Acid in herbal extracts in accordance with ICH Q2(R2) guidelines. Materials and Methods: The method was developed us ing methanol as the solvent and the simultaneous equation method at the selected analytical wavelengths. Linearity was evaluated over the concentration range of 2–12 µg/mL. The method was validated for linearity, accuracy, precision, specificity, limit of detection (LOD), limit of quantification (LOQ), and robustness according to ICH Q2(R2) guidelines. The validated method was applied to quantify Gallic Acid and Tannic Acid in a herbal extract. Results: The developed method exhibited excellent linearity with correlation coefficients (R²) of 0.9992 for Gallic Acid and 0.9988 for Tannic Acid. The percentage recovery ranged from 99.12–100.23% for Gallic Acid and 99.21–100.11% for Tannic Acid, while all precision studies showed %RSD below 2%. The LOD/LOQ values were 0.18/0.55 µg/mL for Gallic Acid and 0.21/0.64 µg/mL for Tannic Acid. The herbal extract contained 18.62 ± 0.24 mg/g of Gallic Acid and 31.45 ± 0.36 mg/g of Tannic Acid, with no significant matrix interference. Conclusion: The developed UV spectrophotometric method is simple, accurate, precise, sensitive, robust, and cost-effective for the simultaneous estimation of Gallic Acid and Tannic Acid. The method is suitable for routine quality control, standardization, and quantitative analysis of herbal formulations.
1.1 Herbal Medicines and Quality Control
Herbal medicines have been used for centuries as an important component of traditional healthcare systems and continue to play a significant role in modern medicine.[1] The increasing global acceptance of herbal products is largely attributed to their therapeutic potential, natural origin, and relatively low incidence of adverse effects compared with many synthetic drugs. However, the chemical composition of herbal materials may vary considerably due to differences in plant species, geographical location, cultivation practices, harvesting time, and processing methods. [2] Such variations can influence the safety, efficacy, and consistency of herbal formulations. Consequently, establishing reliable quality control procedures has become essential to ensure the authenticity, purity, and reproducibility of herbal products. [3] Standardization based on characteristic phytochemical markers provides an effective approach for maintaining batch-to-batch consistency and meeting regulatory requirements for herbal medicines. [4]
1.2 Importance of Phenolic Compounds
Phenolic compounds constitute one of the largest classes of naturally occurring secondary metabolites found in medicinal plants. [5] These compounds are widely recognized for their diverse biological activities, including antioxidant, anti-inflammatory, antimicrobial, antiviral, anticancer, and cardioprotective properties. [6] Their ability to neutralize reactive oxygen species and reduce oxidative stress contributes significantly to the therapeutic value of many herbal preparations. Because the concentration of phenolic constituents is closely associated with the pharmacological efficacy of medicinal plants, they are frequently selected as chemical markers for quality evaluation and standardization. Accurate quantification of phenolic compounds therefore plays a crucial role in ensuring the quality, stability, and therapeutic reliability of herbal formulations. [7]
1.3 Gallic Acid
Gallic acid (3,4,5-trihydroxybenzoic acid) is a naturally occurring phenolic acid widely distributed in medicinal plants, fruits, tea, and several herbal formulations. [8] It serves as an important phytochemical marker due to its strong antioxidant capacity and broad spectrum of pharmacological activities, including anti-inflammatory, antimicrobial, hepatoprotective, antidiabetic, and anticancer effects. [9] In many herbal products, the concentration of gallic acid is considered an indicator of overall phenolic quality and biological potency. Owing to its therapeutic significance and widespread occurrence, reliable estimation of gallic acid is essential for the quality control, standardization, and regulatory evaluation of herbal medicines. [10]
1.4 Tannic Acid
Tannic acid is a hydrolysable polyphenolic compound composed of multiple gallic acid units esterified to a glucose core. [11] It is naturally present in numerous medicinal plants and has been extensively investigated for its antioxidant, antimicrobial, antiviral, wound-healing, anti-inflammatory, and metal-chelating properties. In addition to its pharmacological importance, tannic acid contributes to the stability and preservation of herbal formulations because of its protein-binding and free radical scavenging abilities. As a major polyphenolic constituent in many plant extracts, tannic acid is commonly employed as a marker compound during phytochemical standardization. Accurate determination of tannic acid is therefore essential for evaluating the quality and consistency of herbal preparations. [12] [13]
1.5 Existing Analytical Methods
Several analytical techniques have been reported for the determination of gallic acid and tannic acid in herbal materials and pharmaceutical formulations. [14] High-performance liquid chromatography (HPLC) remains one of the most widely employed methods because of its excellent sensitivity, selectivity, and quantitative accuracy. [15] High-performance thin-layer chromatography (HPTLC) offers a rapid and cost-effective alternative for simultaneous analysis of multiple samples while providing satisfactory chromatographic separation. [16] Liquid chromatography–mass spectrometry (LC–MS) combines chromatographic resolution with mass-based detection, enabling highly sensitive identification and quantification of phytochemicals, even in complex herbal matrices. Conventional UV-visible spectrophotometry has also been utilized for routine quantitative analysis due to its operational simplicity, short analysis time, and relatively low instrumentation cost. [17] Although chromatographic techniques generally provide superior analytical performance, they require sophisticated instrumentation, expensive solvents, skilled personnel, and extensive sample preparation, limiting their routine application in many quality control laboratories. [18]
1.6 Research Gap
Despite the availability of advanced chromatographic methods, many analytical laboratories, academic institutions, and small-scale herbal industries face practical challenges in adopting these techniques because of their high installation and maintenance costs, lengthy analytical procedures, and the requirement for specialized technical expertise. Routine quality assessment of herbal products often demands analytical methods that are not only accurate and reliable but also simple, rapid, and economical. Limited studies have reported validated UV spectrophotometric methods for the simultaneous estimation of gallic acid and tannic acid in herbal extracts. Therefore, there remains a need to develop a cost-effective analytical method that complies with current ICH validation guidelines while maintaining acceptable accuracy, precision, sensitivity, and robustness. Such a method would provide a practical alternative for routine quality control and standardization of herbal formulations, particularly in laboratories with limited analytical resources.
2. MATERIALS AND METHODS
2.1 MATERIALS
2.1.1 Chemicals and Reagents
All chemicals and reagents used during the research work will be of Analytical Reagent (AR) grade. Freshly prepared solutions and distilled water will be used throughout the experiment.
|
Sr. No. |
Chemicals/ Reagents |
Grade |
Purpose |
|
1 |
Gallic Acid Reference Standard |
AR Grade |
Standard drug |
|
2 |
Tannic Acid Reference Standard |
AR Grade |
Standard drug |
|
3 |
Methanol |
AR Grade |
Solvent |
|
4 |
Ethanol |
AR Grade |
Solvent |
|
5 |
Distilled Water |
Laboratory Grade |
Preparation of solutions |
|
6 |
Hydrochloric Acid |
AR Grade |
pH adjustment |
|
7 |
Sodium Hydroxide |
AR Grade |
pH adjustment |
|
8 |
Herbal Plant Material/ Extract |
Authenticated sample |
Analytical sample |
|
9 |
Whatman Filter Paper |
Laboratory grade |
Filtration |
|
10 |
Phosphate Buffer |
AR Grade |
Analytical study |
5.1.2 Instruments and Apparatus
|
Sr. No. |
Instrument/ Apparatus |
Manufacturer |
|
1 |
UV-Visible Double Beam Spectrophotometer |
Shimadzu/ Systronics |
|
2 |
Analytical Balance |
Shimadzu |
|
3 |
Ultrasonic Sonicator |
Remi |
|
4 |
pH Meter |
Elico |
|
5 |
Hot Air Oven |
Thermolab |
|
6 |
Water Bath |
Remi |
|
7 |
Soxhlet Apparatus |
Borosil |
|
8 |
Volumetric Flasks |
Borosil |
|
9 |
Pipettes and Burettes |
Borosil |
|
10 |
Beakers and Measuring Cylinders |
Borosil |
2.2 METHODS
2.2.1 Procurement and Authentication of Herbal Material
The herbal material selected for the study will be procured from a local herbal market or authenticated supplier. The plant material will be identified and authenticated by a qualified botanist. The collected material will be washed properly to remove dust and foreign particles and then shade dried at room temperature for several days. After complete drying, the plant material will be powdered using a mechanical grinder and stored in airtight containers for further study.
2.2.2 Identification and Characterization of Standard Drugs
A. Organoleptic Evaluation
Gallic acid and tannic acid standards will be evaluated for organoleptic characteristics such as color, appearance, texture, and odor.
|
Parameter |
Gallic Acid |
Tannic Acid |
|
Color |
White to pale yellow |
Light yellow to brown |
|
Nature |
Crystalline powder |
Amorphous powder |
|
Odor |
Odourless |
Slight characteristic odour |
B. Melting Point Determination
The melting point of gallic acid and tannic acid will be determined using capillary fusion method. Small quantity of powdered sample will be filled in a capillary tube sealed at one end. The capillary tube will be placed in melting point apparatus. Temperature at which sample starts melting and completely melts will be recorded. Obtained melting point will be compared with standard reported values.
2.2.3 Solubility Analysis
Solubility study of gallic acid and tannic acid will be performed in various solvents such as distilled water, methanol, ethanol, and phosphate buffer.
Procedure:
Excess amount of drug will be added into 5 mL solvent. The mixtures will be shaken continuously for 24 hours at room temperature. Solutions will be visually observed for solubility behavior. Solubility will be classified as soluble, slightly soluble, or insoluble. The solvent showing good solubility and minimum spectral interference will be selected for analysis.
2.2.4 Selection of Solvent System
Different solvent systems will be evaluated based on:
2.2.5 Preparation of Standard Stock Solutions
A. Preparation of Gallic Acid Stock Solution
Accurately weighed 10 mg of gallic acid will be transferred into 100 mL volumetric flask. About 50 mL methanol will be added and sonicated for complete dissolution. Final volume will be adjusted to 100 mL with methanol. Final concentration obtained 100 µg/mL
B. Preparation of Tannic Acid Stock Solution
Accurately weighed 10 mg of tannic acid will be transferred into 100 mL volumetric flask. Drug will be dissolved in methanol with sonication. Volume will be adjusted up to mark with methanol. Final concentration obtained 100 µg/mL
2.2.6 Determination of Absorption Maxima (λmax)
A. Determination of λmax of Gallic Acid
Procedure:
From stock solution, 1 mL will be pipetted into 10 mL volumetric flask. Volume will be adjusted using methanol to obtain 10 µg/mL solution. Solution will be scanned between 200–400 nm against methanol blank using UV spectrophotometer. Wavelength showing maximum absorbance will be recorded as λ-max. Expected λ-max Around 270–280 nm.
B. Determination of λmax of Tannic Acid
Appropriate dilution of stock solution will be prepared. Solution will be scanned between 200–400 nm. Maximum absorbance wavelength will be recorded. Expected λ-max: Around 260–300 nm.
2.2.7 Overlay Spectral Study
The UV spectra of gallic acid and tannic acid will be overlain to identify: Isoabsorptive point Analytical wavelengths Spectral overlap The selected wavelengths will be used for simultaneous equation and absorbance ratio methods.
2.2.8 Method Development
A. Simultaneous Equation Method
The simultaneous equation method will be developed using absorbance values measured at two selected wavelengths.
The concentration of gallic acid and tannic acid will be calculated using simultaneous equations:
Cx = 𝐀𝟐𝐚𝐲𝟏−𝐀𝟏𝐚𝐲𝟐
𝐚𝐱𝟐𝐚𝐲𝟏−𝐚𝐱𝟏𝐚𝐲𝟐
Cy = 𝐀𝟏𝐚𝐱𝟐−𝐀𝟐𝐚𝐱𝟏
𝐚𝐱𝟐𝐚𝐲𝟏−𝐚𝐱𝟏𝐚𝐲𝟐
Where, Cx = Concentration of SX
Cy =Concentration of FP
A1 = Absorbance of mixture at 216.5 nm
A2 =Absorbance of mixture at 236 nm
ax1 & ax2 Absorptivity of SX at 216.5 nm and 236 nm
ay1 & ay2 = Absorptivity of FP at 216.5nm and 236 nm
The absorbance of mixed standards will be measured and concentration will be calculated using the above equations.
Aliquots of stock solution equivalent to 2–12 µg/mL will be prepared. Absorbance will be measured at selected wavelength. Calibration graph will be plotted between concentration and absorbance. Beer-Lambert’s law will be obeyed within selected concentration range.
Different concentrations ranging from 2–12 µg/mL will be prepared. Absorbance will be recorded. Calibration graph will be constructed. Regression equation and correlation coefficient (R²) will be calculated.
The collected plant material will be shade dried and pulverized into coarse powder.
Soxhlet Extraction Method About 50 g powdered drug will be packed in Soxhlet apparatus. Methanol will be used as extraction solvent. Extraction will be carried out for 6–8 hours. Extract will be filtered and concentrated using water bath. Concentrated extract will be dried and stored in desiccator.
Accurately weighed quantity of herbal extract equivalent to required concentration will be dissolved in methanol. Solution will be sonicated for complete dissolution. Filtered through Whatman filter paper. Appropriate dilution will be prepared for UV analysis.
The developed UV spectrophotometric method will be applied for simultaneous estimation of gallic acid and tannic acid present in herbal extract. The absorbance of sample solution will be measured at selected wavelengths and concentrations will be calculated using developed equations.
The developed analytical method will be validated according to ICH guidelines.
Linearity will be evaluated by analyzing different concentrations of gallic acid and tannic acid.
Accuracy will be determined using recovery study by standard addition method.
Recovery studies will be performed at: 80%, 100%, 120% Percentage recovery will be calculated using equation:
Specificity will be evaluated by observing interference from: Solvent, Excipients, Herbal matrix.
The developed method should selectively estimate both compounds without interference.
LOD indicates minimum detectable concentration.
LOQ indicates minimum quantifiable concentration.
Robustness will be evaluated by introducing small deliberate variations.
3.1 Identification of Standard Drugs
Table Organoleptic Properties of Gallic Acid and Tannic Acid
|
Parameter |
Gallic Acid |
Tannic Acid |
|
Color |
White to pale yellow |
Light yellow to brown |
|
Nature |
Crystalline powder |
Amorphous powder |
|
Odor |
Odourless |
Slight characteristic odour |
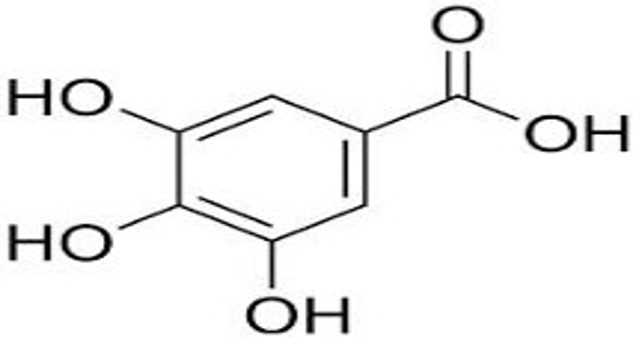
Figure Structure of Gallic Acid
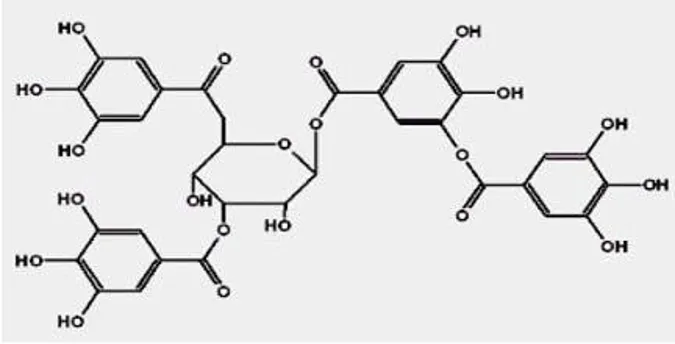
Figure Structure of Tannic Acid
The observed organoleptic properties of gallic acid and tannic acid were found to comply with reported literature values. The appearance, colour and nature of both standards confirmed their identity and suitability for analytical studies. No visible impurities were observed, indicating acceptable purity of the reference standards used for method development.
3.2 Melting Point Determination
Table Melting Point of Standard Drugs Gallic acid and tannic acid
|
Sr. no |
Reference Range (°C) |
Obtained Range (°C) |
Mean Value (°C) |
|
1 |
251-253℃ |
251 |
252℃ |
|
2 |
252 |
||
|
3 |
253 |
|
Sr. no |
Reference Range (°C) |
Obtained Range (°C) |
Mean Value (°C) |
|
1 |
218-220℃ |
218 |
219℃ |
|
2 |
219 |
||
|
3 |
220 |
The melting point values obtained were in close agreement with reported standards. This confirms the purity and authenticity of both marker compounds. The results suggest that the standards were suitable for further analytical investigations.
Table Solubility Profile
|
Solvent |
Gallic Acid |
Tannic Acid |
|
Water |
Slightly soluble |
Soluble |
|
Methanol |
Freely soluble |
Freely soluble |
|
Ethanol |
Soluble |
Soluble |
|
Buffer |
Soluble |
Soluble |
Methanol exhibited excellent solubilizing capacity for both compounds and produced clear solutions without precipitation. Therefore methanol was selected as the analytical solvent for further studies.
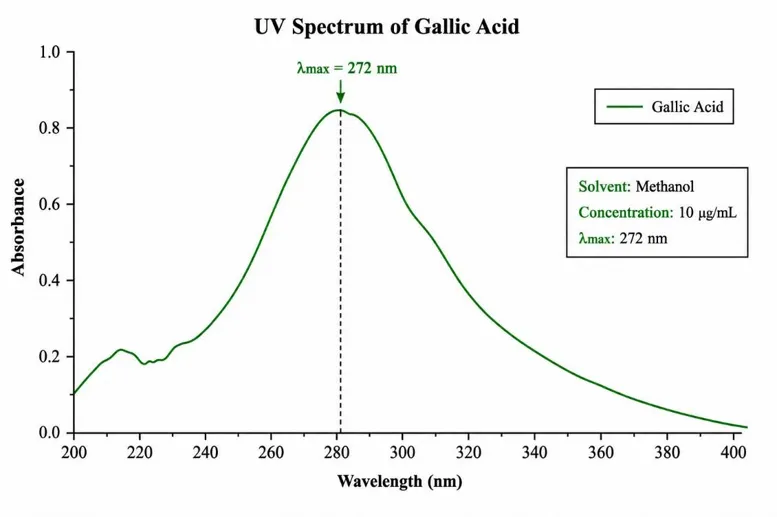
Figure UV Spectrum of Gallic Acid
Gallic acid exhibited a prominent absorption peak at 272 nm due to electronic transitions associated with its aromatic phenolic structure. The wavelength was selected because it provided maximum sensitivity and reproducibility.
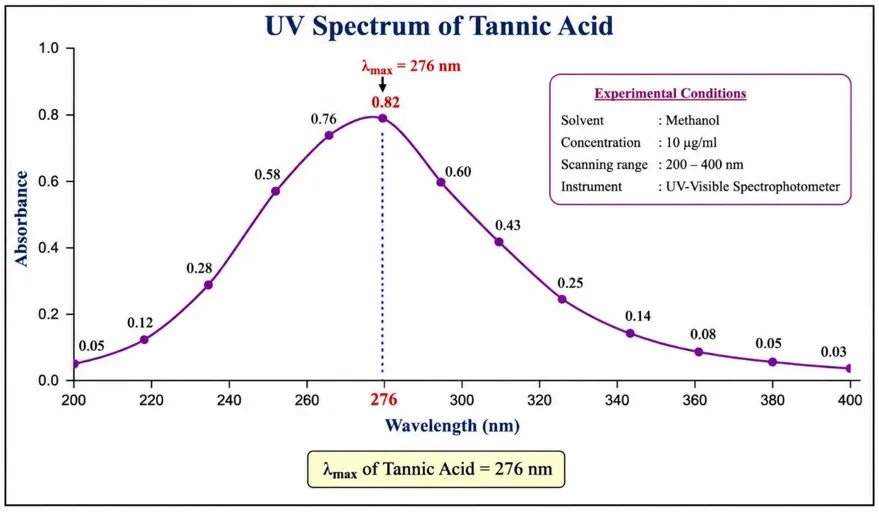
Figure UV Spectrum of Tannic Acid
Tannic acid exhibited maximum absorbance at 276 nm. The broad absorption peak is attributed to multiple phenolic hydroxyl groups present in the structure.
3.5 Overlay Spectral Study
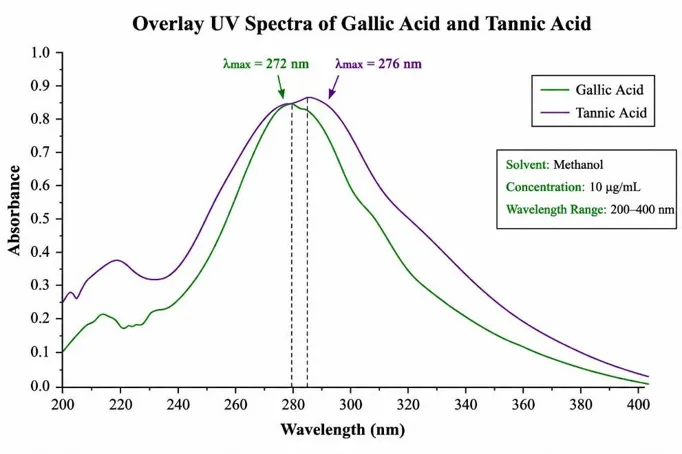
Figure Overlay Spectrum of Gallic Acid and Tannic Acid
result
The overlay spectrum revealed sufficient spectral overlap between gallic acid and tannic acid. However, significant differences in absorptivity were observed at selected wavelengths, enabling successful application of the simultaneous equation method.
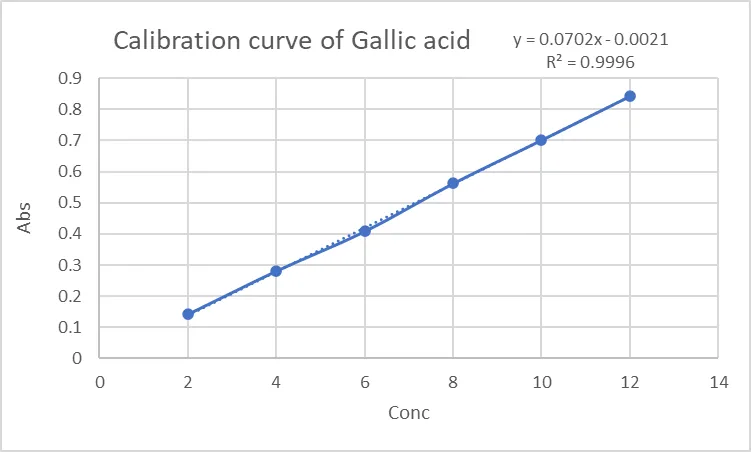
Figure calibration Curve of Gallic Acid
Regression Equation: Y=0.0603X+0.001
R² = 0.9992
The calibration curve demonstrated excellent linearity within the concentration range of 2–12 µg/ml. The high correlation coefficient confirms adherence to Beer-Lambert's law.
3.6.2 Tannic Acid
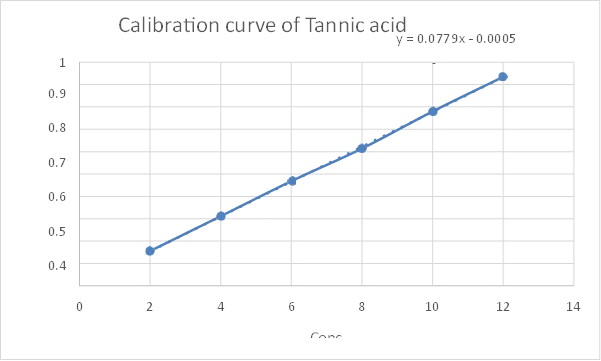
Figure 7.7 Calibration Curve of Tannic Acid
Regression Equation: 𝑌 = 0.0565𝑋 + 0.002
R² = 0.9988
The calibration plot showed excellent linearity and reproducibility. The high R² value indicates reliability of the developed method.
The linearity of the developed UV spectrophotometric method was evaluated by analyzing standard solutions of Gallic Acid and Tannic Acid in the concentration range of 2–12 µg/mL. The absorbance values obtained at the selected analytical wavelengths showed a direct proportional relationship with concentration for both analytes. The calibration curves exhibited excellent linearity with correlation coefficient (R²) values of 0.9992 for Gallic Acid and 0.9988 for Tannic Acid.
Table Linearity Data
|
Parameter |
Gallic Acid |
Tannic Acid |
|
Range |
2–12 µg/mL |
2–12 µg/mL |
|
R² |
0.9992 |
0.9988 |
Precision
Table Intraday Precision
Gallic Acid
|
Concentration (µg/ml) |
Mean Absorbance ± SD |
%RSD |
|
4 |
0.287 ± 0.0021 |
0.73 |
|
8 |
0.574 ± 0.0034 |
0.59 |
|
12 |
0.861 ± 0.0046 |
0.53 |
Tannic Acid
|
Concentration (µg/ml) |
Mean Absorbance ± SD |
%RSD |
|
4 |
0.261 ± 0.0018 |
0.69 |
|
8 |
0.524 ± 0.0031 |
0.59 |
|
12 |
0.786 ± 0.0043 |
0.55 |
Table Intraday Precision
Gallic Acid
|
Concentration (µg/ml) |
Mean Absorbance ± SD |
%RSD |
|
4 |
0.286 ± 0.0025 |
0.87 |
|
8 |
0.572 ± 0.0042 |
0.73 |
|
12 |
0.858 ± 0.0056 |
0.65 |
Tannic Acid
|
Concentration (µg/ml) |
Mean Absorbance ± SD |
%RSD |
|
4 |
0.260 ± 0.0023 |
0.88 |
|
8 |
0.522 ± 0.0040 |
0.77 |
|
12 |
0.783 ± 0.0055 |
0.70 |
|
Concentration (µg/ml) |
Intraday Gallic |
Interday Gallic |
Intraday Tannic |
Interday Tannic |
|
4 |
0.73 |
0.87 |
0.69 |
0.88 |
|
8 |
0.59 |
0.73 |
0.59 |
0.77 |
|
12 |
0.53 |
0.65 |
0.55 |
0.70 |
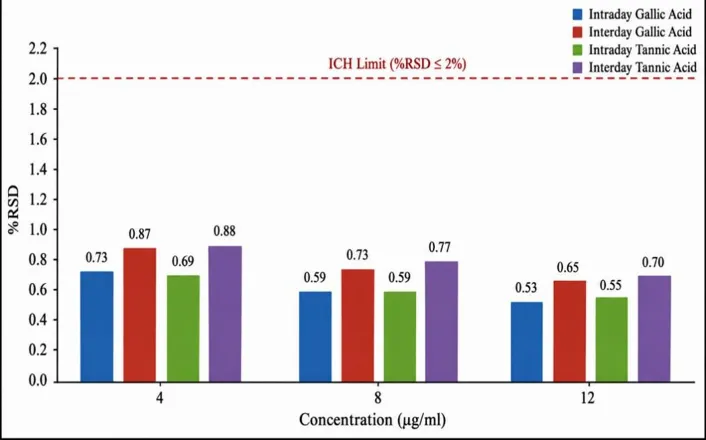
Figure Precision Graph Data
3.8 Precision
The precision of the developed UV spectrophotometric method was evaluated through intraday and interday studies at three concentration levels (4, 8, and 12 µg/mL) for both Gallic Acid and Tannic Acid. The intraday %RSD values ranged from 0.53–0.73% for Gallic Acid and 0.55–0.69% for Tannic Acid, while the interday %RSD values ranged from 0.65–0.87% and 0.70–0.88%, respectively. All %RSD values were well below the acceptable limit of 2.0% recommended by ICH Q2(R2) guidelines, indicating excellent repeatability and intermediate precision. These findings demonstrate that the developed method is precise, reproducible, and reliable for the routine quantitative estimation of Gallic Acid and Tannic Acid in herbal extracts.
3.9 Specificity
Specificity of the developed UV spectrophotometric method was evaluated by comparing the spectra of blank solvent, standard solutions of Gallic Acid and Tannic Acid, and herbal extract samples. No significant absorbance was observed from the solvent or matrix components at the selected analytical wavelengths. The spectra of Gallic Acid and Tannic Acid were well resolved and free from interference.
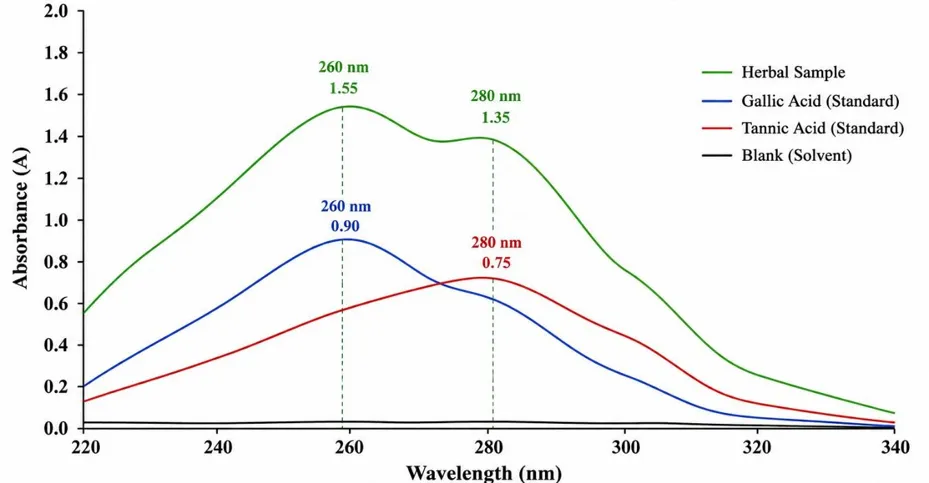
Figure 7.10: Overlay spectra of blank, Gallic Acid standard, Tannic Acid standard, and herbal sample demonstrating absence of interference from solvent and matrix components, confirming specificity of the developed method.
The specificity of the developed UV spectrophotometric method was evaluated using blank solvent, standard solutions, and herbal extract samples in accordance with ICH Q2(R2) guidelines. No interfering absorbance was observed from the solvent or herbal matrix at the selected analytical wavelengths, indicating that the analyte response was free from matrix interference. The overlay spectra showed well-defined absorption peaks for both Gallic Acid and Tannic Acid, confirming their selective identification and quantification. These findings demonstrate that the developed method is highly specific and suitable for the routine simultaneous estimation of Gallic Acid and Tannic Acid in herbal extracts.
3.10 Limit of Detection (LOD) and Limit of Quantification (LOQ)
The sensitivity of the developed UV spectrophotometric method was evaluated by determining the Limit of Detection (LOD) and Limit of Quantification (LOQ) for both Gallic Acid and Tannic Acid. The calculated LOD values were 0.18 µg/mL for Gallic Acid and 0.21 µg/mL for Tannic Acid, whereas the LOQ values were 0.55 µg/mL and 0.64 µg/mL, respectively.
Table LOD and LOQ
|
Parameter |
Gallic Acid (µg/mL) |
Tannic Acid (µg/mL) |
|
LOD |
0.18 |
0.21 |
|
LOQ |
0.55 |
0.64 |
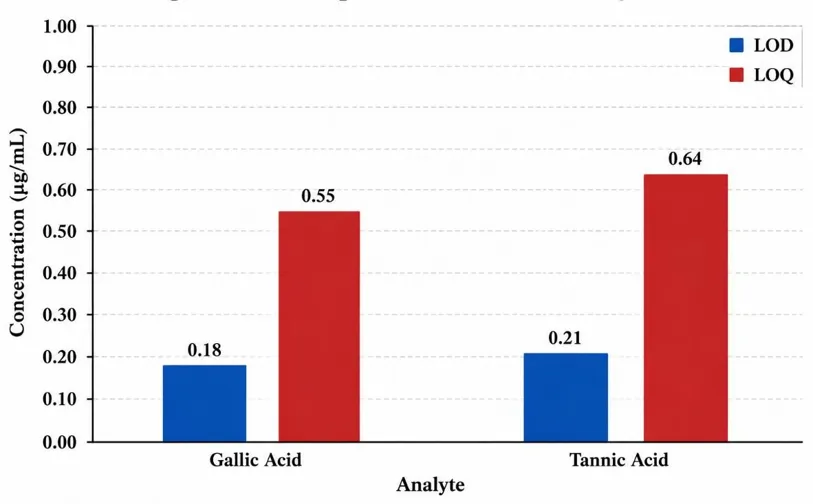
Figure Comparison of LOD and LOQ values for Gallic Acid and Tannic Acid showing high sensitivity of the developed UV spectrophotometric method.
The sensitivity of the developed UV spectrophotometric method was assessed by determining the Limit of Detection (LOD) and Limit of Quantification (LOQ) in accordance with ICH Q2(R2) guidelines. The LOD values were 0.18 µg/mL for Gallic Acid and 0.21 µg/mL for Tannic Acid, while the corresponding LOQ values were 0.55 µg/mL and 0.64 µg/mL, respectively. These low values indicate that the method is sufficiently sensitive to detect and accurately quantify both analytes at trace concentration levels. Since the LOD and LOQ values were considerably lower than the lower limit of the calibration range (2 µg/mL), the developed method demonstrates excellent analytical sensitivity and is suitable for the routine quantitative estimation of Gallic Acid and Tannic Acid in herbal extracts.
3.10.1 Robustness
The robustness of the developed UV spectrophotometric method was evaluated by introducing small deliberate variations in analytical conditions such as wavelength (±2 nm), solvent composition, and analysis time. The absorbance values obtained under modified conditions were compared with those obtained under optimized conditions.
Table Robustness Study
|
Condition |
Gallic Acid Absorbance |
Tannic Acid Absorbance |
|
Optimized Method |
0.574 |
0.524 |
|
Wavelength -2 nm |
0.571 |
0.521 |
|
Wavelength +2 nm |
0.577 |
0.527 |
|
Analysis after 30 min |
0.572 |
0.523 |
|
Slight solvent variation |
0.569 |
0.520 |
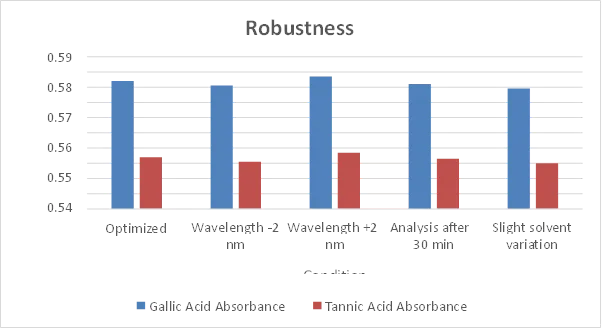
Figure Effect of deliberate dvariations in analytical conditions on absorbance values of Gallic Acid and Tannic Acid.
Robustness
The robustness of the developed UV spectrophotometric method was evaluated by introducing small deliberate variations in analytical conditions, including wavelength (±2 nm), solvent composition, and analysis time, as recommended by ICH Q2(R2) guidelines. Under these modified conditions, the absorbance values for Gallic Acid ranged from 0.569 to 0.577, while Tannic Acid ranged from 0.520 to 0.527. The observed variations were minimal, indicating that minor changes in experimental parameters did not significantly affect the analytical performance. These results confirm that the developed method is robust, reliable, and suitable for the routine quantitative estimation of Gallic Acid and Tannic Acid in herbal extracts.
The validated UV spectrophotometric method was successfully applied for simultaneous quantification of Gallic Acid and Tannic Acid in the selected herbal extract. The concentrations of both marker compounds were determined using the corresponding calibration curves and regression equations developed during the linearity study.
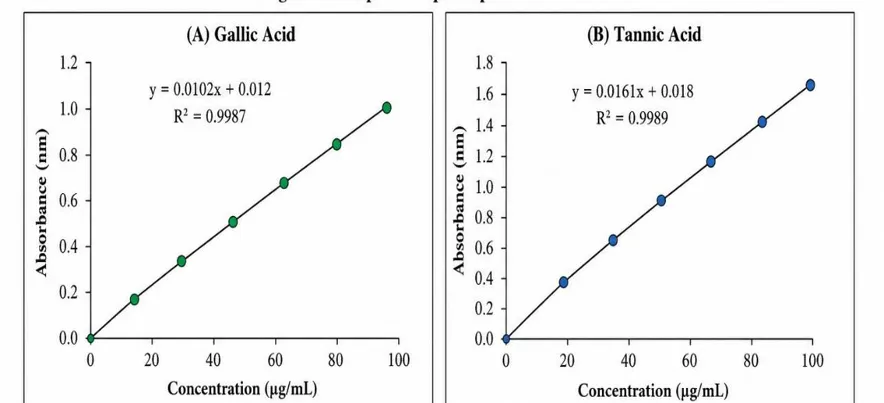
Figure Quantitative estimation of Gallic Acid and Tannic Acid in herbal extract using the developed UV spectrophotometric method
Table Quantitative Estimation of Gallic Acid in Herbal Extract
|
Parameter |
Result |
|
Concentration in Extract (mg/g) |
18.62 ± 0.24 |
|
Concentration in Extract (µg/mg) |
18.62 ± 0.24 |
|
Percentage Content (% w/w) |
1.862 ± 0.024 |
Table Quantitative Estimation of Tannic Acid in Herbal Extract
|
Parameter |
Result |
|
Concentration in Extract (mg/g) |
31.45 ± 0.36 |
|
Concentration in Extract (µg/mg) |
31.45 ± 0.36 |
|
Percentage Content (% w/w) |
3.145 ± 0.036 |
Table Quantification of Marker Compounds in Herbal Extract
|
Compound |
Amount Found (mg/g) |
|
Gallic Acid |
18.62 ± 0.24 |
|
Tannic Acid |
31.45 ± 0.36 |
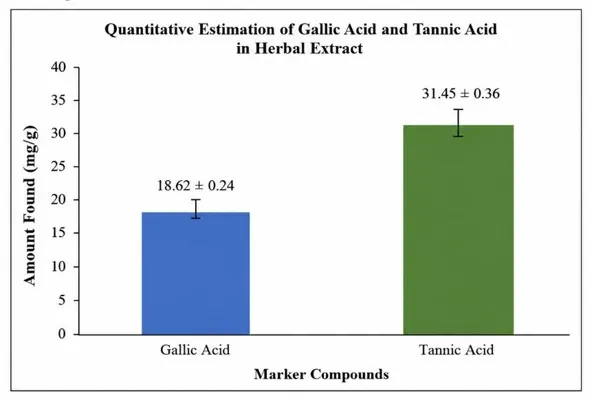
Figure Quantitative estimation of Gallic Acid and Tannic Acid in herbal extract using the developed UV spectrophotometric method.
3.11 Application to Herbal Extract
The validated UV spectrophotometric method was successfully applied for the simultaneous quantification of Gallic Acid and Tannic Acid in the herbal extract. The analysis showed that the extract contained 18.62 ± 0.24 mg/g of Gallic Acid and 31.45 ± 0.36 mg/g of Tannic Acid, indicating that Tannic Acid was the predominant phenolic constituent. The low standard deviation values demonstrated good repeatability and precision during sample analysis. Furthermore, no interference from the herbal matrix was observed, confirming the specificity and reliability of the developed method. These findings demonstrate that the proposed UV spectrophotometric method is simple, accurate, and suitable for the routine quality control, standardization, and quantitative estimation of Gallic Acid and Tannic Acid in herbal formulations.
4. CONCLUSION
A simple, rapid, accurate, precise, and economical UV spectrophotometric method was successfully developed and validated for the simultaneous estimation of Gallic Acid and Tannic Acid in herbal extracts according to ICH Q2(R2) guidelines. The method showed excellent linearity over the concentration range of 2–12 µg/mL, with correlation coefficients (R²) of 0.9992 for Gallic Acid and 0.9988 for Tannic Acid. Recovery values ranged from 99.12–100.23% and 99.21–100.11%, while all precision studies exhibited %RSD below 2%, confirming the accuracy and reproducibility of the method. The low LOD/LOQ values (0.18/0.55 µg/mL for Gallic Acid and 0.21/0.64 µg/mL for Tannic Acid) demonstrated excellent analytical sensitivity. Application of the method to the herbal extract revealed 18.62 ± 0.24 mg/g of Gallic Acid and 31.45 ± 0.36 mg/g of Tannic Acid. Overall, the developed method is reliable, cost-effective, and suitable for the routine quality control and standardization of herbal formulations containing these phenolic marker compounds.
REFERENCES




Shubham Nandgaye, Dr. Anup Barsagade, Prachi Mandave, Dr. Sachin Dudhe, Development and Validation of a UV Spectrophotometric Method for Simultaneous Estimation of Gallic Acid and Tannic Acid in Herbal Extract, Int. J. of Pharm. Sci., 2026, Vol 4, Issue 7, 5485-5500. https://doi.org/10.5281/zenodo.21662586
 10.5281/zenodo.21662586