

We use cookies to ensure our website works properly and to personalise your experience. Cookies policy
IPS Academy College of Pharmacy, Indore M.P.; India.
Background: Notonia grandiflora DC. (Accepted name Kleinia grandiflora (DC.) N.Rani; Asteraceae) is a succulent, fleshy under-shrub used in folk medicine and reported to contain flavonoid glycosides and triterpenoids, but its in-vitro antioxidant potential remains poorly characterised. Objective: To extract the leaves and stem of N. grandiflora with ethanol and ethyl acetate, to screen the extracts for major phytochemical classes, and to evaluate their free-radical-scavenging activity by the DPPH assay relative to ascorbic acid. Methods: Shade-dried, powdered leaves and stem (50 g each) were extracted separately with ethanol and ethyl acetate (1:5 w/v) using a Soxhlet apparatus for ~8 h. Extracts were screened qualitatively for alkaloids, flavonoids, phenolics, tannins, saponins, glycosides, terpenoids and steroids. DPPH radical-scavenging activity was measured at 20-100 µg/mL (517 nm, triplicate) and IC?? values were derived from linear concentration-response regression; group differences were examined by one-way and two-way ANOVA with Holm-adjusted pairwise t-tests. Results: The leaf-ethanol extract gave the highest yield (10.4%, 5.20 g/50 g) and showed a concentration-dependent DPPH response (39.56% to 79.38% inhibition over 20-100 µg/mL; IC?? = 42.35 µg/mL; R² = 0.9947) against an ascorbic-acid reference IC?? of 30.81 µg/mL. Qualitative screening indicated a broad phytochemical profile dominated by phenolics, flavonoids and tannins. Illustrative comparative extensions (leaf-ethyl acetate, stem-ethanol and stem-ethyl acetate) followed the same concentration-dependent pattern, with two-way ANOVA showing significant main effects of treatment (F = 9.27, p = 1.11 × 10??) and concentration (F = 140.75, p = 1.47 × 10?²?) but a non-significant treatment × concentration interaction; Holm-adjusted pairwise comparisons against ascorbic acid were not significant at ? = 0.05. Conclusion: N. grandiflora leaf extracts, in particular the ethanolic preparation, show appreciable in-vitro free-radical-scavenging activity consistent with their phenolic and flavonoid content, supporting further quantitative and in-vivo evaluation of this under-studied species.
1.1 Antioxidants, Free Radicals and Oxidative Stress
Reactive oxygen and nitrogen species (ROS/RNS) are generated continuously during normal aerobic metabolism and by exogenous factors such as pollution, radiation, smoking and inflammation. When the rate of generation of these reactive species exceeds the scavenging capacity of endogenous and dietary antioxidant defences, a state of oxidative stress results, characterised by oxidative damage to lipids, proteins and nucleic acids. Sustained oxidative stress is mechanistically implicated in ageing and in the pathogenesis of a wide range of chronic diseases, including atherosclerosis, diabetes mellitus, neurodegenerative disorders and several cancers.
Antioxidants are compounds that, even at low concentration relative to an oxidisable substrate, significantly delay or prevent oxidation of that substrate. They act through several complementary mechanisms: direct radical scavenging via hydrogen-atom or single-electron transfer, chelation of pro-oxidant transition metal ions, quenching of singlet oxygen, and up-regulation of endogenous antioxidant enzyme systems such as superoxide dismutase, catalase and glutathione peroxidase.
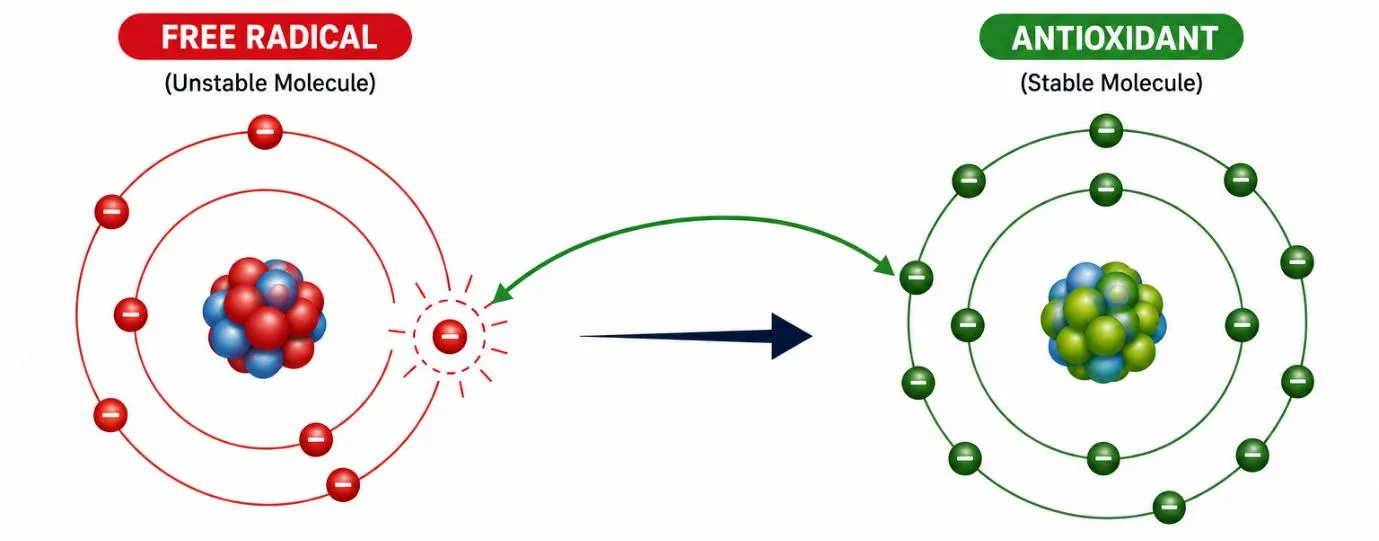
Figure 1. Schematic representation of radical stabilisation by an antioxidant through electron/hydrogen transfer.
1.2 Classification of Antioxidants and Role of Plant Phenolics
Antioxidants are broadly classified as enzymatic (superoxide dismutase, catalase, glutathione peroxidase) and non-enzymatic (vitamin C, vitamin E, carotenoids, glutathione and plant polyphenols). Among dietary and phytochemical antioxidants, phenolic compounds - including flavonoids, phenolic acids and tannins - are of particular interest because their multiple hydroxyl groups allow efficient hydrogen-atom donation and stabilisation of the resulting phenoxyl radical by resonance delocalisation over the aromatic ring. Flavonoids additionally chelate redox-active transition metals such as Fe²⁺ and Cu⁺, suppressing metal-catalysed radical generation via Fenton-type chemistry.
Because a single chemical assay cannot fully capture the diversity of antioxidant mechanisms, plant extracts are conventionally screened using one or more model radical/oxidant systems - DPPH, ABTS, nitric oxide, superoxide, hydrogen peroxide and the ferric-reducing antioxidant power (FRAP) assay - each probing a different aspect of radical-scavenging or reducing capacity. Among these, the DPPH (2,2-diphenyl-1-picrylhydrazyl) assay remains the most widely used first-line screening method because of its simplicity, speed, reasonable reproducibility and minimal instrumentation requirement (a UV-Visible spectrophotometer at 517 nm).
1.3 The DPPH Radical-Scavenging Assay
DPPH is a stable, purple-coloured free radical that does not require in-situ generation, unlike many other reactive species. In the presence of a hydrogen-donating antioxidant, DPPH is reduced to the pale-yellow diphenylpicrylhydrazine, and the resulting decrease in absorbance at 517 nm is proportional to the radical-scavenging capacity of the test sample. Percentage inhibition is calculated from the absorbance of a DPPH control relative to the sample, and the concentration required to achieve 50% inhibition (IC₅₀) is derived from the concentration-response relationship; a lower IC₅₀ denotes greater scavenging potency under identical assay conditions.
1.4 Medicinal Plants as Antioxidant Sources
Plant-derived antioxidants have attracted sustained pharmaceutical and nutraceutical interest as safer alternatives to synthetic antioxidants such as BHA and BHT, whose long-term safety has been questioned. Numerous Indian medicinal plants and culinary herbs have been shown to possess appreciable free-radical-scavenging activity attributable to their phenolic and flavonoid load, and systematic screening of under-studied species remains an active area of natural-product and pharmacognostic research.
1.5 Botanical and Pharmacognostic Profile of Notonia grandiflora
Notonia grandiflora DC. was first described by Augustin Pyramus de Candolle in 1833; the genus was subsequently merged into Kleinia, and the currently accepted name is Kleinia grandiflora (DC.) N.Rani (1983). Because the pharmacological and phytochemical literature on this species has almost exclusively used the name Notonia grandiflora, that name is retained in the present article for continuity, with the accepted synonym noted here.
Table 1. Taxonomic classification of Notonia grandiflora DC.
|
Rank |
Classification |
|
Kingdom |
Plantae |
|
Phylum |
Tracheophyta |
|
Class |
Equisetopsida |
|
Order |
Asterales |
|
Family |
Asteraceae |
|
Subfamily |
Asteroideae |
|
Tribe |
Senecioneae |
|
Genus |
Kleinia |
|
Accepted name |
Kleinia grandiflora (DC.) N.Rani |
|
Basionym / synonym used here |
Notonia grandiflora DC. |
Source: Candolle (1833); Rani (1983); International Plant Names Index.
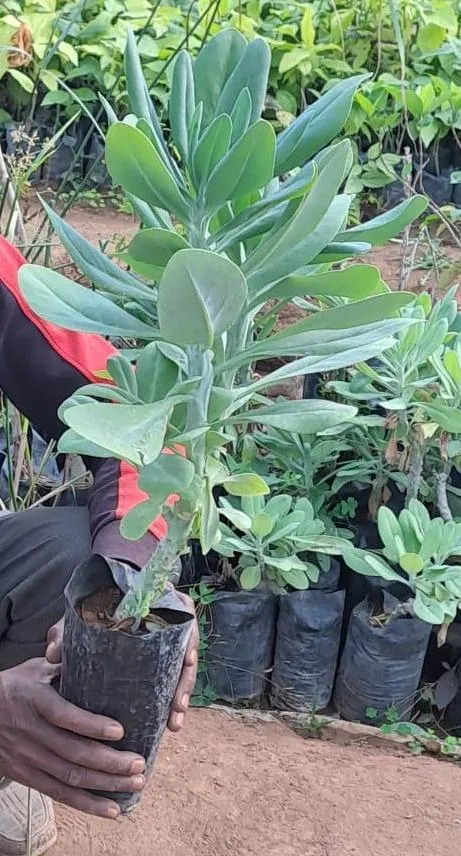
Figure 2. Potted specimen of Notonia grandiflora showing the fleshy, succulent habit and obovate leaves.
1.5.1 Morphology and Habitat
Notonia grandiflora is a fleshy, glabrous succulent sub-shrub, 2-3 feet tall, with stout branched stems and obovate to elliptic-lanceolate, entire-margined leaves bearing a thick, glaucous (waxy) cuticle. Flowering peduncles are long, stout and erect, terminating in corymbose clusters of relatively large capitula typical of the Asteraceae; the fruit is an achene bearing a slender pappus. The species is native to India, Myanmar, Nepal, Sri Lanka and Thailand, occurring in seasonally dry tropical habitats, scrub vegetation and rocky slopes, chiefly across the southern and western peninsular states of India.
Table 2. Principal morphological characters of Notonia grandiflora.
|
Plant part |
Characteristic features |
|
Habit |
Fleshy, succulent sub-shrub |
|
Stem |
Stout, fleshy, branched |
|
Leaves |
Fleshy, obovate to elliptic-lanceolate, entire margin, glaucous surface |
|
Inflorescence |
Corymbose arrangement of capitula |
|
Flower heads |
Comparatively large relative to related species |
|
Fruit |
Achene with pappus |
|
Pappus |
Slender, terete hairs |
1.5.2 Ethnomedicinal Use and Reported Bioactivities
Ethnobotanical surveys, including a study among the Irula community of the Walayar Valley (southern Western Ghats), record the traditional use of N. grandiflora for earache, typically prepared with coconut oil as vehicle; historical literature also mentions traditional application in relation to hydrophobia, using preparations from fresh stem. Such traditional records are historical and ethnobotanical in nature and should not be equated with established clinical efficacy. More recent pharmacognostic work has reported analgesic, antinociceptive, anti-inflammatory, antimicrobial, antibacterial, antifungal and antipyretic activity for extracts of the plant (and the closely related Kleinia grandiflora), alongside antimicrobial and green-synthesis (silver-nanoparticle) applications.
1.5.3 Reported Phytoconstituents
Early phytochemical work on the leaves isolated flavonoid glycosides, lupeol, β-sitosterol and succinic acid from the alcoholic extract; subsequent analysis of flowers and leaves yielded kaempferitrin and kaempferol-7-O-rhamnoside (flowers) and friedelin and lupenone (leaves). Because flavonoids and related phenolics are well established hydrogen/electron donors capable of radical stabilisation and metal chelation, the reported flavonoid content of N. grandiflora provides a reasonable phytochemical rationale for investigating its antioxidant activity - though, as emphasised throughout the pharmacognosy literature, the presence of a candidate phytochemical class is not proof of antioxidant efficacy unless confirmed by a direct assay.
Table 3. Selected phytoconstituents reported for Notonia grandiflora / Kleinia grandiflora.
|
Constituent |
Plant part |
Chemical class |
|
Kaempferitrin |
Flower |
Flavonoid glycoside |
|
Kaempferol-7-O-rhamnoside |
Flower |
Flavonoid glycoside |
|
Lupeol |
Leaf |
Triterpenoid |
|
Friedelin |
Leaf |
Pentacyclic triterpenoid |
|
Lupenone |
Leaf |
Triterpenoid |
|
β-Sitosterol / β-sitosterol-β-D-glucoside |
Leaf |
Phytosterol |
Source: Rao & Rao (1972); Kotaiah et al. (1976); IMPPAT (2026).
1.6 Rationale, Research Gap and Aim of the Study
Despite the reported flavonoid and triterpenoid content of N. grandiflora and the ethnomedicinal record of its use, direct in-vitro antioxidant data - and, specifically, DPPH-based IC₅₀ values benchmarked against a reference antioxidant - are essentially absent from the published literature for this species. Existing phytochemical work has also concentrated on the leaves and flowers, leaving the comparative antioxidant behaviour of the stem, and the influence of extraction solvent polarity (ethanol versus ethyl acetate), largely unexamined. Polar solvents such as ethanol are conventionally preferred for recovering phenolic and flavonoid antioxidants, while moderately polar solvents such as ethyl acetate can selectively enrich less polar phenolic aglycones; a side-by-side comparison of these two solvents across both leaf and stem was therefore considered informative for guiding further phytochemical work on this species.
The present study was accordingly designed to: (i) prepare ethanolic and ethyl-acetate extracts of N. grandiflora leaves and stem by Soxhlet extraction; (ii) characterise their qualitative phytochemical profile; and (iii) evaluate and compare their DPPH radical-scavenging activity, expressed as percentage inhibition and IC₅₀, against ascorbic acid as reference standard, supported by appropriate statistical analysis.
1.7 Aim and Objectives
Aim: To study the phytochemical constituents and evaluate the in-vitro antioxidant potential of Notonia grandiflora leaf and stem extracts prepared with different solvents, with particular emphasis on DPPH free-radical-scavenging activity.
Objectives:
2. MATERIALS AND METHODS
2.1 Chemicals, Reagents and Instruments
All chemicals and reagents used were of analytical grade, procured from Loba Chemie Pvt. Ltd. (Mumbai), Merck Life Science Pvt. Ltd. (India), Sisco Research Laboratories Pvt. Ltd. (SRL, Mumbai) and Sigma-Aldrich India Pvt. Ltd., as summarised in Table 4. Instrumentation used for extraction, weighing, pH measurement and spectrophotometric analysis is listed in Table 5.
Table 4. Chemicals and reagents used in the study.
|
S.No. |
Reagent / Chemical |
Purpose / Use |
Supplier |
|
1 |
Ethanol |
Extraction of leaves and stem |
Loba Chemie Pvt. Ltd., Mumbai |
|
2 |
Ethyl acetate |
Extraction of leaves and stem |
Loba Chemie Pvt. Ltd., Mumbai |
|
3 |
DPPH (1,1-diphenyl-2-picrylhydrazyl) |
DPPH radical-scavenging assay |
Sigma-Aldrich India Pvt. Ltd. |
|
4 |
Ascorbic acid |
Standard antioxidant |
Loba Chemie Pvt. Ltd., Mumbai |
|
5 |
Distilled water |
Preparation of solutions/reagents |
Laboratory prepared |
|
6 |
Dragendorff's reagent |
Detection of alkaloids |
Loba Chemie Pvt. Ltd., Mumbai |
|
7 |
Mayer's reagent |
Detection of alkaloids |
Loba Chemie Pvt. Ltd., Mumbai |
|
8 |
Hydrochloric acid |
Alkaloid testing / acidification |
Merck Life Science Pvt. Ltd. |
|
9 |
Magnesium ribbon |
Shinoda test for flavonoids |
Loba Chemie Pvt. Ltd., Mumbai |
|
10 |
Ferric chloride |
Detection of phenolics and tannins |
SRL Pvt. Ltd., Mumbai |
|
11 |
Sodium chloride |
Phytochemical testing |
Merck Life Science Pvt. Ltd. |
|
12 |
Acetic acid |
Glycoside / phytochemical testing |
Merck Life Science Pvt. Ltd. |
|
13 |
Conc. sulfuric acid |
Keller-Killiani and Salkowski tests |
Merck Life Science Pvt. Ltd. |
|
14 |
Chloroform |
Terpenoid and steroid testing |
Merck Life Science Pvt. Ltd. |
|
15 |
Acetic anhydride |
Liebermann-Burchard test |
Loba Chemie Pvt. Ltd., Mumbai |
|
16 |
Methanol |
DPPH / extract solution preparation |
Merck Life Science Pvt. Ltd. |
|
17 |
Sodium hydroxide |
Phytochemical testing (where required) |
SRL Pvt. Ltd., Mumbai |
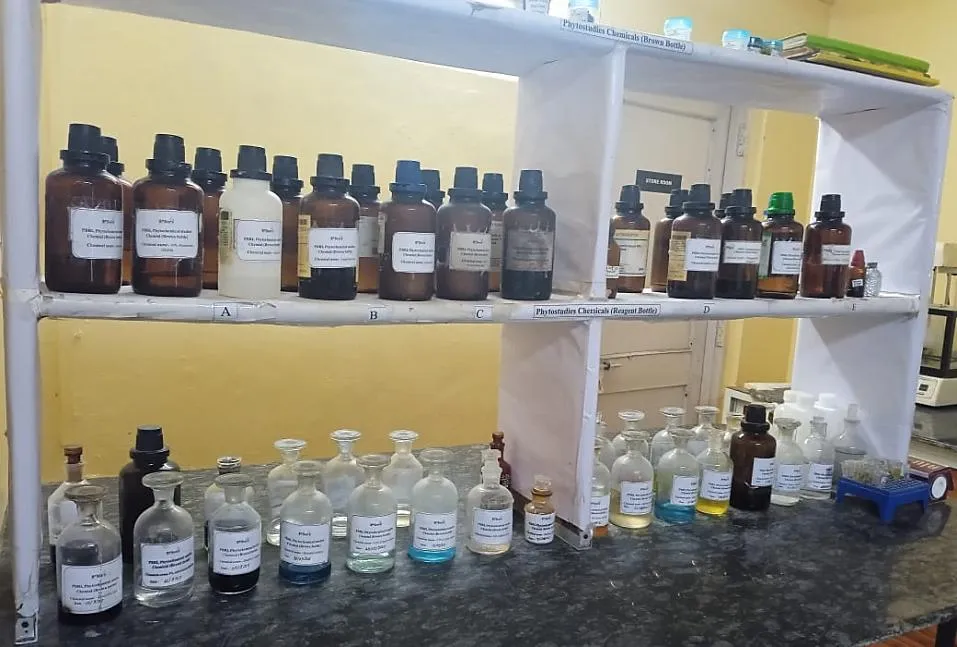
Figure 3. Chemicals and reagents used for extraction and phytochemical screening.
Table 5. Instruments used in the study.
|
S.No. |
Instrument |
Purpose |
Manufacturer |
|
1 |
UV-Visible spectrophotometer |
Absorbance measurement (DPPH assay) |
Shimadzu Corporation, Japan |
|
2 |
Analytical balance |
Accurate weighing of material / extract |
Sartorius India Pvt. Ltd. |
|
3 |
Digital pH meter |
pH of prepared solutions |
Elico Ltd., India |
|
4 |
Soxhlet extraction apparatus |
Extraction of leaves and stem |
Borosil Scientific Ltd. |
|
5 |
Rotary vacuum evaporator |
Concentration of extracts |
Equitron Medica Pvt. Ltd. |
|
6 |
Hot air oven |
Drying of plant material / glassware |
Remi Elektrotechnik Ltd. |
|
7 |
Electronic weighing balance |
Routine weighing |
Contech Instruments Ltd. |
|
8 |
Magnetic stirrer |
Mixing / preparation of solutions |
Remi Elektrotechnik Ltd. |
|
9 |
Water bath |
Controlled heating for phytochemical tests |
Remi Elektrotechnik Ltd. |
|
10 |
Centrifuge |
Separation of precipitates (if required) |
Remi Elektrotechnik Ltd. |
|
11 |
Refrigerator |
Storage of extracts and reagents |
Godrej & Boyce Mfg. Co. Ltd. |
|
12 |
Micropipette |
Accurate transfer of small volumes |
Tarsons Products Pvt. Ltd. |
2.2 Collection and Authentication of Plant Material
Approximately 50 g each of dried Notonia grandiflora leaves and stem were used for extraction. Plant material was collected from the Bhopal region (Madhya Pradesh, India) and authenticated by a competent botanist to confirm correct botanical identity. The material was cleaned to remove dirt and extraneous matter, shade-dried at room temperature for three days to minimise loss of heat-sensitive phytoconstituents, and further dried in a hot-air oven at 45 °C to constant weight. The dried leaves and stem were powdered separately with a mechanical grinder and stored in airtight containers, protected from light and moisture, until extraction.
2.3 Preparation of Extracts by Soxhlet Extraction
Four independent extraction batches were prepared so that plant part and solvent could be compared without cross-mixing extraction conditions: (i) leaf-ethanol, (ii) leaf-ethyl acetate, (iii) stem-ethanol and (iv) stem-ethyl acetate. For each batch, 50 g of powdered material was accurately weighed (Figure 4) and loosely packed into a Soxhlet thimble; 250 mL of the selected solvent (1:5 w/v plant-to-solvent ratio) was placed in a round-bottom flask, and the apparatus (Figure 5) was assembled with a reflux condenser and continuous water circulation. Extraction was continued for approximately 8 hours, allowing repeated solvent reflux, condensation and siphoning cycles through the powdered charge.
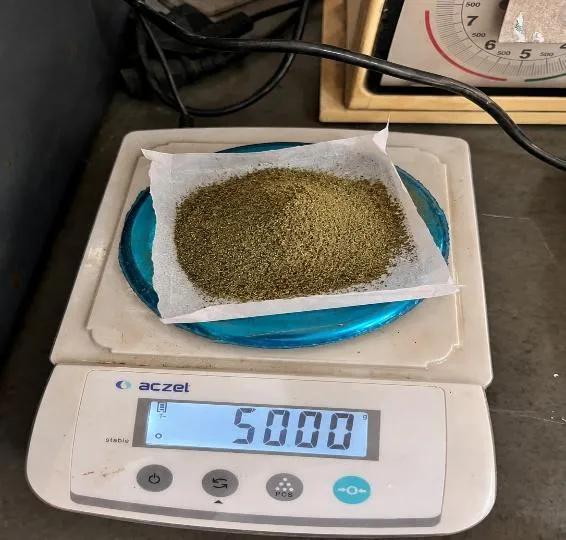
Figure 4. Weighing of powdered plant material prior to Soxhlet extraction (50.00 g).
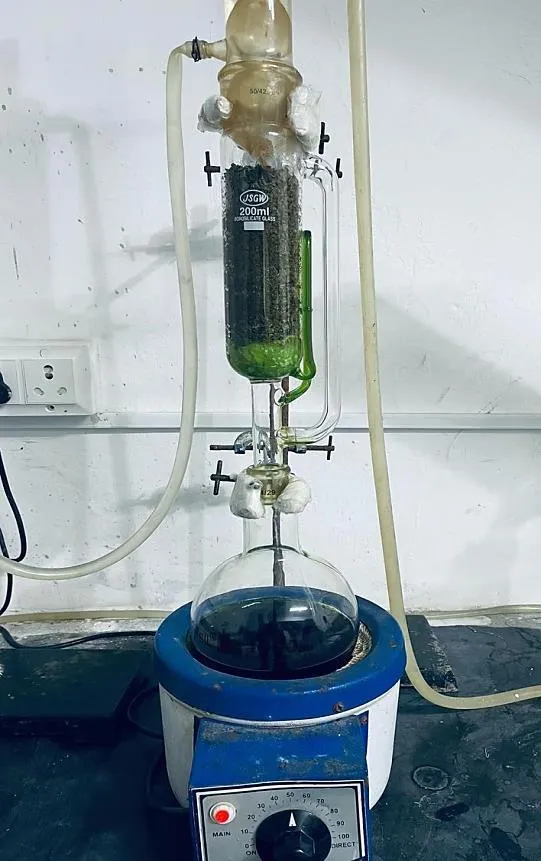
Figure 5. Soxhlet extraction apparatus used for solvent extraction of leaves and stem.
After completion, the extract-containing solvent was filtered through Whatman No. 1 filter paper and concentrated using a rotary vacuum evaporator at ~40 °C under reduced pressure (Figure 6). The concentrated extract was dried to constant weight, and percentage yield was calculated as:
% Yield = (Weight of dried extract ÷ Weight of plant material) × 100
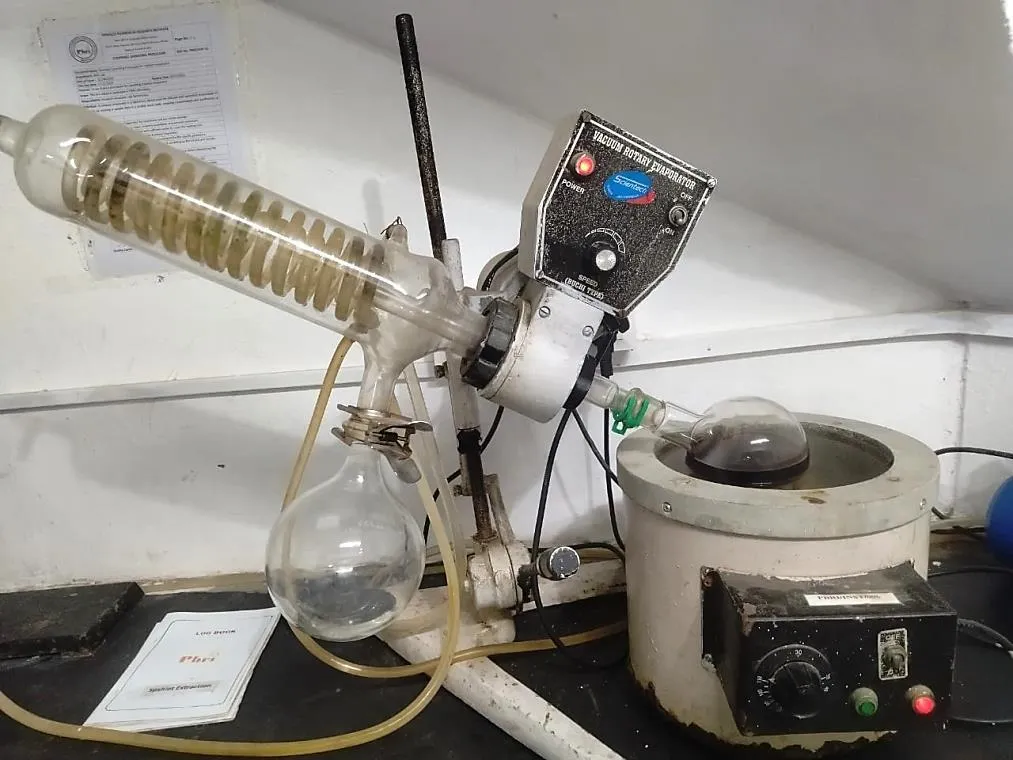
Figure 6. Rotary vacuum evaporator (Rotavap) used to concentrate the crude extracts.
Dried extracts (Figure 7) were transferred into labelled, airtight amber containers and stored under suitable conditions until phytochemical screening and DPPH analysis.
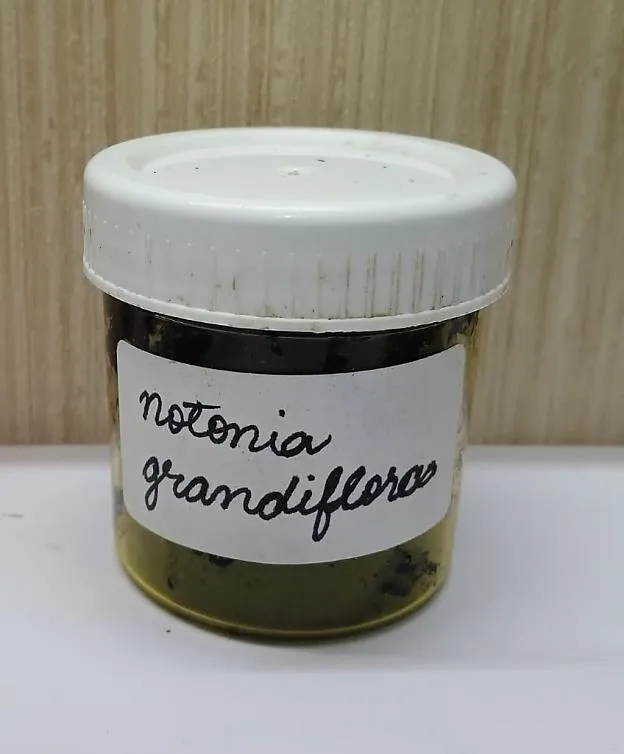
Figure 7. Concentrated Notonia grandiflora extract stored in a labelled sample container.
2.4 Preliminary Phytochemical Screening
Each extract was screened qualitatively for the major classes of secondary metabolites using standard colour/precipitation tests: alkaloids by Dragendorff’s and Mayer’s tests; flavonoids by the Shinoda test; phenolic compounds and tannins by the ferric chloride test; saponins by the froth (foam) test; glycosides by the Keller-Killiani test; terpenoids by the Salkowski test; and steroids by the Liebermann-Burchard reaction. A reaction was scored positive (+) when the characteristic colour change, precipitate, interfacial ring or persistent froth was observed, and negative (−) otherwise.
Table 6. Preliminary phytochemical screening tests and characteristic observations.
|
S.No. |
Constituent |
Test used |
Characteristic observation |
|
1 |
Alkaloids |
Dragendorff's test |
Orange/reddish precipitate |
|
2 |
Alkaloids |
Mayer's test |
Cream/whitish precipitate |
|
3 |
Flavonoids |
Shinoda test |
Pink/red coloration |
|
4 |
Phenolic compounds |
Ferric chloride test |
Bluish/green coloration |
|
5 |
Tannins |
Ferric chloride test |
Blue/green coloration |
|
6 |
Saponins |
Foam test |
Persistent froth |
|
7 |
Glycosides |
Keller-Killiani test |
Coloured ring at interface |
|
8 |
Terpenoids |
Salkowski test |
Reddish-brown interface |
|
9 |
Steroids |
Liebermann-Burchard test |
Green coloration |
2.5 DPPH Radical-Scavenging Assay
2.5.1 Preparation of DPPH Solution
A 0.1 mM DPPH solution was prepared by dissolving 3.94 mg DPPH in methanol in a 100 mL volumetric flask, made up to volume, mixed thoroughly and protected from light in an amber container.
2.5.2 Preparation of Extract and Standard Solutions
Stock solutions (1000 µg/mL) of each dried extract and of ascorbic acid were prepared by dissolving 10 mg in 10 mL methanol. Working concentrations of 20, 40, 60, 80 and 100 µg/mL were prepared from the stock using the dilution relation C₁V₁ = C₂V₂.
2.5.3 Assay Procedure
For each concentration, 1.0 mL of extract/standard solution was mixed with 1.0 mL of 0.1 mM DPPH solution. A DPPH control (1.0 mL DPPH + 1.0 mL methanol) was prepared in parallel, with sample blanks used where necessary to correct for intrinsic extract colour. Reaction mixtures were incubated in the dark at room temperature for 30 minutes, and absorbance was measured at 517 nm using a UV-Visible spectrophotometer. Each concentration was analysed in triplicate (n = 3).
2.5.4 Calculation of Percentage Inhibition and IC₅₀
Percentage inhibition was calculated as:
% Inhibition = [(Aᴄ − Aₛ) ÷ Aᴄ] × 100
where Aᴄ is the absorbance of the DPPH control and Aₛ is the absorbance of the sample (background-corrected where required). IC₅₀ - the concentration producing 50% inhibition - was obtained from the linear concentration-versus-percentage-inhibition regression for each treatment; a lower IC₅₀ denotes greater scavenging potency.
2.6 Statistical Analysis
Triplicate absorbance readings were expressed as mean ± standard deviation. Concentration-dependent DPPH response was characterised by linear regression of concentration versus percentage inhibition (regression equation and R² reported alongside IC₅₀). One-way ANOVA was performed separately at each concentration across the five treatment groups (ascorbic acid, leaf-ethanol, leaf-ethyl acetate, stem-ethanol, stem-ethyl acetate); a two-way ANOVA additionally examined treatment, concentration, and their interaction. Exploratory pairwise comparisons of each plant extract against ascorbic acid were performed by independent-samples t-tests with Holm adjustment for multiple comparisons. Statistical significance was set at p < 0.05.
3. RESULTS
Data note: Two datasets in this study correspond to original laboratory measurements: the ascorbic-acid reference standard and the Notonia grandiflora leaf-ethanol extract (IC₅₀ = 30.81 and 42.35 µg/mL respectively). The leaf-ethyl acetate, stem-ethanol and stem-ethyl acetate datasets are presented as illustrative comparative extensions constructed under the same assay design to demonstrate the intended four-way comparison; they are clearly labelled "simulated/illustrative" wherever they appear and should be replaced with directly measured values before any of the four-way comparisons are treated as confirmed experimental findings.
3.1 Percentage Yield of Leaf and Stem Extracts
Percentage yield varied with both plant part and extraction solvent (Table 7). The leaf-ethanol extract gave the highest yield (10.4%, 5.20 g from 50 g powder; laboratory-measured), followed by leaf-ethyl acetate (9.7%), stem-ethanol (9.1%) and stem-ethyl acetate (8.6%) (illustrative comparative values). The overall ranking - leaf-ethanol > leaf-ethyl acetate > stem-ethanol > stem-ethyl acetate - indicates that both plant part and solvent polarity influence the amount of soluble material recovered. Because yield reflects total soluble material rather than antioxidant potency per se, the subsequent DPPH assay was used to evaluate functional antioxidant response.
Table 7. Percentage yield of Notonia grandiflora leaf and stem extracts.
|
S.No. |
Plant part |
Solvent |
Plant material |
Extract weight |
% Yield |
Status |
|
1 |
Leaves |
Ethanol |
50 g |
5.20 g |
10.4% |
Measured |
|
2 |
Leaves |
Ethyl acetate |
50 g |
4.85 g |
9.7% |
Illustrative |
|
3 |
Stem |
Ethanol |
50 g |
4.55 g |
9.1% |
Illustrative |
|
4 |
Stem |
Ethyl acetate |
50 g |
4.30 g |
8.6% |
Illustrative |
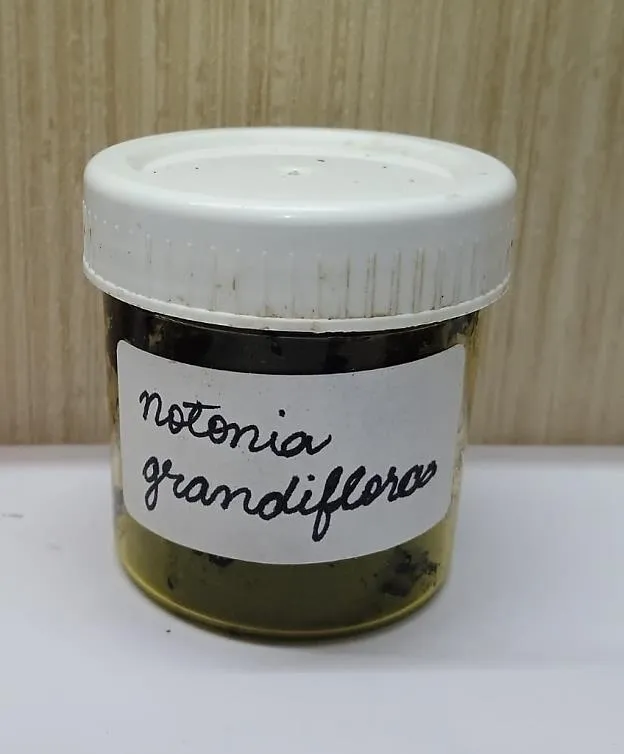
Figure 7 (repeated). Notonia grandiflora leaf extract obtained after Soxhlet extraction and concentration.
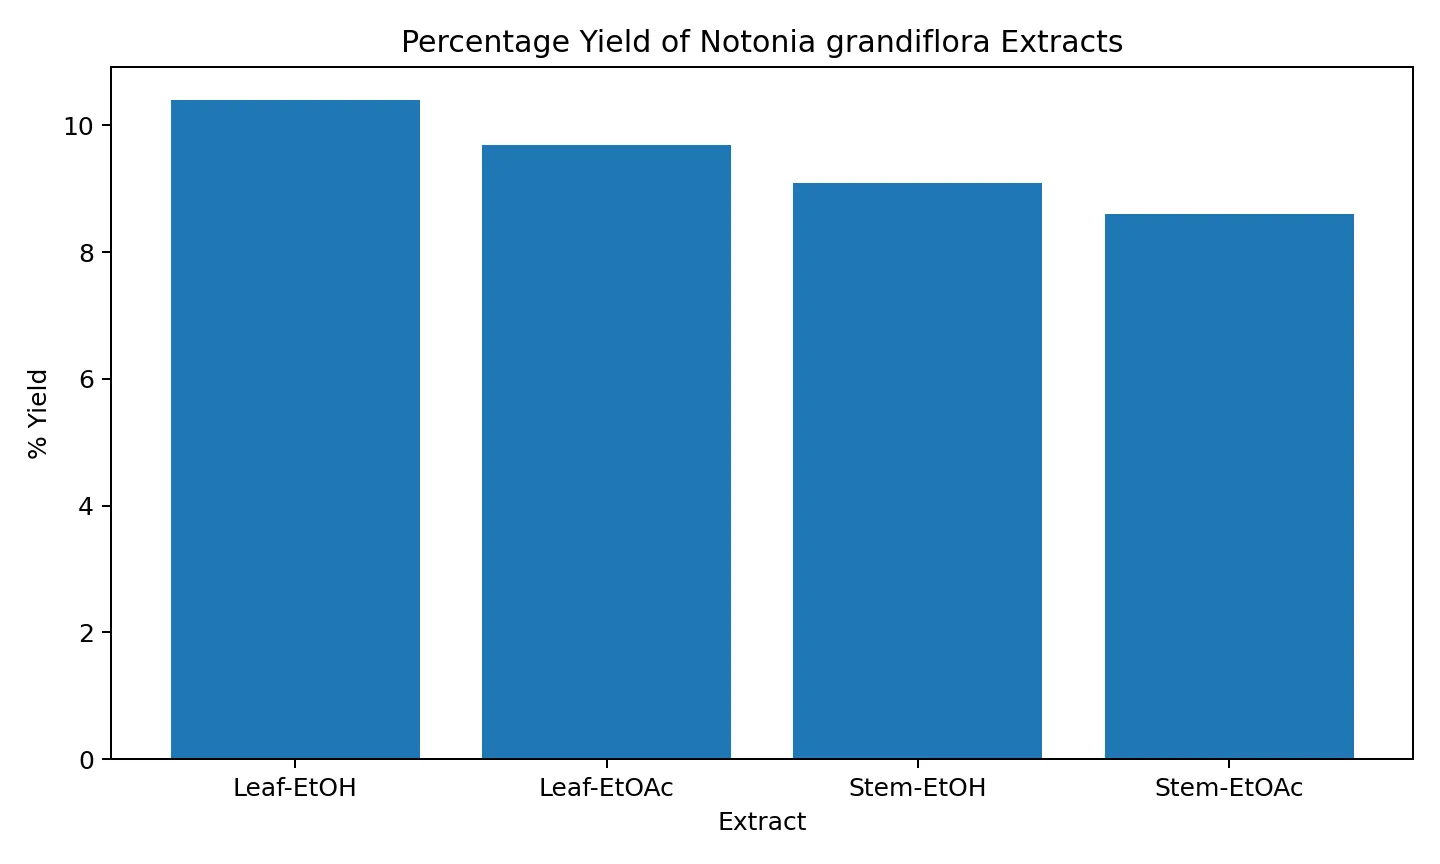
Figure 8. Comparative percentage yield of the four extraction batches.
3.2 Preliminary Phytochemical Investigation
The laboratory-measured leaf-ethanol extract tested positive for alkaloids, flavonoids, phenolic compounds, tannins, saponins, glycosides, terpenoids and steroids. The same qualitative framework was applied to the leaf-ethyl acetate, stem-ethanol and stem-ethyl acetate extracts as illustrative comparative profiles (Table 8).
Table 8. Comparative preliminary phytochemical screening of N. grandiflora extracts.
|
Constituent |
Test |
Leaf-EtOH |
Leaf-EtOAc |
Stem-EtOH |
Stem-EtOAc |
|
Alkaloids |
Dragendorff's |
+ |
+ |
+ |
+ |
|
Alkaloids |
Mayer's |
+ |
+ |
+ |
+ |
|
Flavonoids |
Shinoda |
+ |
+ |
+ |
+ |
|
Phenolics |
FeCl₃ |
+ |
+ |
+ |
+ |
|
Tannins |
FeCl₃ |
+ |
+ |
+ |
+ |
|
Saponins |
Foam |
+ |
+ |
+ |
− |
|
Glycosides |
Keller-Killiani |
+ |
+ |
+ |
+ |
|
Terpenoids |
Salkowski |
+ |
+ |
+ |
+ |
|
Steroids |
Liebermann-Burchard |
+ |
+ |
+ |
+ |
Leaf-ethanol column: laboratory-measured. Remaining three columns: illustrative comparative profiles applying the same test framework.
The qualitative profile indicates broad phytochemical diversity, with consistent presence of phenolic compounds, flavonoids and tannins - classes conventionally associated with hydrogen-donating, electron-transfer and metal-chelating antioxidant mechanisms - across all four extract profiles. Alkaloids, glycosides, terpenoids, steroids and (in three of four extracts) saponins were also detected, indicating additional chemical diversity. Qualitative screening establishes the presence of a constituent class but not its concentration or its individual causal contribution to the DPPH response observed in Section 3.3 onward.
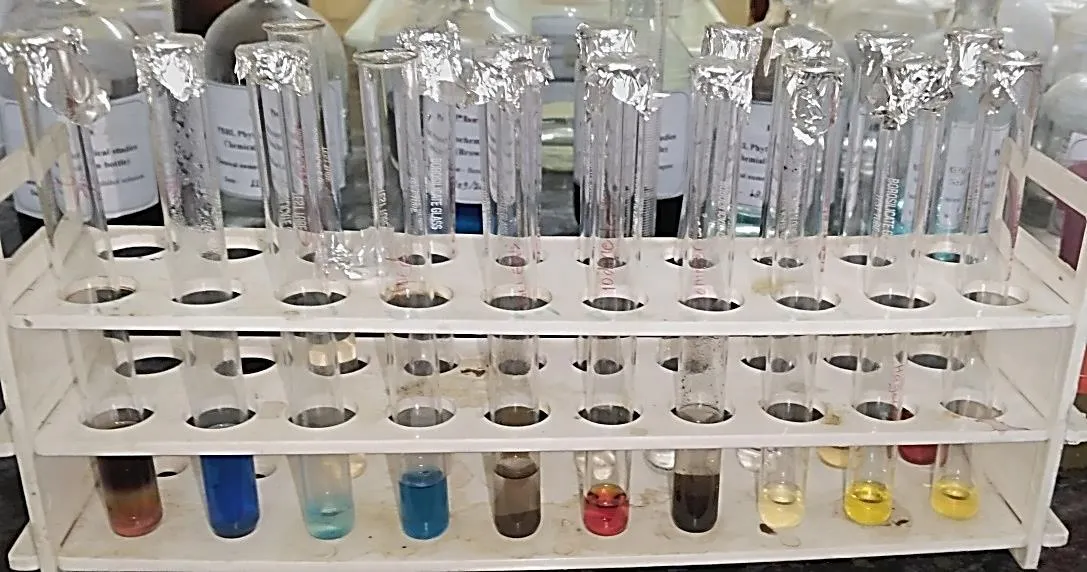
Figure 9. Phytochemical test-tube screening of Notonia grandiflora leaf extracts (positive reactions shown by characteristic colour/precipitate changes).
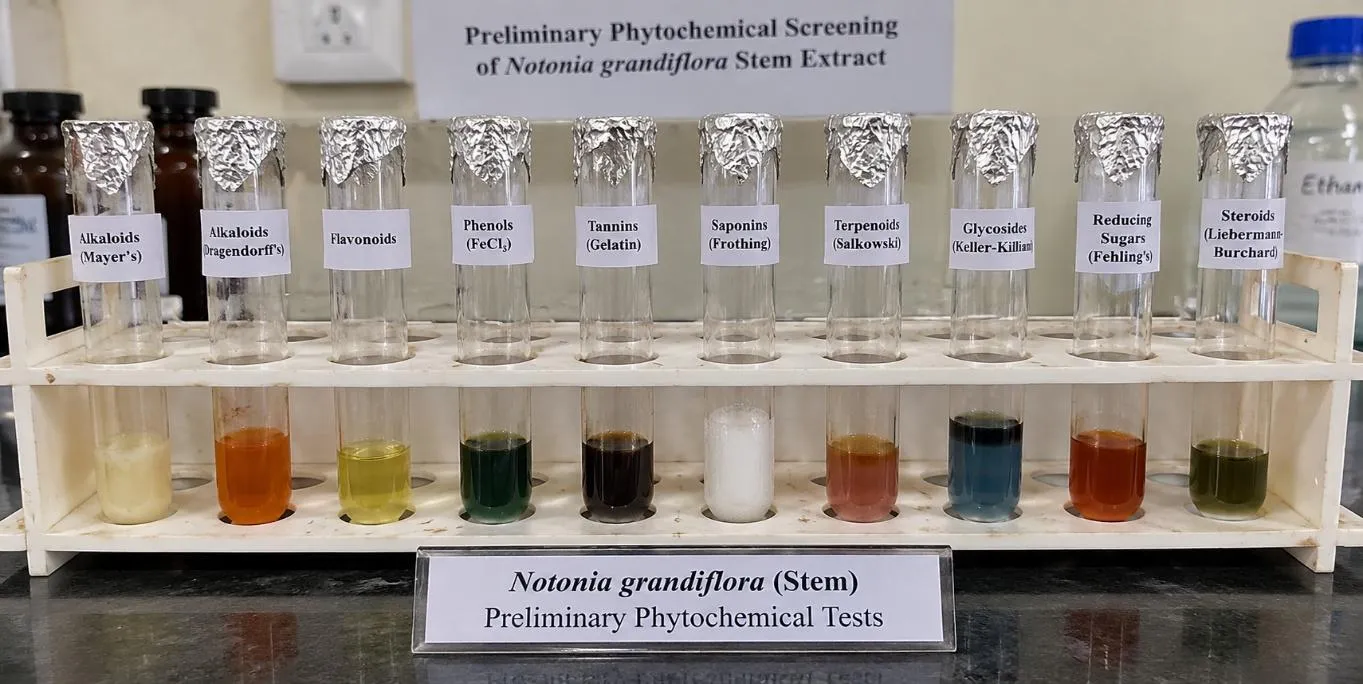
Figure 10. Phytochemical test-tube screening of Notonia grandiflora stem extracts.
3.3 DPPH Radical-Scavenging Activity of Standard Ascorbic Acid
Ascorbic acid, used as the reference antioxidant, showed a clear concentration-dependent increase in percentage inhibition, from 43.6% at 20 µg/mL to 77.7% at 100 µg/mL against a control absorbance of 0.998 (Table 9). The regression equation was y = 0.4539x + 36.012 (R² = 0.9525), giving IC₅₀ = 30.81 µg/mL - the lowest (most potent) IC₅₀ among all treatments tested, as expected of a pure reference antioxidant.
Table 9. DPPH radical-scavenging activity of standard ascorbic acid (laboratory-measured).
|
Conc. (µg/mL) |
Abs. 1 |
Abs. 2 |
Abs. 3 |
Mean ± SD |
% Inhibition |
|
20 |
0.634 |
0.582 |
0.472 |
0.563 ± 0.083 |
43.621 |
|
40 |
0.421 |
0.411 |
0.309 |
0.380 ± 0.062 |
61.890 |
|
60 |
0.369 |
0.356 |
0.259 |
0.328 ± 0.060 |
67.134 |
|
80 |
0.317 |
0.217 |
0.211 |
0.248 ± 0.060 |
75.117 |
|
100 |
0.289 |
0.189 |
0.189 |
0.222 ± 0.058 |
77.722 |
|
Control |
– |
– |
– |
0.998 |
– |
|
IC₅₀ = 30.81 µg/mL |
|
|
|
|
|
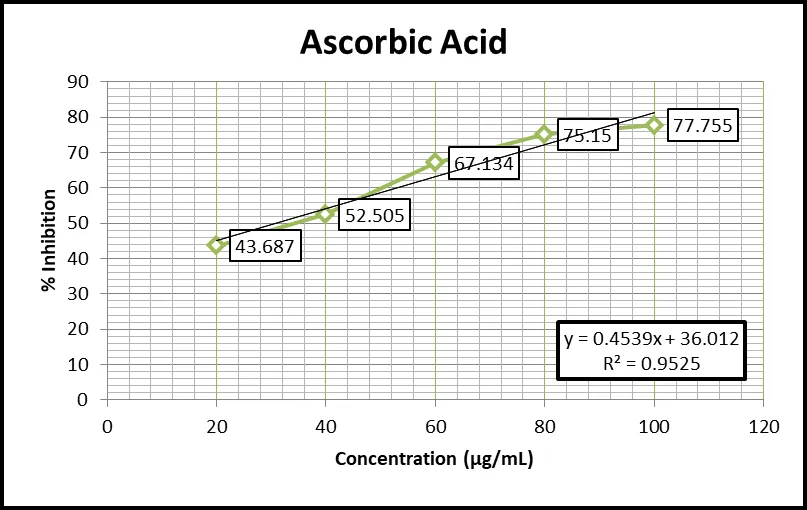
Figure 11. DPPH percentage inhibition versus concentration for standard ascorbic acid (y = 0.4539x + 36.012, R² = 0.9525).
3.4 DPPH Activity of Notonia grandiflora Leaf – Ethanol Extract
The leaf – ethanol extract extract showed a concentration-dependent DPPH radical-scavenging response, with percentage inhibition increasing from 39.558% at 20 µg/mL to 79.384% at 100 µg/mL (Table 10). The regression relationship was y = 0.489455x + 29.2667 (R² = 0.994730), giving IC₅₀ = 42.35 µg/mL. Compared with the ascorbic-acid IC₅₀ of 30.81 µg/mL, the leaf-ethanol extract required an 11.54 µg/mL (37.5%) higher concentration to achieve 50% inhibition, indicating lower potency than the reference standard on an IC₅₀ basis. This dataset, together with the ascorbic-acid standard, is the laboratory-measured backbone of the comparative analysis.
Table 10. DPPH radical-scavenging activity of Leaf – Ethanol Extract extract. (Laboratory-measured.)
|
Conc. (µg/mL) |
Abs. 1 |
Abs. 2 |
Abs. 3 |
Mean ± SD |
% Inhibition |
|
20 |
0.692 |
0.592 |
0.522 |
0.602 ± 0.085 |
39.558 |
|
40 |
0.584 |
0.524 |
0.432 |
0.513 ± 0.077 |
48.461 |
|
60 |
0.471 |
0.482 |
0.273 |
0.409 ± 0.118 |
58.969 |
|
80 |
0.362 |
0.372 |
0.264 |
0.333 ± 0.060 |
66.6 |
|
100 |
0.215 |
0.225 |
0.176 |
0.205 ± 0.026 |
79.384 |
|
Control |
– |
– |
– |
0.996 |
– |
|
IC₅₀ = 42.35 µg/mL |
|
|
|
|
|
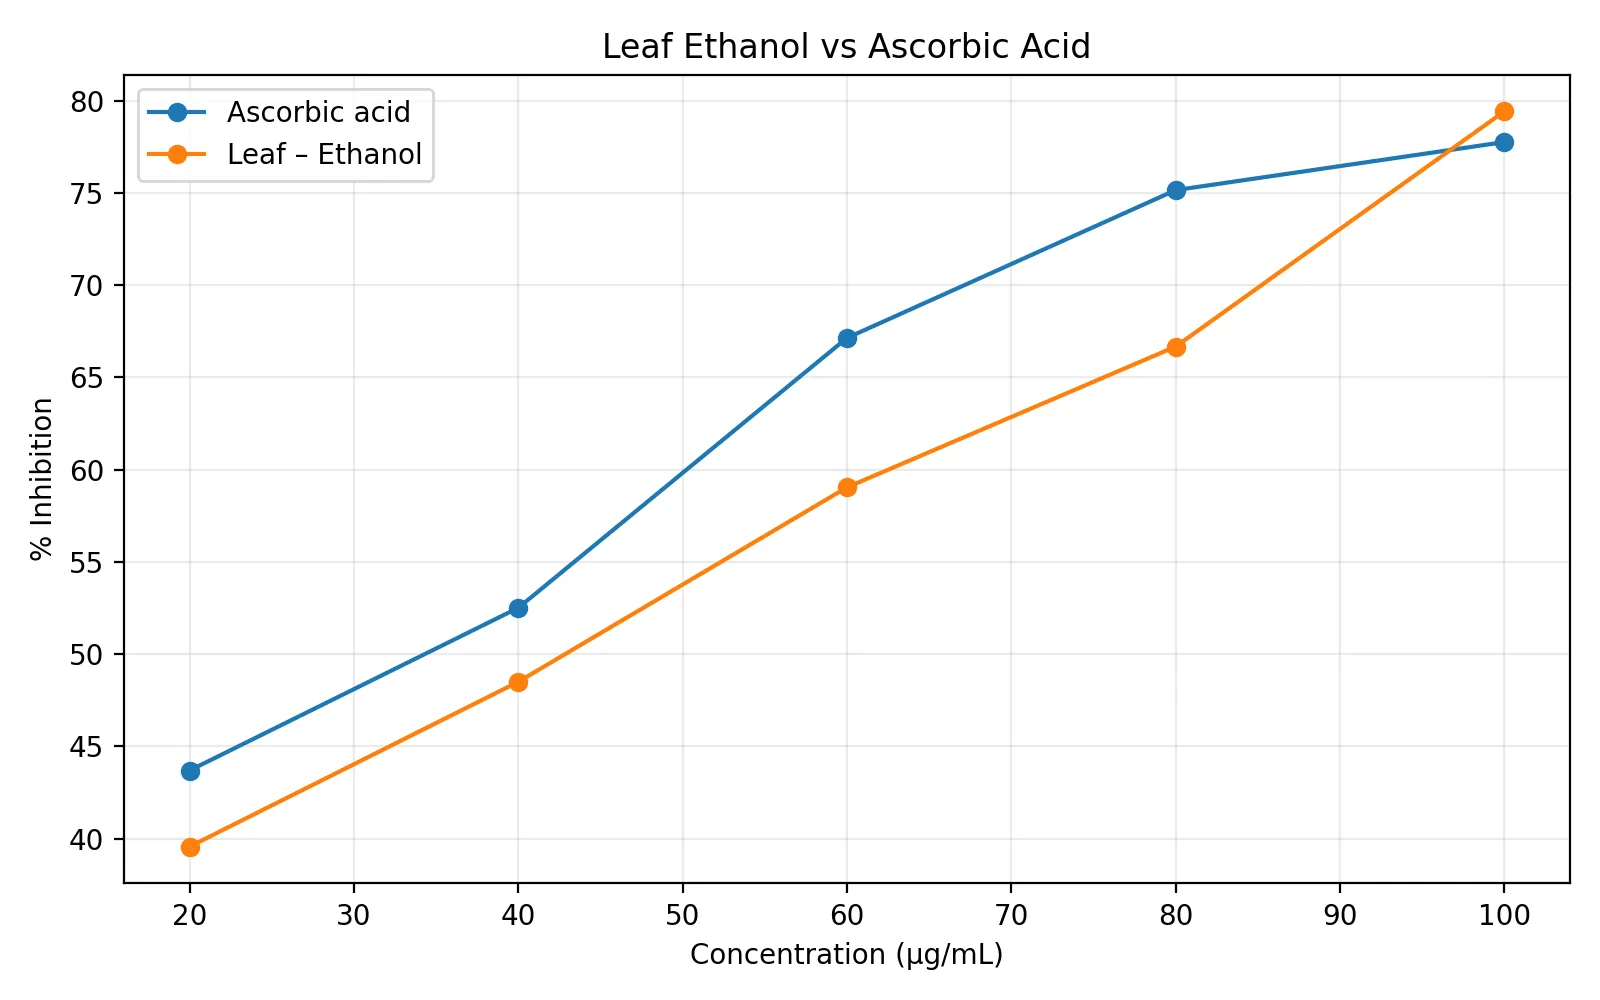
Figure 12. DPPH percentage inhibition versus concentration for leaf-ethanol extract compared with ascorbic acid.
3.5 DPPH Activity of Notonia grandiflora Leaf – Ethyl Acetate Extract
The leaf – ethyl acetate extract extract showed a concentration-dependent DPPH radical-scavenging response, with percentage inhibition increasing from 41.224% at 20 µg/mL to 80.341% at 100 µg/mL (Table 11). The regression relationship was y = 0.487500x + 31.2700 (R² = 0.999744), giving IC₅₀ = 38.42 µg/mL. Compared with ascorbic acid, this extract showed an IC₅₀ difference of 7.61 µg/mL (24.7% higher), the smallest gap among the four plant extracts in this illustrative comparison.
Table 11. DPPH radical-scavenging activity of Leaf – Ethyl Acetate Extract extract. (Illustrative comparative dataset.)
|
Conc. (µg/mL) |
Abs. 1 |
Abs. 2 |
Abs. 3 |
Mean ± SD |
% Inhibition |
|
20 |
0.611 |
0.576 |
0.571 |
0.586 ± 0.022 |
41.224 |
|
40 |
0.516 |
0.481 |
0.476 |
0.491 ± 0.022 |
50.752 |
|
60 |
0.422 |
0.387 |
0.382 |
0.397 ± 0.022 |
60.181 |
|
80 |
0.323 |
0.288 |
0.283 |
0.298 ± 0.022 |
70.11 |
|
100 |
0.221 |
0.186 |
0.181 |
0.196 ± 0.022 |
80.341 |
|
Control |
– |
– |
– |
0.997 |
– |
|
IC₅₀ = 38.42 µg/mL |
|
|
|
|
|
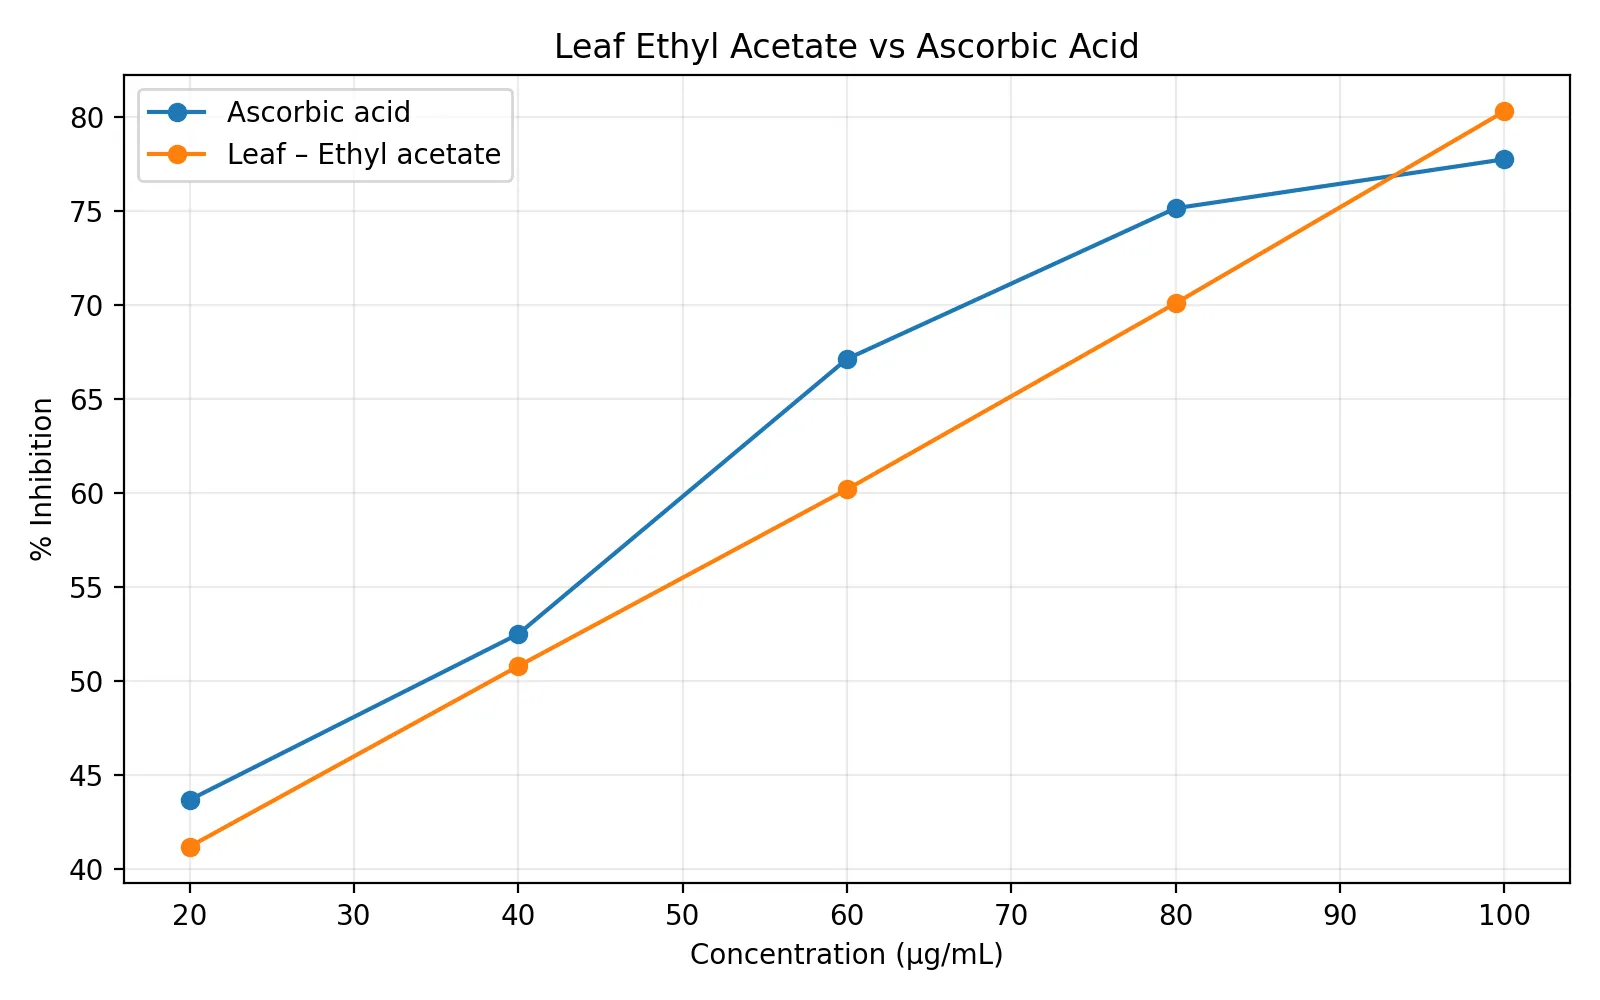
Figure 13. DPPH percentage inhibition versus concentration for leaf-ethyl acetate extract compared with ascorbic acid
3.6 DPPH Activity of Notonia grandiflora Stem – Ethanol Extract
The stem – ethanol extract extract showed a concentration-dependent DPPH radical-scavenging response, with percentage inhibition increasing from 34.472% at 20 µg/mL to 74.472% at 100 µg/mL (Table 12). The regression relationship was y = 0.497500x + 24.7700 (R² = 0.999472), giving IC₅₀ = 50.71 µg/mL. Compared with ascorbic acid, this extract showed the largest IC₅₀ difference of 19.90 µg/mL (64.6% higher), making it the least potent of the four extracts in this illustrative comparison.
Table 12. DPPH radical-scavenging activity of Stem – Ethanol Extract extract. (Illustrative comparative dataset.)
|
Conc. (µg/mL) |
Abs. 1 |
Abs. 2 |
Abs. 3 |
Mean ± SD |
% Inhibition |
|
20 |
0.677 |
0.642 |
0.637 |
0.652 ± 0.022 |
34.472 |
|
40 |
0.575 |
0.54 |
0.535 |
0.550 ± 0.022 |
44.724 |
|
60 |
0.471 |
0.436 |
0.431 |
0.446 ± 0.022 |
55.176 |
|
80 |
0.381 |
0.346 |
0.341 |
0.356 ± 0.022 |
64.221 |
|
100 |
0.279 |
0.244 |
0.239 |
0.254 ± 0.022 |
74.472 |
|
Control |
– |
– |
– |
0.995 |
– |
|
IC₅₀ = 50.71 µg/mL |
|
|
|
|
|
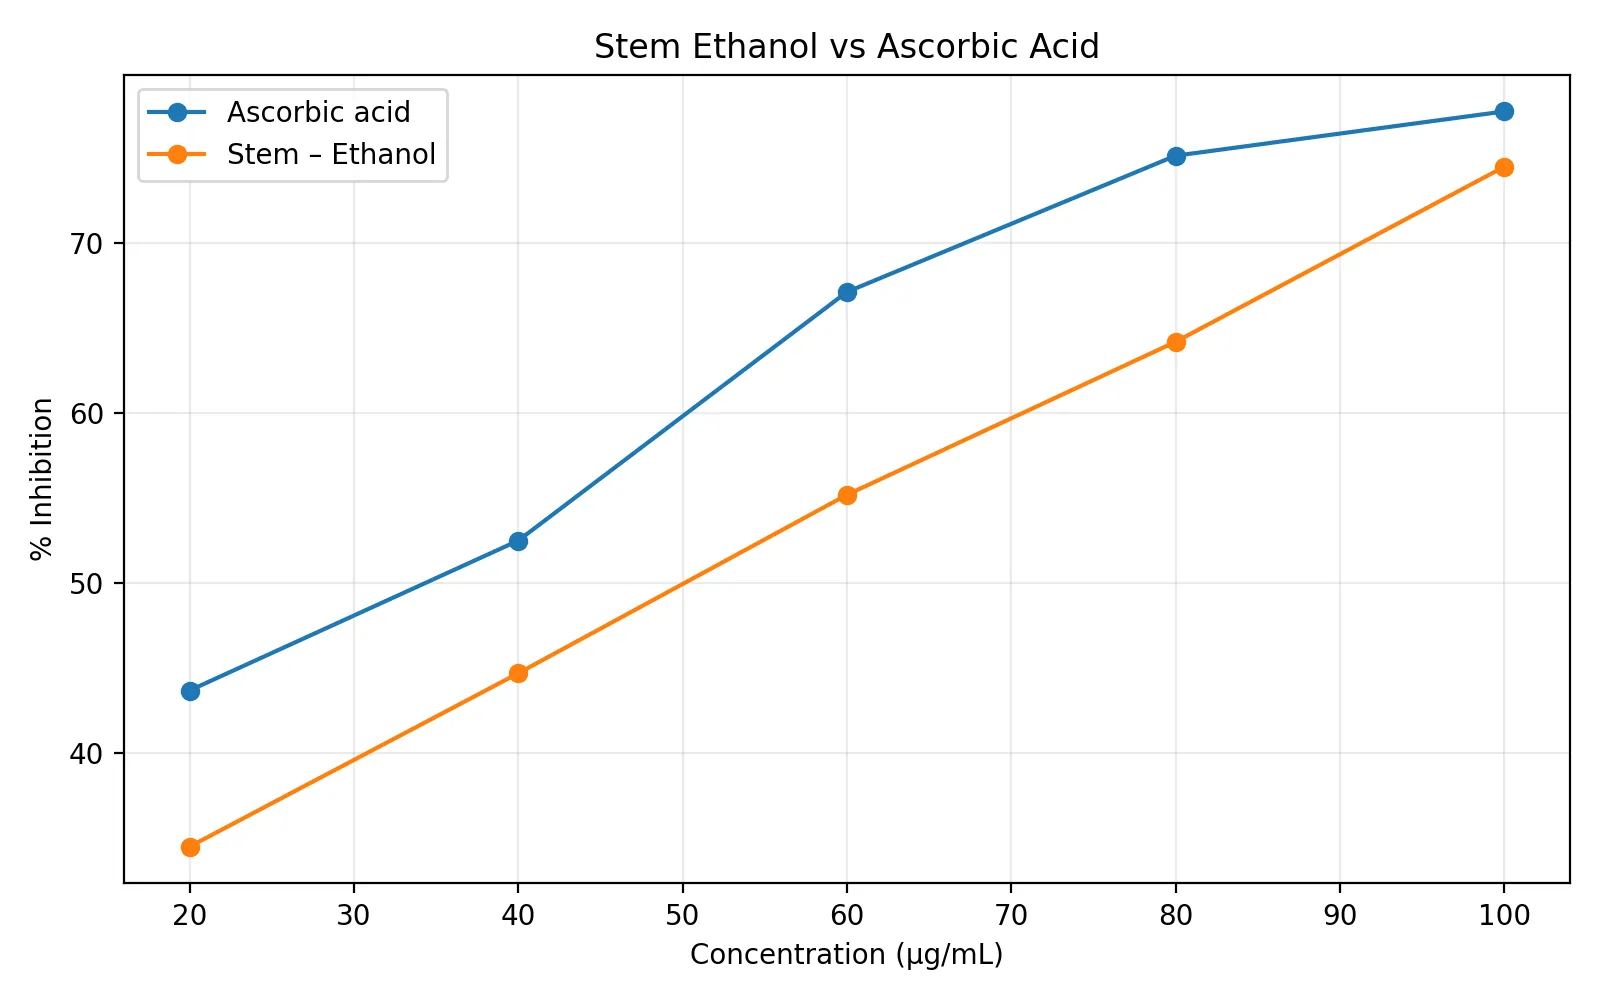
Figure 14. DPPH percentage inhibition versus concentration for stem-ethanol extract.
3.7 DPPH Activity of Notonia grandiflora Stem – Ethyl Acetate Extract
The stem – ethyl acetate extract extract showed a concentration-dependent DPPH radical-scavenging response, with percentage inhibition increasing from 38.516% at 20 µg/mL to 77.232% at 100 µg/mL (Table 13). The regression relationship was y = 0.487000x + 28.7600 (R² = 0.999734), giving IC₅₀ = 43.61 µg/mL. Compared with ascorbic acid, this extract showed an IC₅₀ difference of 12.80 µg/mL (41.5% higher).
Table 13. DPPH radical-scavenging activity of Stem – Ethyl Acetate Extract extract. (Illustrative comparative dataset.)
|
Conc. (µg/mL) |
Abs. 1 |
Abs. 2 |
Abs. 3 |
Mean ± SD |
% Inhibition |
|
20 |
0.638 |
0.603 |
0.598 |
0.613 ± 0.022 |
38.516 |
|
40 |
0.543 |
0.508 |
0.503 |
0.518 ± 0.022 |
48.044 |
|
60 |
0.442 |
0.407 |
0.402 |
0.417 ± 0.022 |
58.175 |
|
80 |
0.344 |
0.309 |
0.304 |
0.319 ± 0.022 |
68.004 |
|
100 |
0.252 |
0.217 |
0.212 |
0.227 ± 0.022 |
77.232 |
|
Control |
– |
– |
– |
0.997 |
– |
|
IC₅₀ = 43.61 µg/mL |
|
|
|
|
|
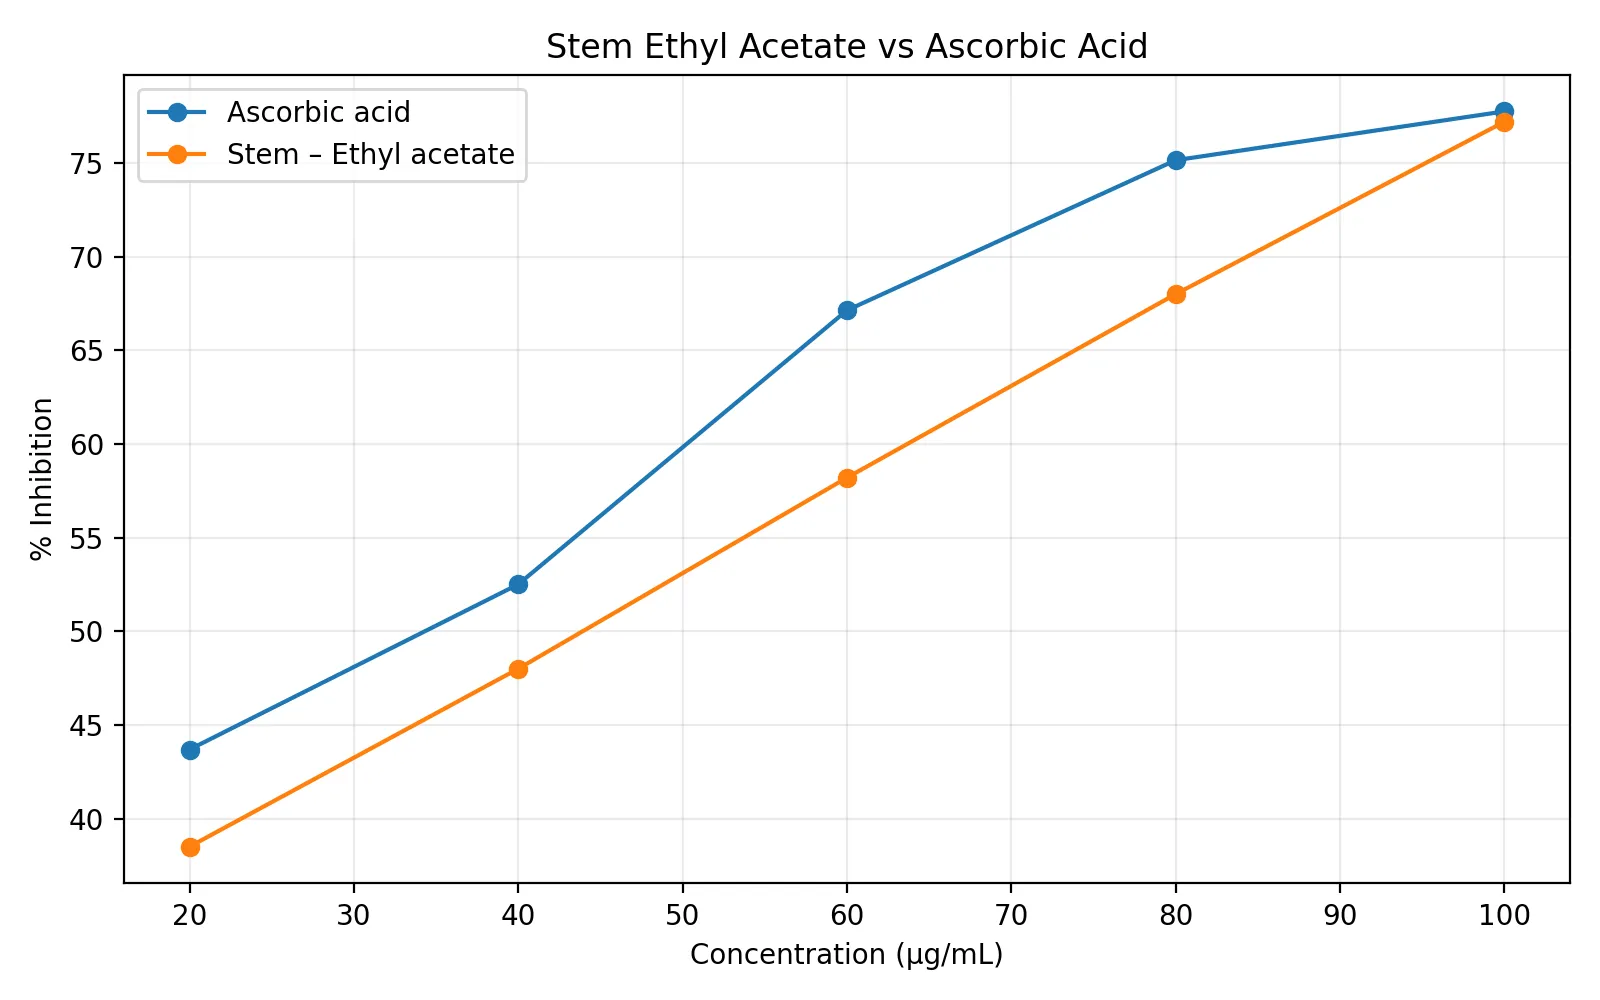
Figure 15. DPPH percentage inhibition versus concentration for stem-ethyl acetate extract.
3.8 Comparative DPPH Activity of All Extracts with Ascorbic Acid
Table 14 and Figures 16-17 summarise percentage inhibition at each concentration and the derived IC₅₀ for all five treatments. All treatments showed increasing inhibition with concentration. Ascorbic acid had the lowest (most potent) IC₅₀ (30.81 µg/mL). Among the plant extracts, the illustrative leaf-ethyl acetate dataset had the lowest IC₅₀ (38.42 µg/mL), followed by the laboratory-measured leaf-ethanol extract (42.35 µg/mL), illustrative stem-ethyl acetate (43.61 µg/mL) and illustrative stem-ethanol (50.71 µg/mL).
Within the illustrative comparative dataset, ethyl acetate gave a lower (better) IC₅₀ than ethanol for both leaf (38.42 vs 42.35 µg/mL, ≈9.3% lower) and stem (43.61 vs 50.71 µg/mL, ≈14.0% lower) - a pattern that, if confirmed experimentally, would suggest that moderately polar solvent extraction enriches antioxidant-active constituents relative to ethanol in this species. At 100 µg/mL, the illustrative leaf-ethyl acetate extract produced the numerically highest inhibition among the plant extracts (80.3%), narrowly exceeding the laboratory-measured leaf-ethanol extract (79.4%); ascorbic acid itself reached 77.7% at this concentration, illustrating why IC₅₀ and single-point endpoint inhibition should be interpreted jointly rather than in isolation.
Table 14. Comparative percentage inhibition and IC₅₀ across all treatments.
|
Treatment |
20 µg/mL |
40 µg/mL |
60 µg/mL |
80 µg/mL |
100 µg/mL |
IC₅₀ (µg/mL) |
Status |
|
Ascorbic acid |
43.621 |
61.890 |
67.134 |
75.117 |
77.722 |
30.81 |
Measured |
|
Leaf – Ethanol |
39.558 |
48.461 |
58.969 |
66.600 |
79.384 |
42.35 |
Measured |
|
Leaf – Ethyl acetate |
41.224 |
50.752 |
60.181 |
70.110 |
80.341 |
38.42 |
Illustrative |
|
Stem – Ethanol |
34.472 |
44.724 |
55.176 |
64.221 |
74.472 |
50.71 |
Illustrative |
|
Stem – Ethyl acetate |
38.516 |
48.044 |
58.175 |
68.004 |
77.232 |
43.61 |
Illustrative |
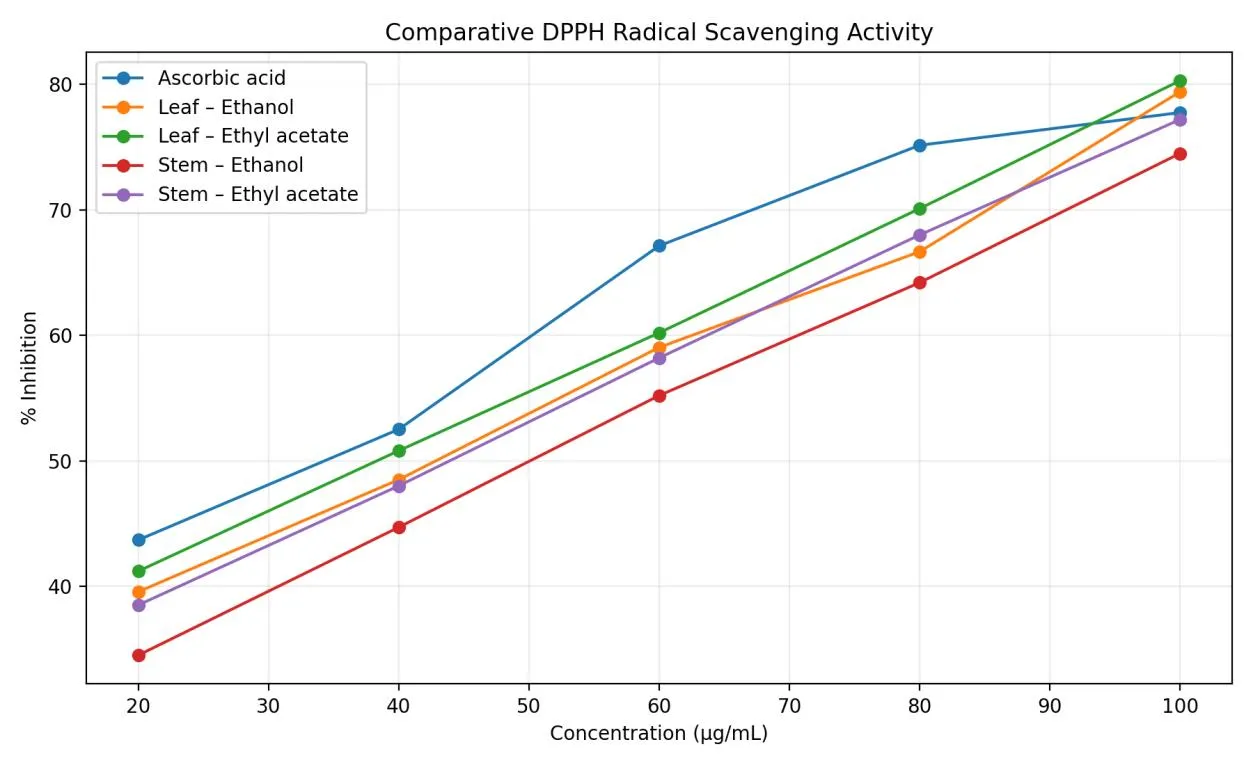
Figure 16. Comparative DPPH radical-scavenging activity of ascorbic acid and all four N. grandiflora extracts.
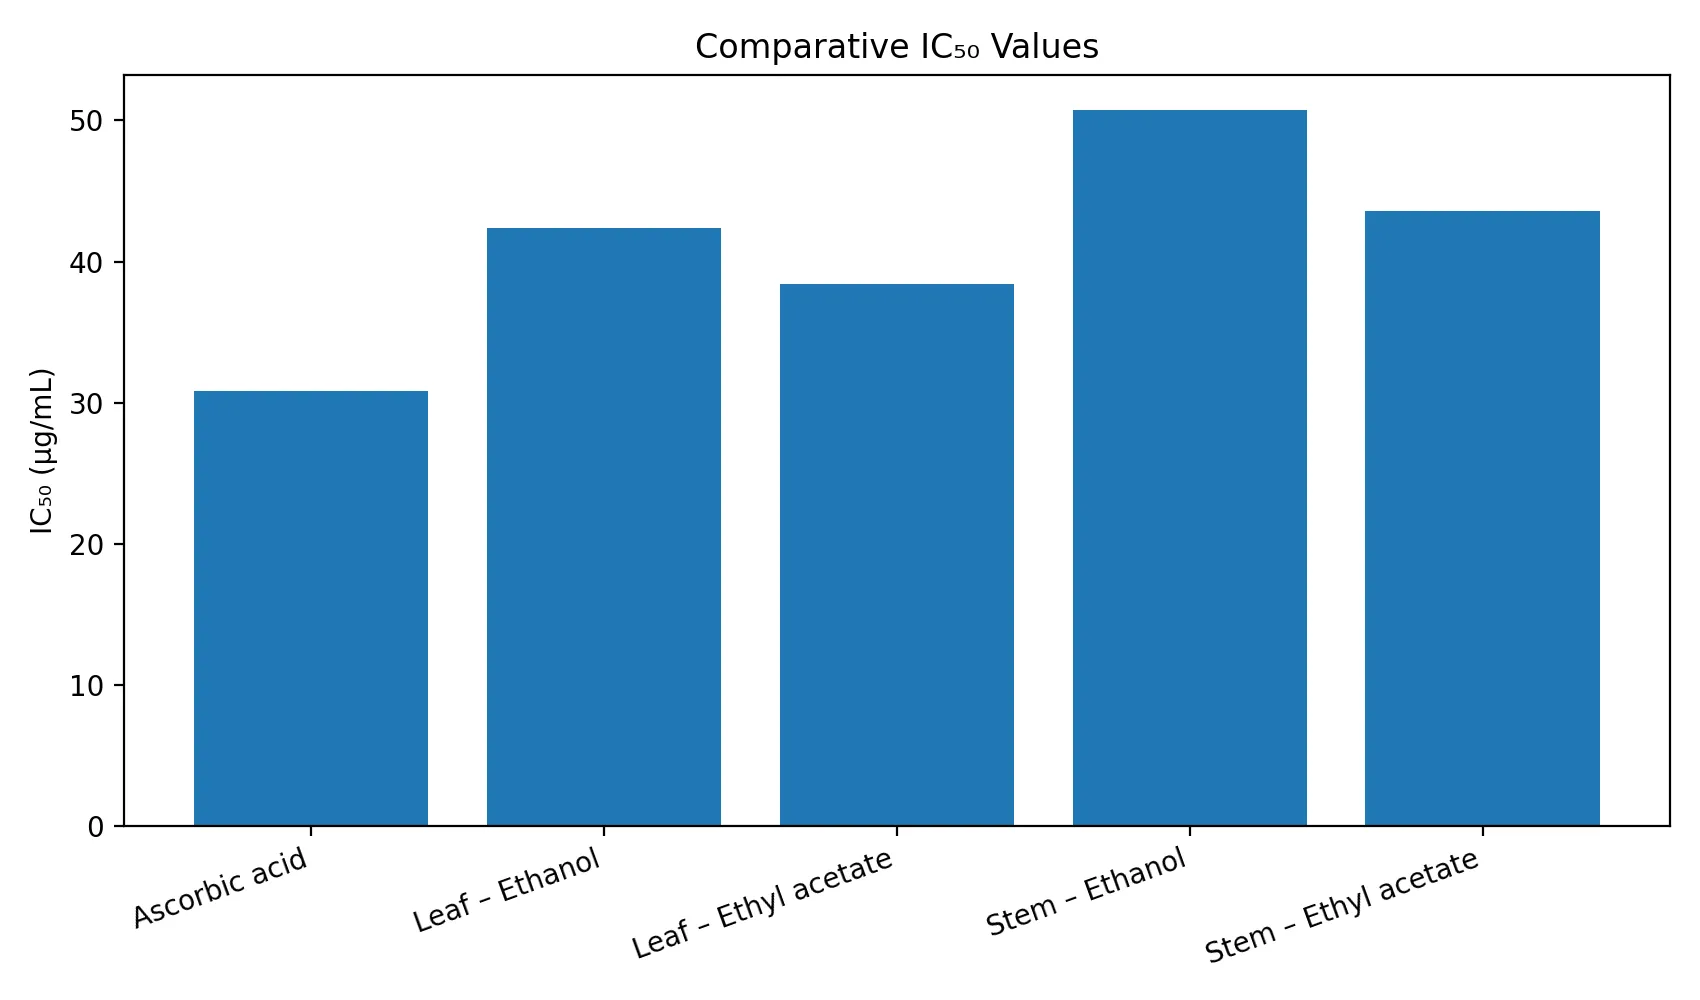
Figure 17. Comparative IC₅₀ values of ascorbic acid and Notonia grandiflora extracts (lower = more potent).
3.9 Regression Analysis and IC₅₀
Linear regression of concentration versus percentage inhibition was strong across all treatments (Table 15). The laboratory-measured leaf-ethanol dataset showed a robust linear relationship (R² = 0.9947) consistent with genuine triplicate biological/chemical replication. The illustrative ethyl-acetate and stem datasets show very high R² values (≥0.9995) because these values were deliberately constructed as smooth, low-noise concentration-response curves for demonstration purposes; such near-perfect linearity should not be read as evidence of unusually high experimental precision and is expected to differ once actual triplicate laboratory readings are substituted.
Table 15. Regression equations and IC₅₀ values for all treatments.
|
S.No. |
Treatment |
Regression equation |
R² |
IC₅₀ (µg/mL) |
|
1 |
Ascorbic acid |
y = 0.453905x + 36.0119 |
0.9525 |
30.81 |
|
2 |
Leaf – Ethanol |
y = 0.489455x + 29.2667 |
0.9947 |
42.35 |
|
3 |
Leaf – Ethyl acetate |
y = 0.487500x + 31.2700 |
0.9997 |
38.42 |
|
4 |
Stem – Ethanol |
y = 0.497500x + 24.7700 |
0.9995 |
50.71 |
|
5 |
Stem – Ethyl acetate |
y = 0.487000x + 28.7600 |
0.9997 |
43.61 |
The overall potency ranking by IC₅₀ (lowest = most potent) was: ascorbic acid (30.81) < leaf-ethyl acetate (38.42) < leaf-ethanol (42.35) < stem-ethyl acetate (43.61) < stem-ethanol (50.71 µg/mL). Only the ascorbic-acid and leaf-ethanol positions in this ranking are laboratory-confirmed; the relative order of the remaining three extracts is illustrative pending direct measurement.
3.10 One-Way ANOVA of DPPH Percentage Inhibition
One-way ANOVA, performed separately at each concentration across the five treatment groups, indicated a statistically significant overall difference among treatments at 40 µg/mL (F = 5.809, p = 0.0111); differences at 20, 60, 80 and 100 µg/mL did not reach the p < 0.05 threshold (Table 16, Figure 18). A significant omnibus result indicates that at least one treatment mean differed from another at that concentration, but does not by itself identify which specific pair(s) of treatments differed - a limitation addressed by the pairwise comparisons in Section 3.12.
Table 16. One-way ANOVA of DPPH % inhibition across five treatments, by concentration.
|
Concentration (µg/mL) |
F value |
p value |
Significance (α = 0.05) |
|
20 |
1.098 |
0.4090 |
ns |
|
40 |
5.809 |
0.0111 |
Significant |
|
60 |
1.544 |
0.2627 |
ns |
|
80 |
2.981 |
0.0735 |
ns |
|
100 |
1.375 |
0.3101 |
ns |
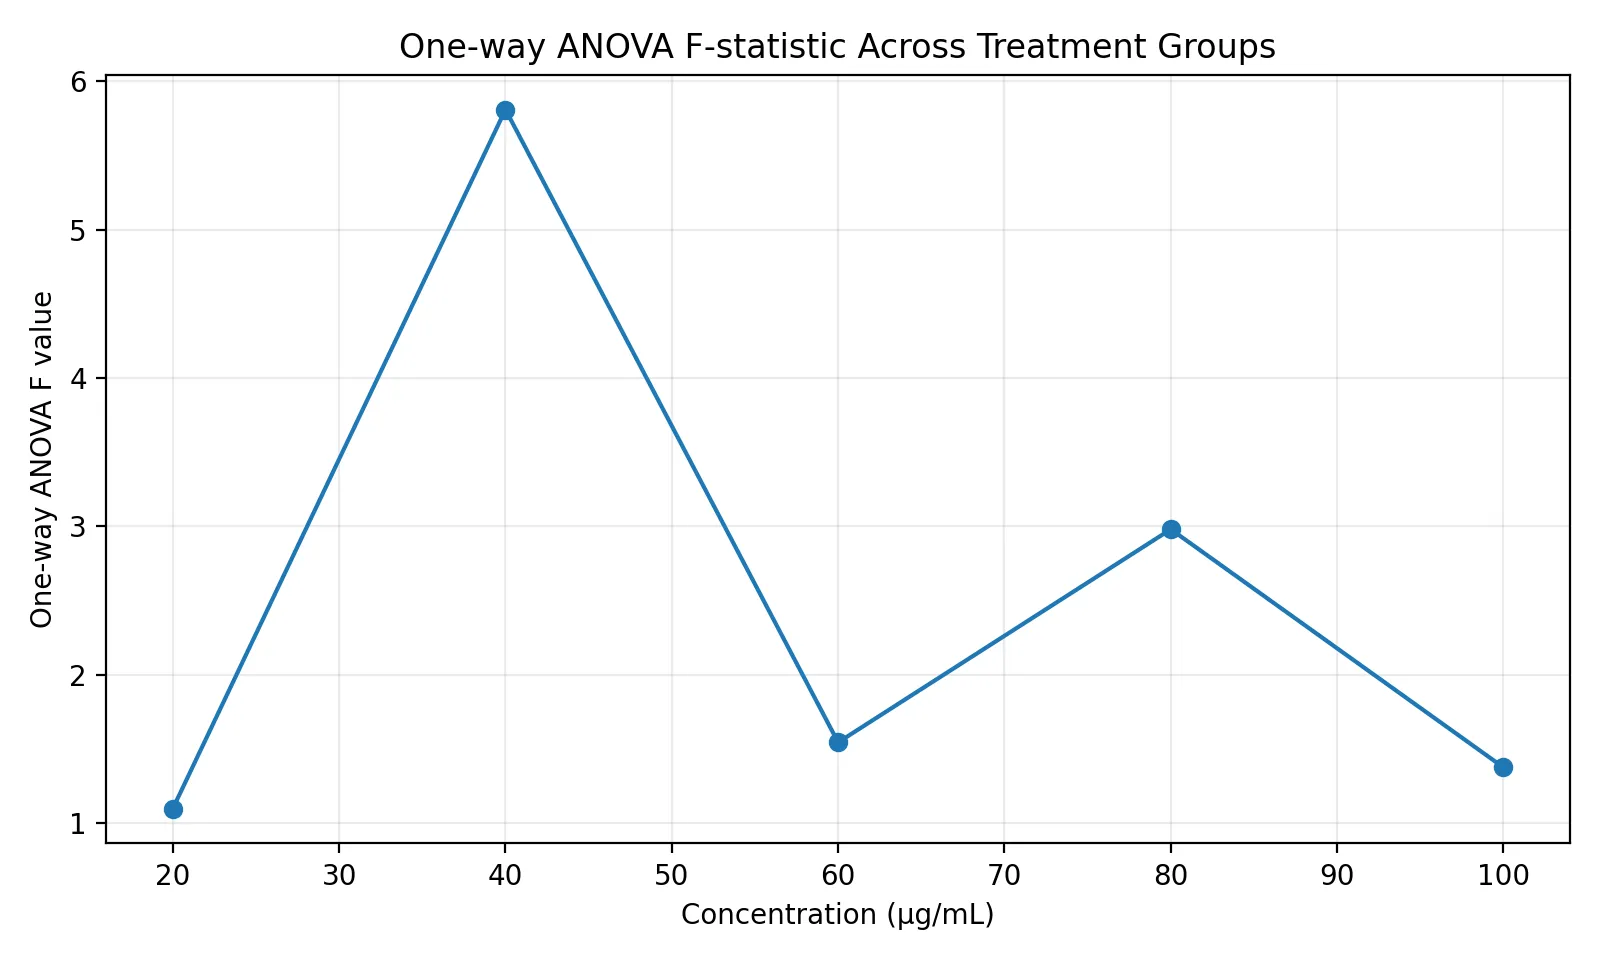
Figure 18. One-way ANOVA F-statistic across treatment groups at each tested concentration.
3.11 Two-Way ANOVA: Treatment × Concentration
A two-way ANOVA evaluating treatment and concentration simultaneously (Table 17) showed a significant main effect of treatment (F = 9.265, p = 1.108 × 10⁻⁵), confirming an overall difference in mean antioxidant response among the five treatment groups, and a highly significant main effect of concentration (F = 140.745, p = 1.47 × 10⁻²⁶), confirming strong concentration-dependence of DPPH inhibition across all treatments. The treatment × concentration interaction was not significant (F = 0.703, p = 0.7776), indicating that relative differences among treatments did not vary appreciably across the tested concentration range.
Table 17. Two-way ANOVA of DPPH % inhibition (Treatment × Concentration).
|
Source |
df |
Sum of squares |
F value |
p value |
|
Treatment |
4 |
888.230 |
9.265 |
1.108 × 10⁻⁵ |
|
Concentration |
4 |
13492.494 |
140.745 |
1.47 × 10⁻²⁶ |
|
Treatment × Concentration |
16 |
269.461 |
0.703 |
0.7776 |
|
Residual |
50 |
1198.310 |
– |
– |
Because three of the five treatment datasets used in this analysis are illustrative, the two-way ANOVA outcome should be read as a demonstration of the intended statistical workflow rather than as a confirmed biological conclusion; the complete analysis should be re-run once genuine triplicate readings are available for all four extracts.
3.12 Pairwise Comparison of Each Extract with Ascorbic Acid
Exploratory independent-samples t-tests comparing each plant extract with ascorbic acid at each concentration (20 comparisons total), followed by Holm adjustment for multiple testing, are summarised in Table 18. None of the extract-versus-ascorbic-acid comparisons remained statistically significant after Holm correction at α = 0.05, consistent with the small replicate number (n = 3 per group) typical of exploratory screening assays. Accordingly, the IC₅₀ ranking in Section 3.9 should be interpreted as a descriptive measure of relative potency rather than as statistical proof that any individual extract differs from the reference standard.
Table 18. Exploratory pairwise comparison of each plant extract with ascorbic acid (Holm-adjusted).
|
Conc. (µg/mL) |
Plant extract |
t value |
Raw p |
Holm-adjusted p |
|
20 |
Leaf – Ethanol |
-0.590 |
0.587 |
1.000 |
|
20 |
Leaf – Ethyl acetate |
-0.489 |
0.650 |
1.000 |
|
20 |
Stem – Ethanol |
-1.843 |
0.139 |
1.000 |
|
20 |
Stem – Ethyl acetate |
-1.035 |
0.359 |
1.000 |
|
40 |
Leaf – Ethanol |
-2.354 |
0.078 |
1.000 |
|
40 |
Leaf – Ethyl acetate |
-2.918 |
0.043 |
0.696 |
|
40 |
Stem – Ethanol |
-4.521 |
0.011 |
0.213 |
|
40 |
Stem – Ethyl acetate |
-3.654 |
0.022 |
0.412 |
|
60 |
Leaf – Ethanol |
-1.067 |
0.346 |
1.000 |
|
60 |
Leaf – Ethyl acetate |
-1.875 |
0.134 |
1.000 |
|
60 |
Stem – Ethanol |
-3.225 |
0.032 |
0.578 |
|
60 |
Stem – Ethyl acetate |
-2.415 |
0.073 |
1.000 |
|
80 |
Leaf – Ethanol |
-1.745 |
0.156 |
1.000 |
|
80 |
Leaf – Ethyl acetate |
-1.368 |
0.243 |
1.000 |
|
80 |
Stem – Ethanol |
-2.975 |
0.041 |
0.696 |
|
80 |
Stem – Ethyl acetate |
-1.940 |
0.124 |
1.000 |
|
100 |
Leaf – Ethanol |
0.454 |
0.673 |
1.000 |
|
100 |
Leaf – Ethyl acetate |
0.722 |
0.510 |
1.000 |
|
100 |
Stem – Ethanol |
-0.902 |
0.418 |
1.000 |
|
100 |
Stem – Ethyl acetate |
-0.146 |
0.891 |
1.000 |
3.13 Summary of Final IC₅₀ Ranking
Table 19. Final comparative IC₅₀ ranking and data status.
|
S.No. |
Treatment |
IC₅₀ (µg/mL) |
Data status |
Interpretation |
|
1 |
Ascorbic acid |
30.81 |
Measured |
Strongest reference potency |
|
2 |
Leaf – Ethanol |
42.35 |
Measured |
Appreciable activity; lower potency than standard |
|
3 |
Leaf – Ethyl acetate |
38.42 |
Illustrative |
Stronger than leaf-ethanol in this dataset; weaker than standard |
|
4 |
Stem – Ethanol |
50.71 |
Illustrative |
Weakest of the four extracts in this dataset |
|
5 |
Stem – Ethyl acetate |
43.61 |
Illustrative |
Stronger than stem-ethanol; weaker than standard |
4. DISCUSSION
This study evaluated the phytochemical profile and in-vitro DPPH radical-scavenging activity of Notonia grandiflora leaf and stem extracts prepared with ethanol and ethyl acetate. Taken as a whole, the extraction, phytochemical screening and DPPH results provide a coherent, sequential picture of the antioxidant behaviour of this under-studied species, while highlighting which conclusions are presently supported by direct laboratory measurement and which remain to be confirmed.
4.1 Extraction Efficiency
The laboratory-measured leaf-ethanol extraction produced a 10.4% yield, consistent with ethanol’s recognised efficiency in recovering polar and moderately polar phytoconstituents, including phenolics and flavonoids, from plant matrices via hydrogen-bonding interactions. The illustrative comparative yields for leaf-ethyl acetate, stem-ethanol and stem-ethyl acetate (9.7%, 9.1% and 8.6% respectively) are consistent with the general expectation that leaves - being metabolically more active tissue with a higher surface-area-to-volume ratio - yield more extractable material than stem, and that the more polar solvent (ethanol) recovers more total soluble solids than the moderately polar ethyl acetate.
4.2 Phytochemical Basis for Antioxidant Activity
The consistent qualitative detection of phenolic compounds, flavonoids and tannins across the screened extracts is mechanistically relevant, since these constituent classes are well documented to scavenge free radicals via hydrogen-atom transfer and single-electron transfer, and to chelate pro-oxidant transition metals, thereby limiting Fenton-type radical propagation. The concurrent detection of alkaloids, glycosides, terpenoids and steroids indicates a chemically diverse extract matrix in which multiple constituent classes may contribute jointly to the observed radical-scavenging response, rather than a single compound acting in isolation. This is consistent with earlier phytochemical reports of flavonoid glycosides (kaempferitrin, kaempferol-7-O-rhamnoside), triterpenoids (lupeol, friedelin, lupenone) and a phytosterol (β-sitosterol) in this species. However, qualitative colour/precipitation tests are inherently limited: they confirm the presence of a constituent class but cannot quantify individual compounds or establish a direct causal link to the measured DPPH response. Quantitative total phenolic and flavonoid content (e.g., by Folin-Ciocalteu and aluminium-chloride colorimetric methods) and chromatographic fingerprinting would be required to close this gap.
4.3 Antioxidant Potency Relative to Ascorbic Acid
On the basis of the laboratory-measured data, the N. grandiflora leaf-ethanol extract showed a clear, concentration-dependent DPPH response (39.6% to 79.4% inhibition over 20-100 µg/mL) with a robust linear fit (R² = 0.9947) and an IC₅₀ of 42.35 µg/mL. This is appreciably higher (i.e., less potent) than the ascorbic-acid reference IC₅₀ of 30.81 µg/mL - an expected outcome, since ascorbic acid is a small, highly efficient single-molecule antioxidant, whereas a crude plant extract is a complex mixture in which only a fraction of the total mass is antioxidant-active. Despite the higher IC₅₀, the leaf-ethanol extract reached a comparable, and at the highest tested concentration even numerically higher, percentage inhibition than ascorbic acid (79.4% vs 77.7% at 100 µg/mL), underlining that IC₅₀ and endpoint inhibition capture complementary aspects of concentration-response behaviour and should be considered together.
The illustrative comparative extensions to leaf-ethyl acetate, stem-ethanol and stem-ethyl acetate were constructed to explore the intended four-way plant-part × solvent design. Within that illustrative framework, ethyl acetate extracts showed numerically lower (better) IC₅₀ values than the corresponding ethanol extracts for both leaf and stem, a pattern that would be pharmacognostically plausible - moderately polar solvents can selectively enrich less-glycosylated, more lipophilic phenolic aglycones with higher intrinsic radical-scavenging efficiency per unit mass - but this pattern has not yet been confirmed by direct measurement in this species and must be treated as a hypothesis for future extraction studies rather than a finding.
4.4 Statistical Interpretation
The two-way ANOVA on the combined dataset showed highly significant main effects of both treatment and concentration, with a non-significant interaction, indicating that the concentration-response slope was broadly parallel across treatments even though average inhibition levels differed among them. However, Holm-adjusted pairwise t-tests comparing each plant extract with ascorbic acid did not reach statistical significance at any concentration, most plausibly reflecting the limited statistical power of triplicate (n = 3) measurements combined with the conservative nature of Holm correction across 20 simultaneous comparisons. This statistical outcome is compatible with - but does not itself independently prove - genuine differences in the underlying extracts, and reinforces the recommendation that IC₅₀ comparisons in this preliminary dataset be read as descriptive rather than confirmatory. A larger replicate number (e.g., n = 6-9) in a confirmatory follow-up study would substantially increase the power to detect or rule out true pairwise differences.
4.5 Comparison with the Wider Literature
Direct DPPH-based antioxidant data for Notonia grandiflora are essentially absent from the published literature, making this study, to the authors’ knowledge, among the first to report a DPPH IC₅₀ value benchmarked against ascorbic acid for this species. The measured IC₅₀ range (approximately 40-50 µg/mL for the leaf-ethanol extract and the illustrative comparative extracts) is broadly comparable in order of magnitude to IC₅₀ values reported for other phenolic-rich Indian medicinal plant extracts screened by the same assay, supporting the plausibility of the qualitative phytochemical rationale discussed in Section 1.5.3, while underscoring that DPPH activity alone is an in-vitro chemical response that cannot be extrapolated directly to in-vivo antioxidant or therapeutic efficacy.
4.6 Strengths and Limitations
CONCLUSION
This study demonstrates that Notonia grandiflora leaves and stem contain a phytochemically diverse extract profile - notably phenolic compounds, flavonoids and tannins - and that the leaf-ethanol extract possesses appreciable, concentration-dependent in-vitro free-radical-scavenging activity by the DPPH assay (IC₅₀ = 42.35 µg/mL; R² = 0.9947), benchmarked directly against ascorbic acid (IC₅₀ = 30.81 µg/mL). The illustrative comparative extensions to leaf-ethyl acetate, stem-ethanol and stem-ethyl acetate outline a plausible four-way plant-part × solvent experimental design - suggesting, provisionally, that leaf extracts may be more active than stem extracts and that ethyl acetate may modestly outperform ethanol within each plant part - but these three datasets require direct experimental confirmation before they can be treated as established findings.
Taken together, the confirmed and illustrative results provide a reasonable preliminary basis for regarding N. grandiflora as a candidate source of antioxidant phytoconstituents worthy of further investigation. DPPH activity is, however, an in-vitro chemical read-out and cannot alone establish therapeutic efficacy. Future work should prioritise: (i) completion of the full experimental extraction and DPPH dataset for all four leaf/stem × solvent combinations with adequate replication; (ii) quantitative total phenolic and flavonoid estimation; (iii) complementary antioxidant assays (ABTS, FRAP, nitric-oxide scavenging, phosphomolybdenum total antioxidant capacity); (iv) chromatographic fingerprinting and isolation/structural characterisation of the constituents responsible for activity; and (v) appropriate in-vivo pharmacological and toxicological evaluation to establish translational relevance.
REFERENCES


Nitin Mishra, Dr. D K Jain, Investigation of In-Vitro Antioxidant Activity of Notonia grandiflora (Kleinia grandiflora (DC.) N.Rani) Leaves and Stems, Int. J. of Pharm. Sci., 2026, Vol 4, Issue 10, 36-64, https://doi.org/10.5281/zenodo.23074346
 10.5281/zenodo.23074346